Skip to content
MapSculpt

GEOGRAPHIC MAP MAKER / ALABAMA

Alabama
Counties Map Maker

Follow growth near Huntsville and compare the two sides of Mobile Bay. Use all 67 Alabama counties to connect your own data to the state’s geography.

Free online editor · No sign-up required

67counties
individually editable

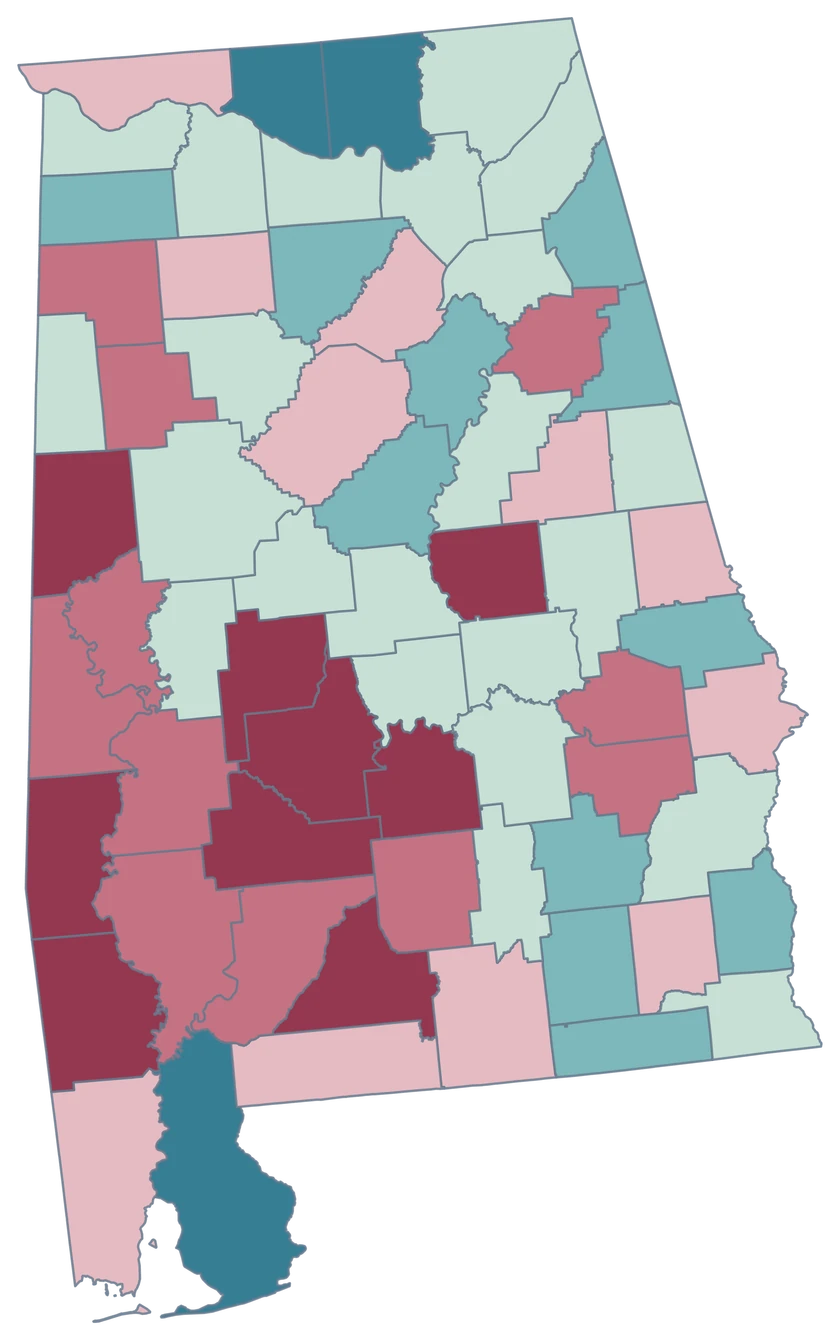
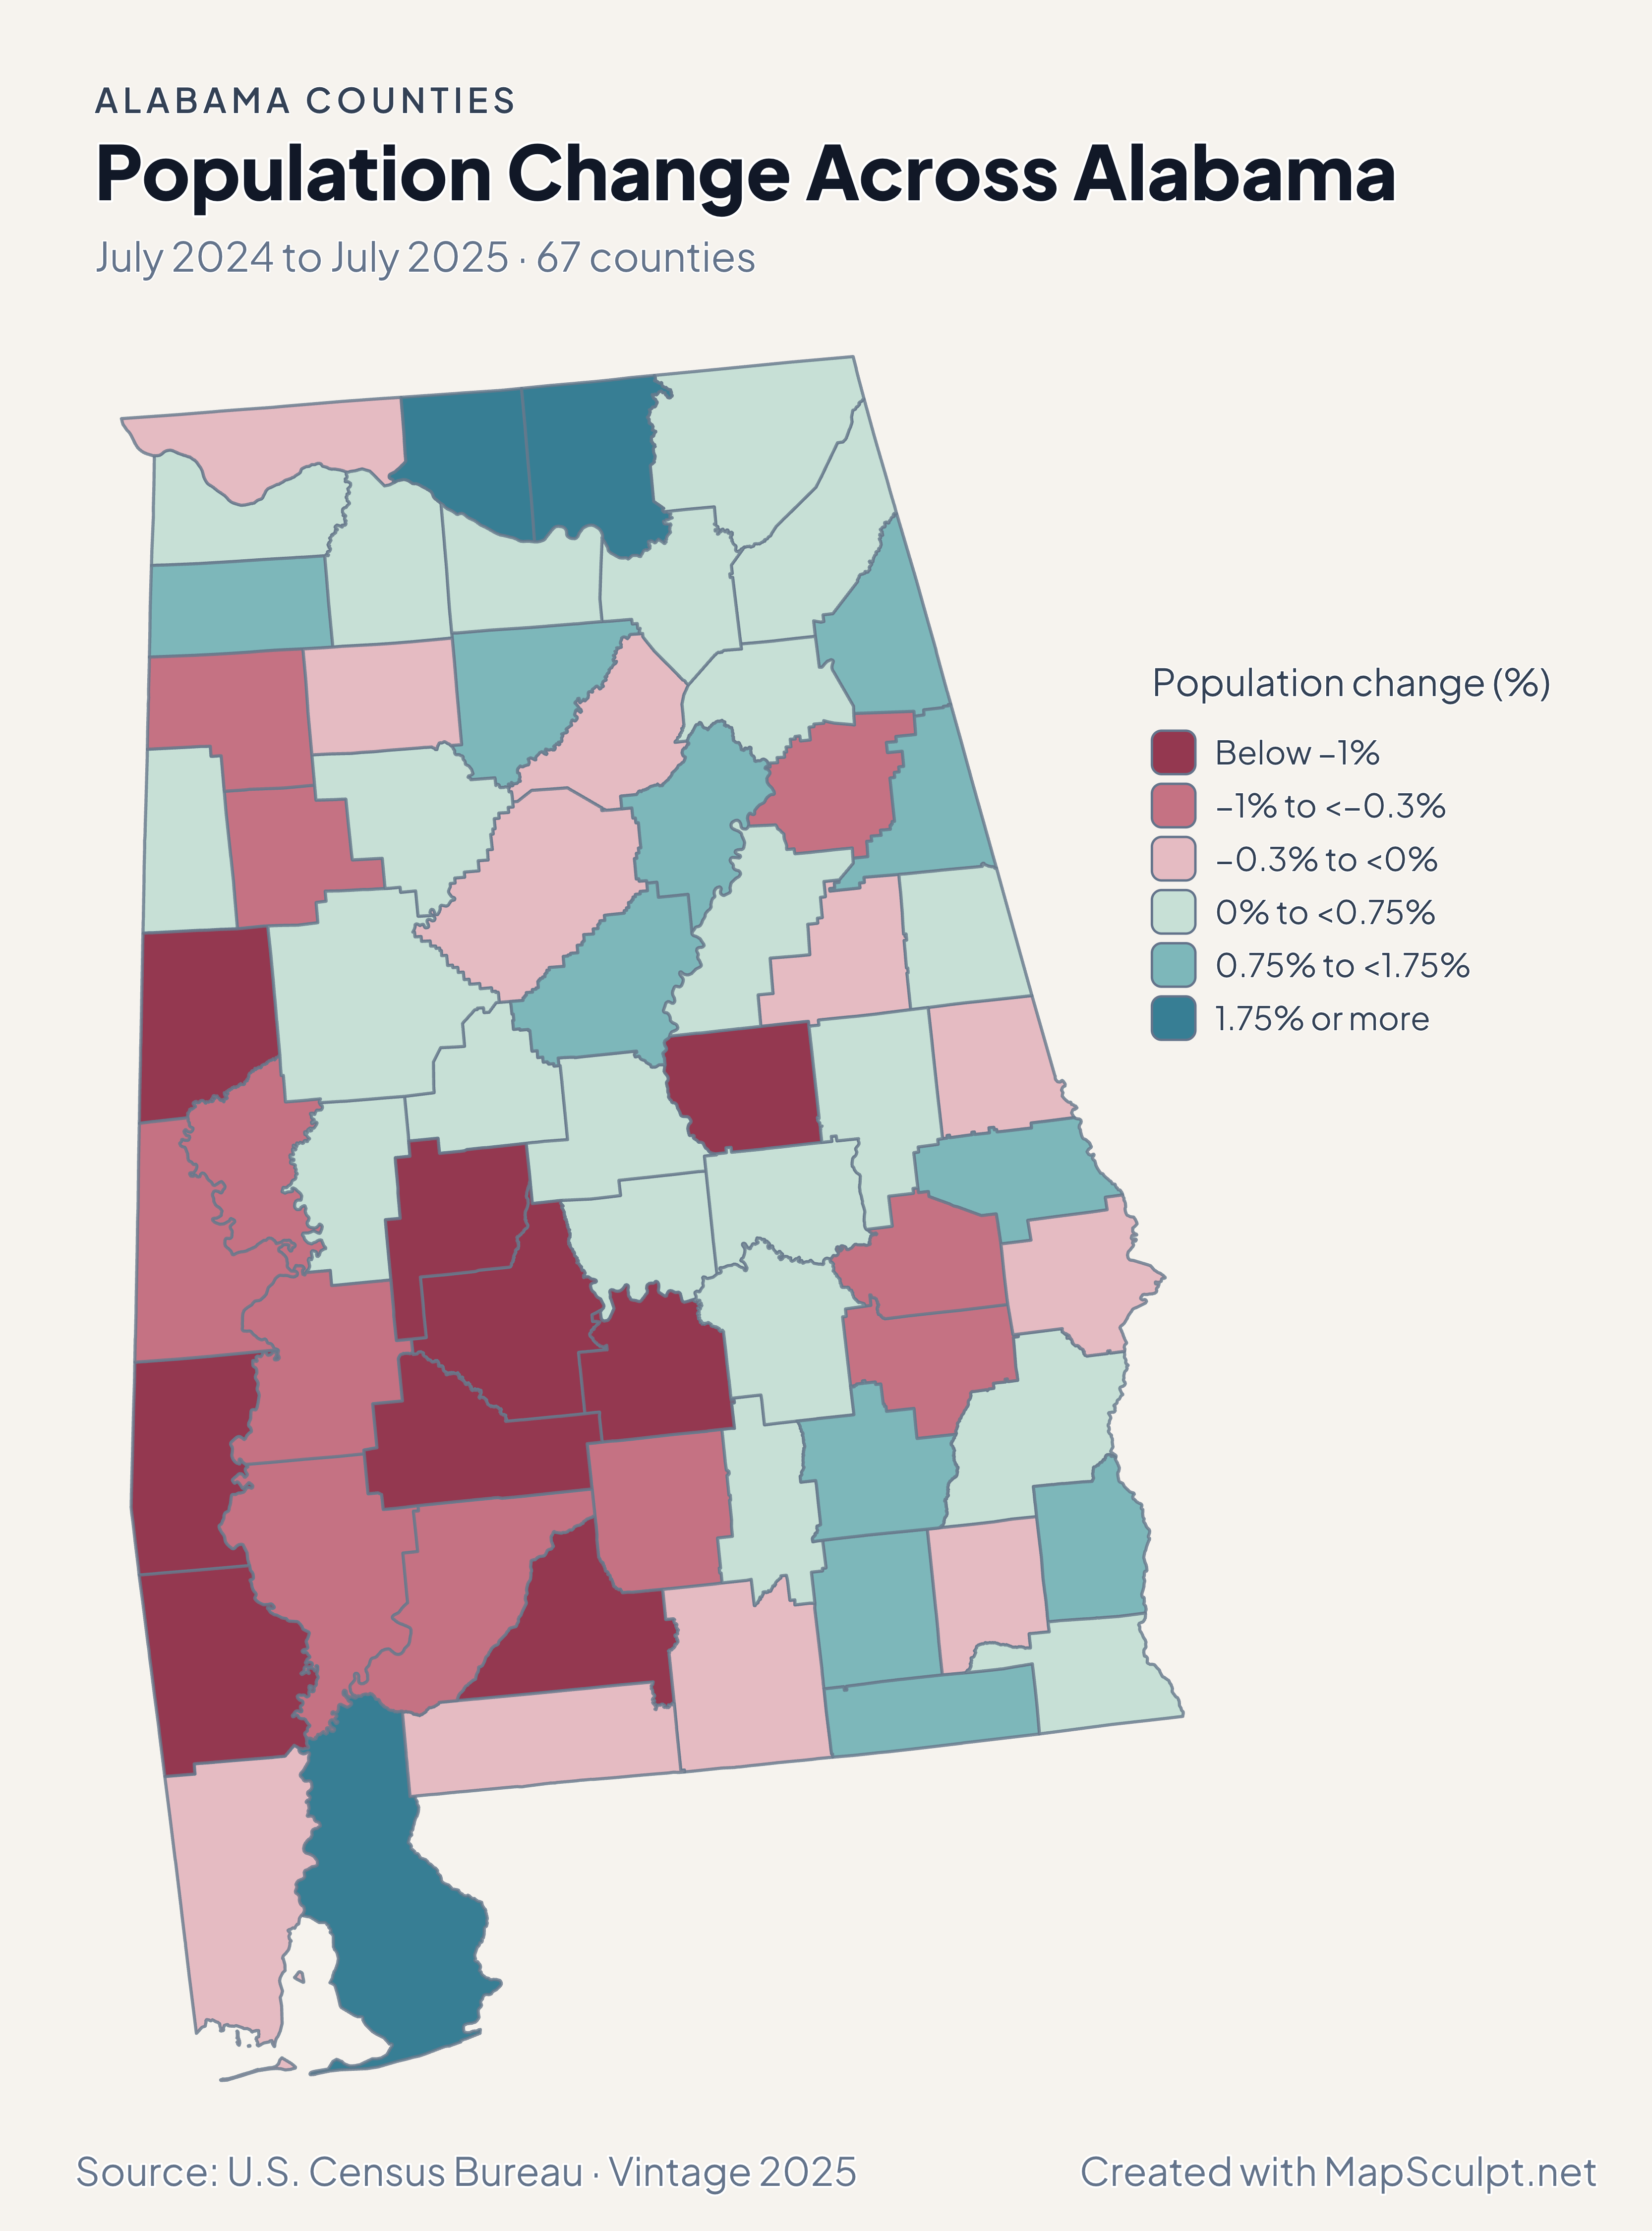
Population Change Across Alabama

July 2024 to July 2025 · 67 counties

Alabama population change with strong gains in Limestone, Madison and Baldwin and a small decline in Mobile.

Population change (%)

  • Below −1%
  • −1% to <−0.3%
  • −0.3% to <0%
  • 0% to <0.75%
  • 0.75% to <1.75%
  • 1.75% or more
U.S. Census Bureau · Vintage 2025Download complete PNG Growth rates compare July 2025 with July 2024 using each county’s own starting population.

KNOW YOUR GEOGRAPHY

The Tennessee Valley, Black Belt and Gulf Coast.

Alabama’s county map spans the Tennessee Valley, central counties and Gulf Coast. Mobile and Baldwin remain separate county features on opposite sides of Mobile Bay.

Select all the pieces of a coastal county through its county identity. Keep the leading zero when joining records, including Baldwin at 01003 and Mobile at 01097.

Browse all county GEOIDs ↗

2025 Census boundaries

OFFICIAL DATA

Northern and coastal gains tell different local stories.

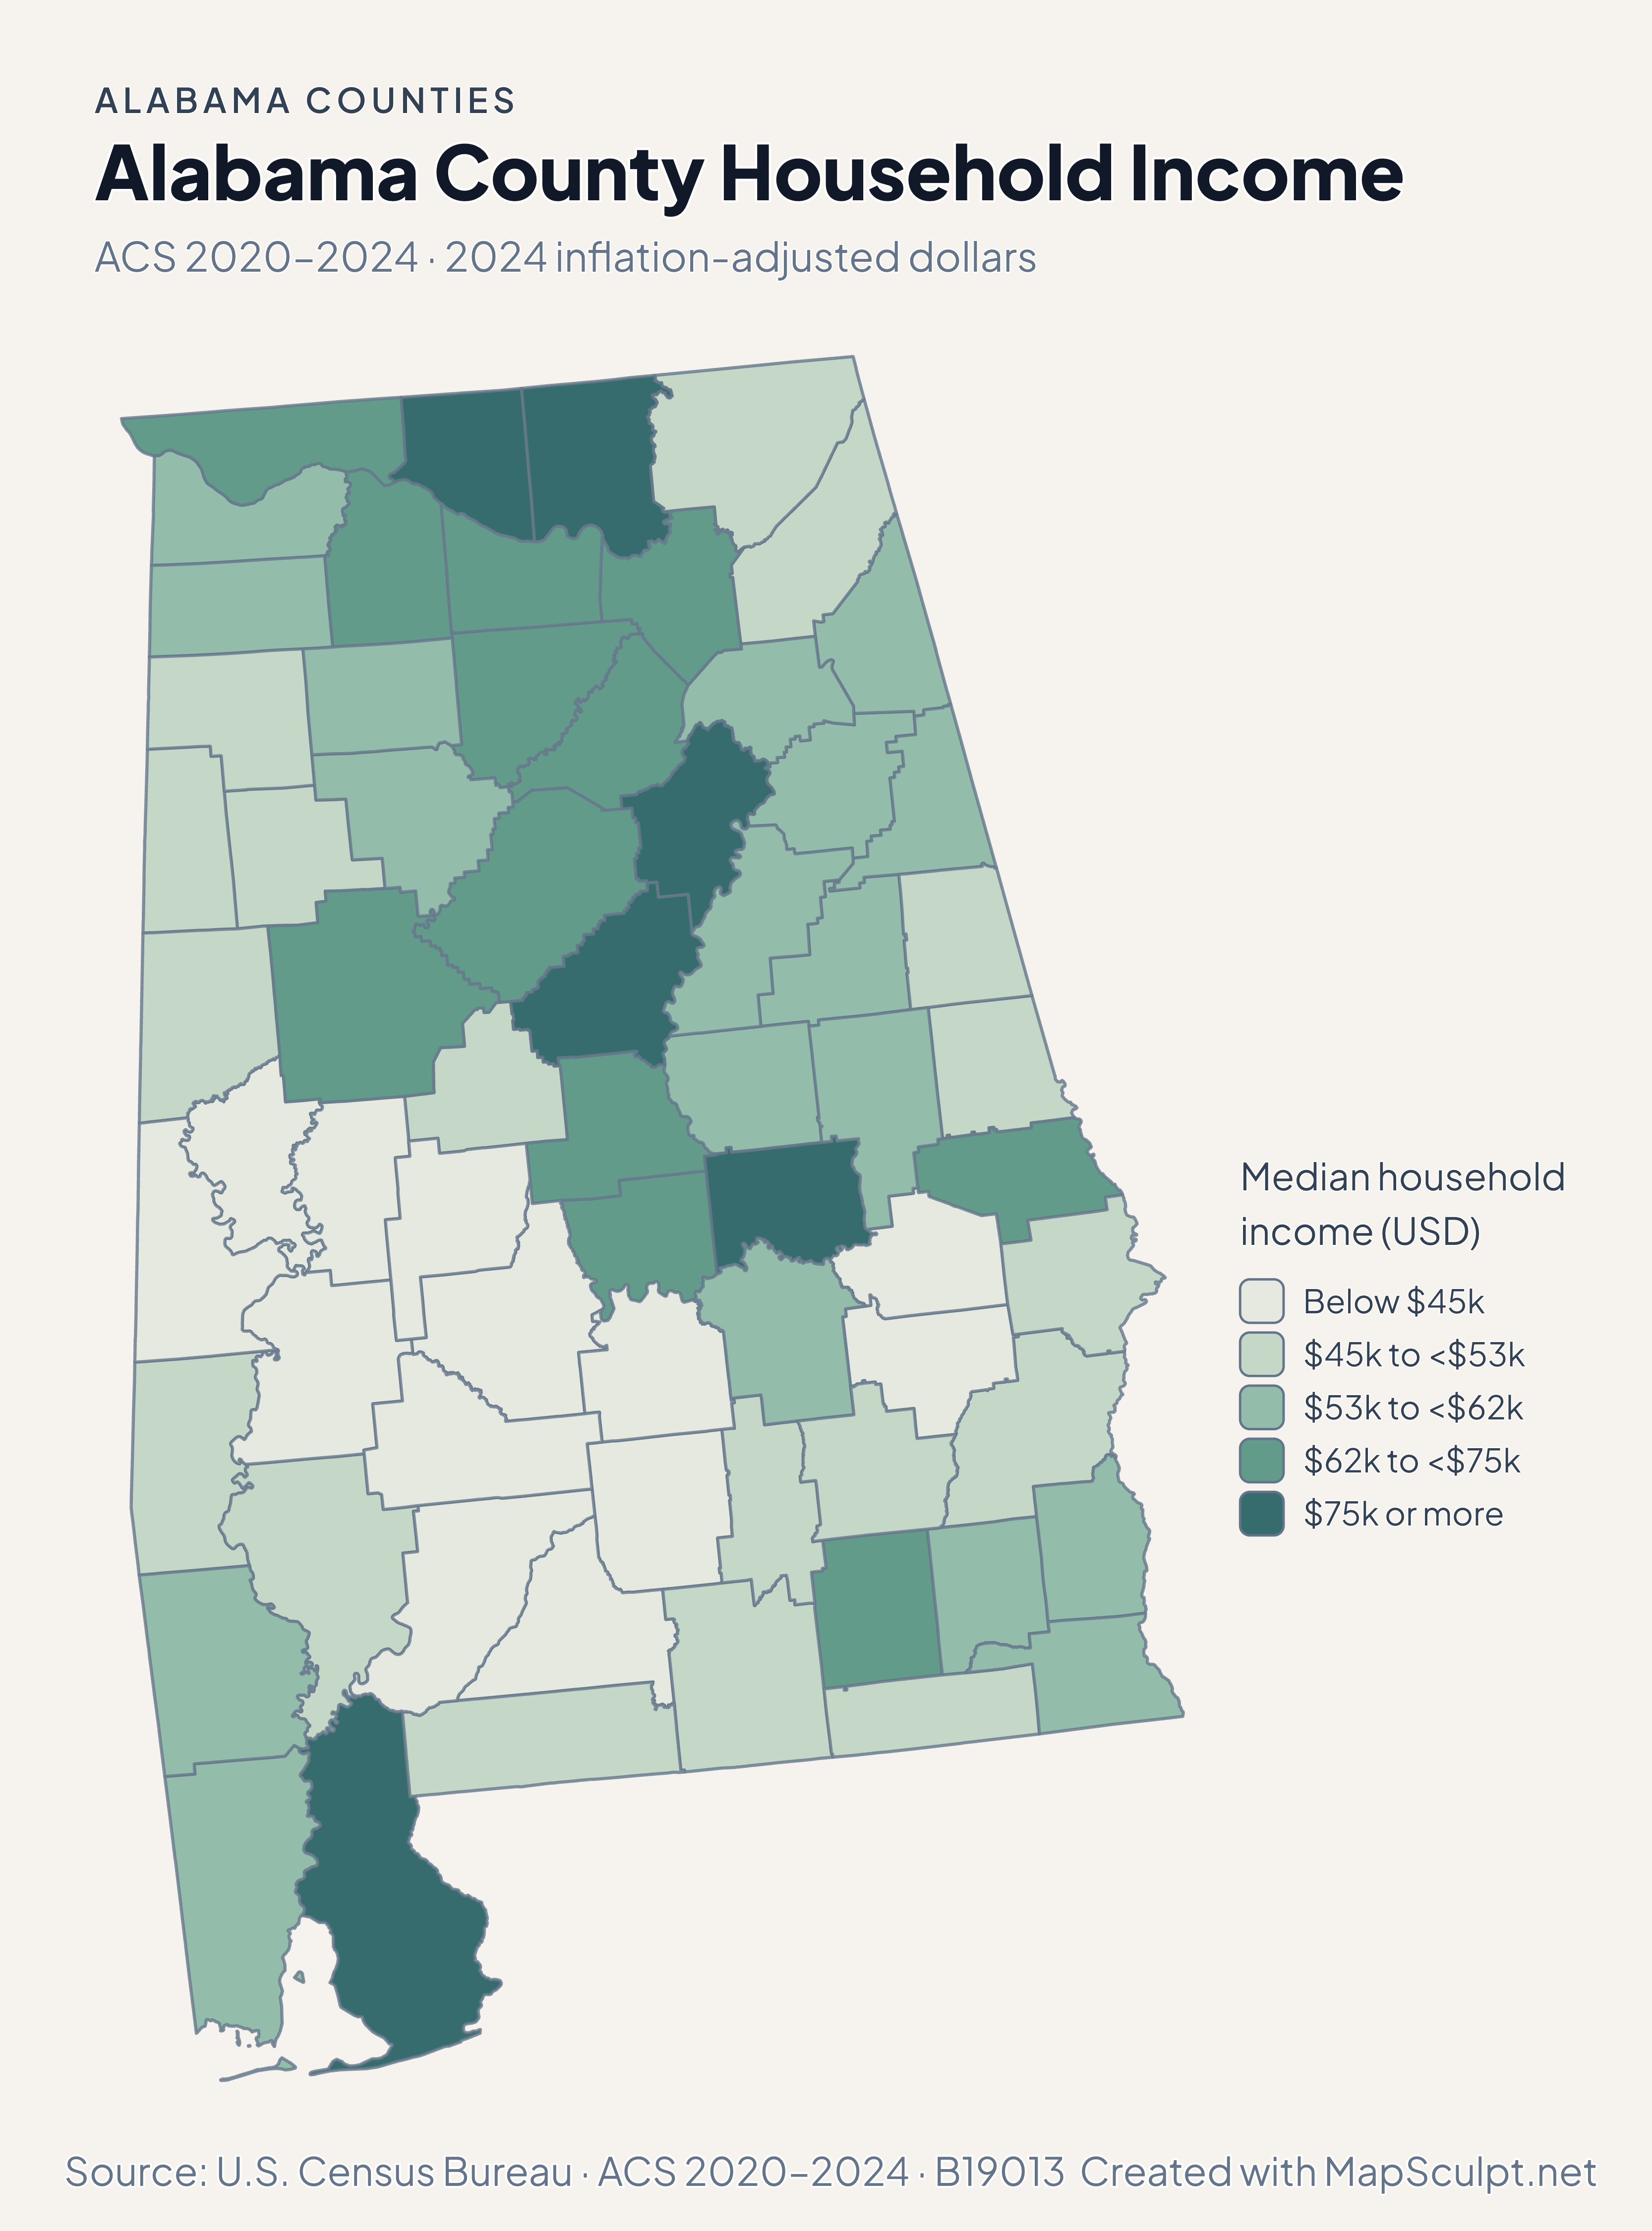
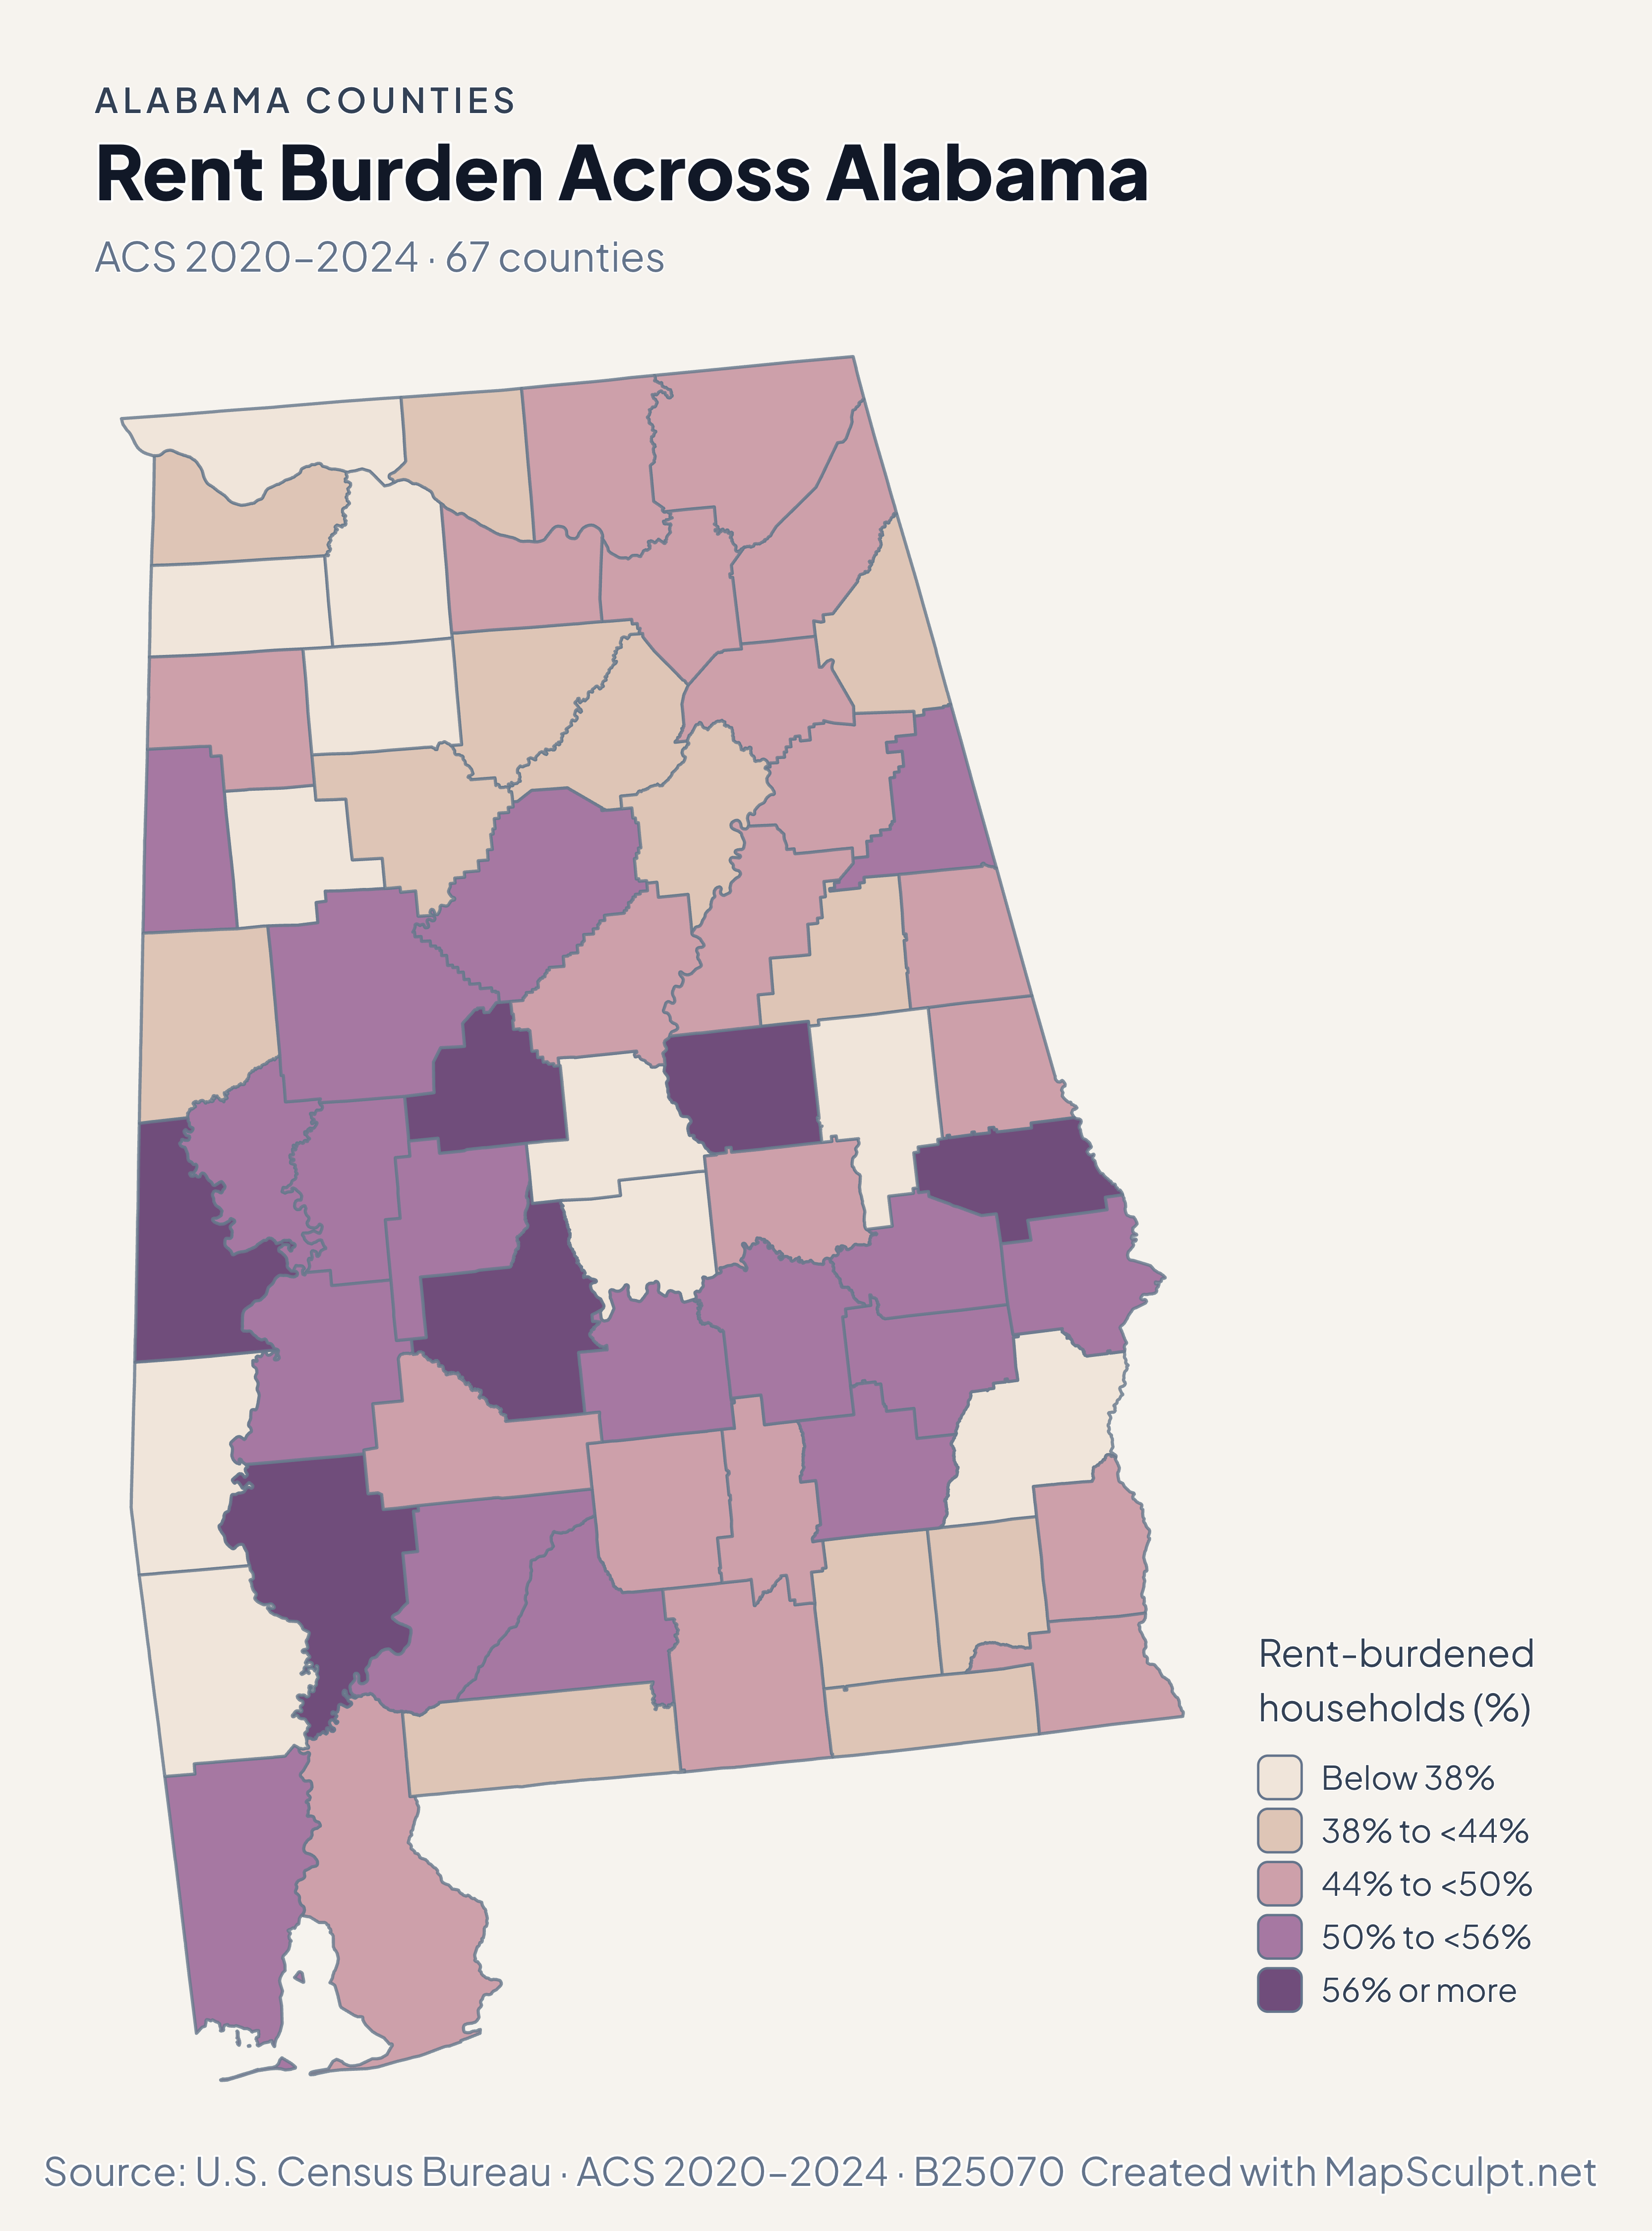
Read population and migration together around Huntsville and Mobile Bay. The ACS examples compare income and renter burden across the same boundaries.

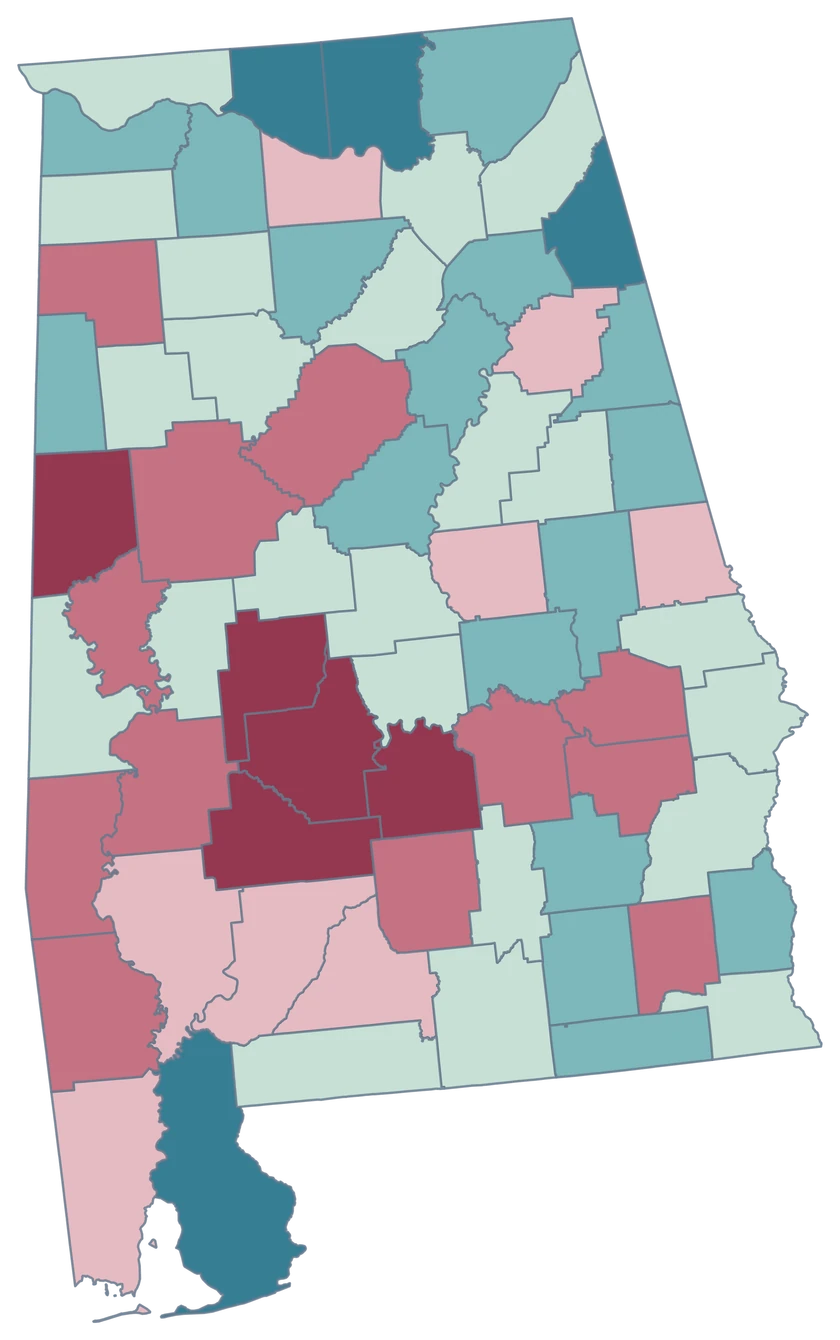
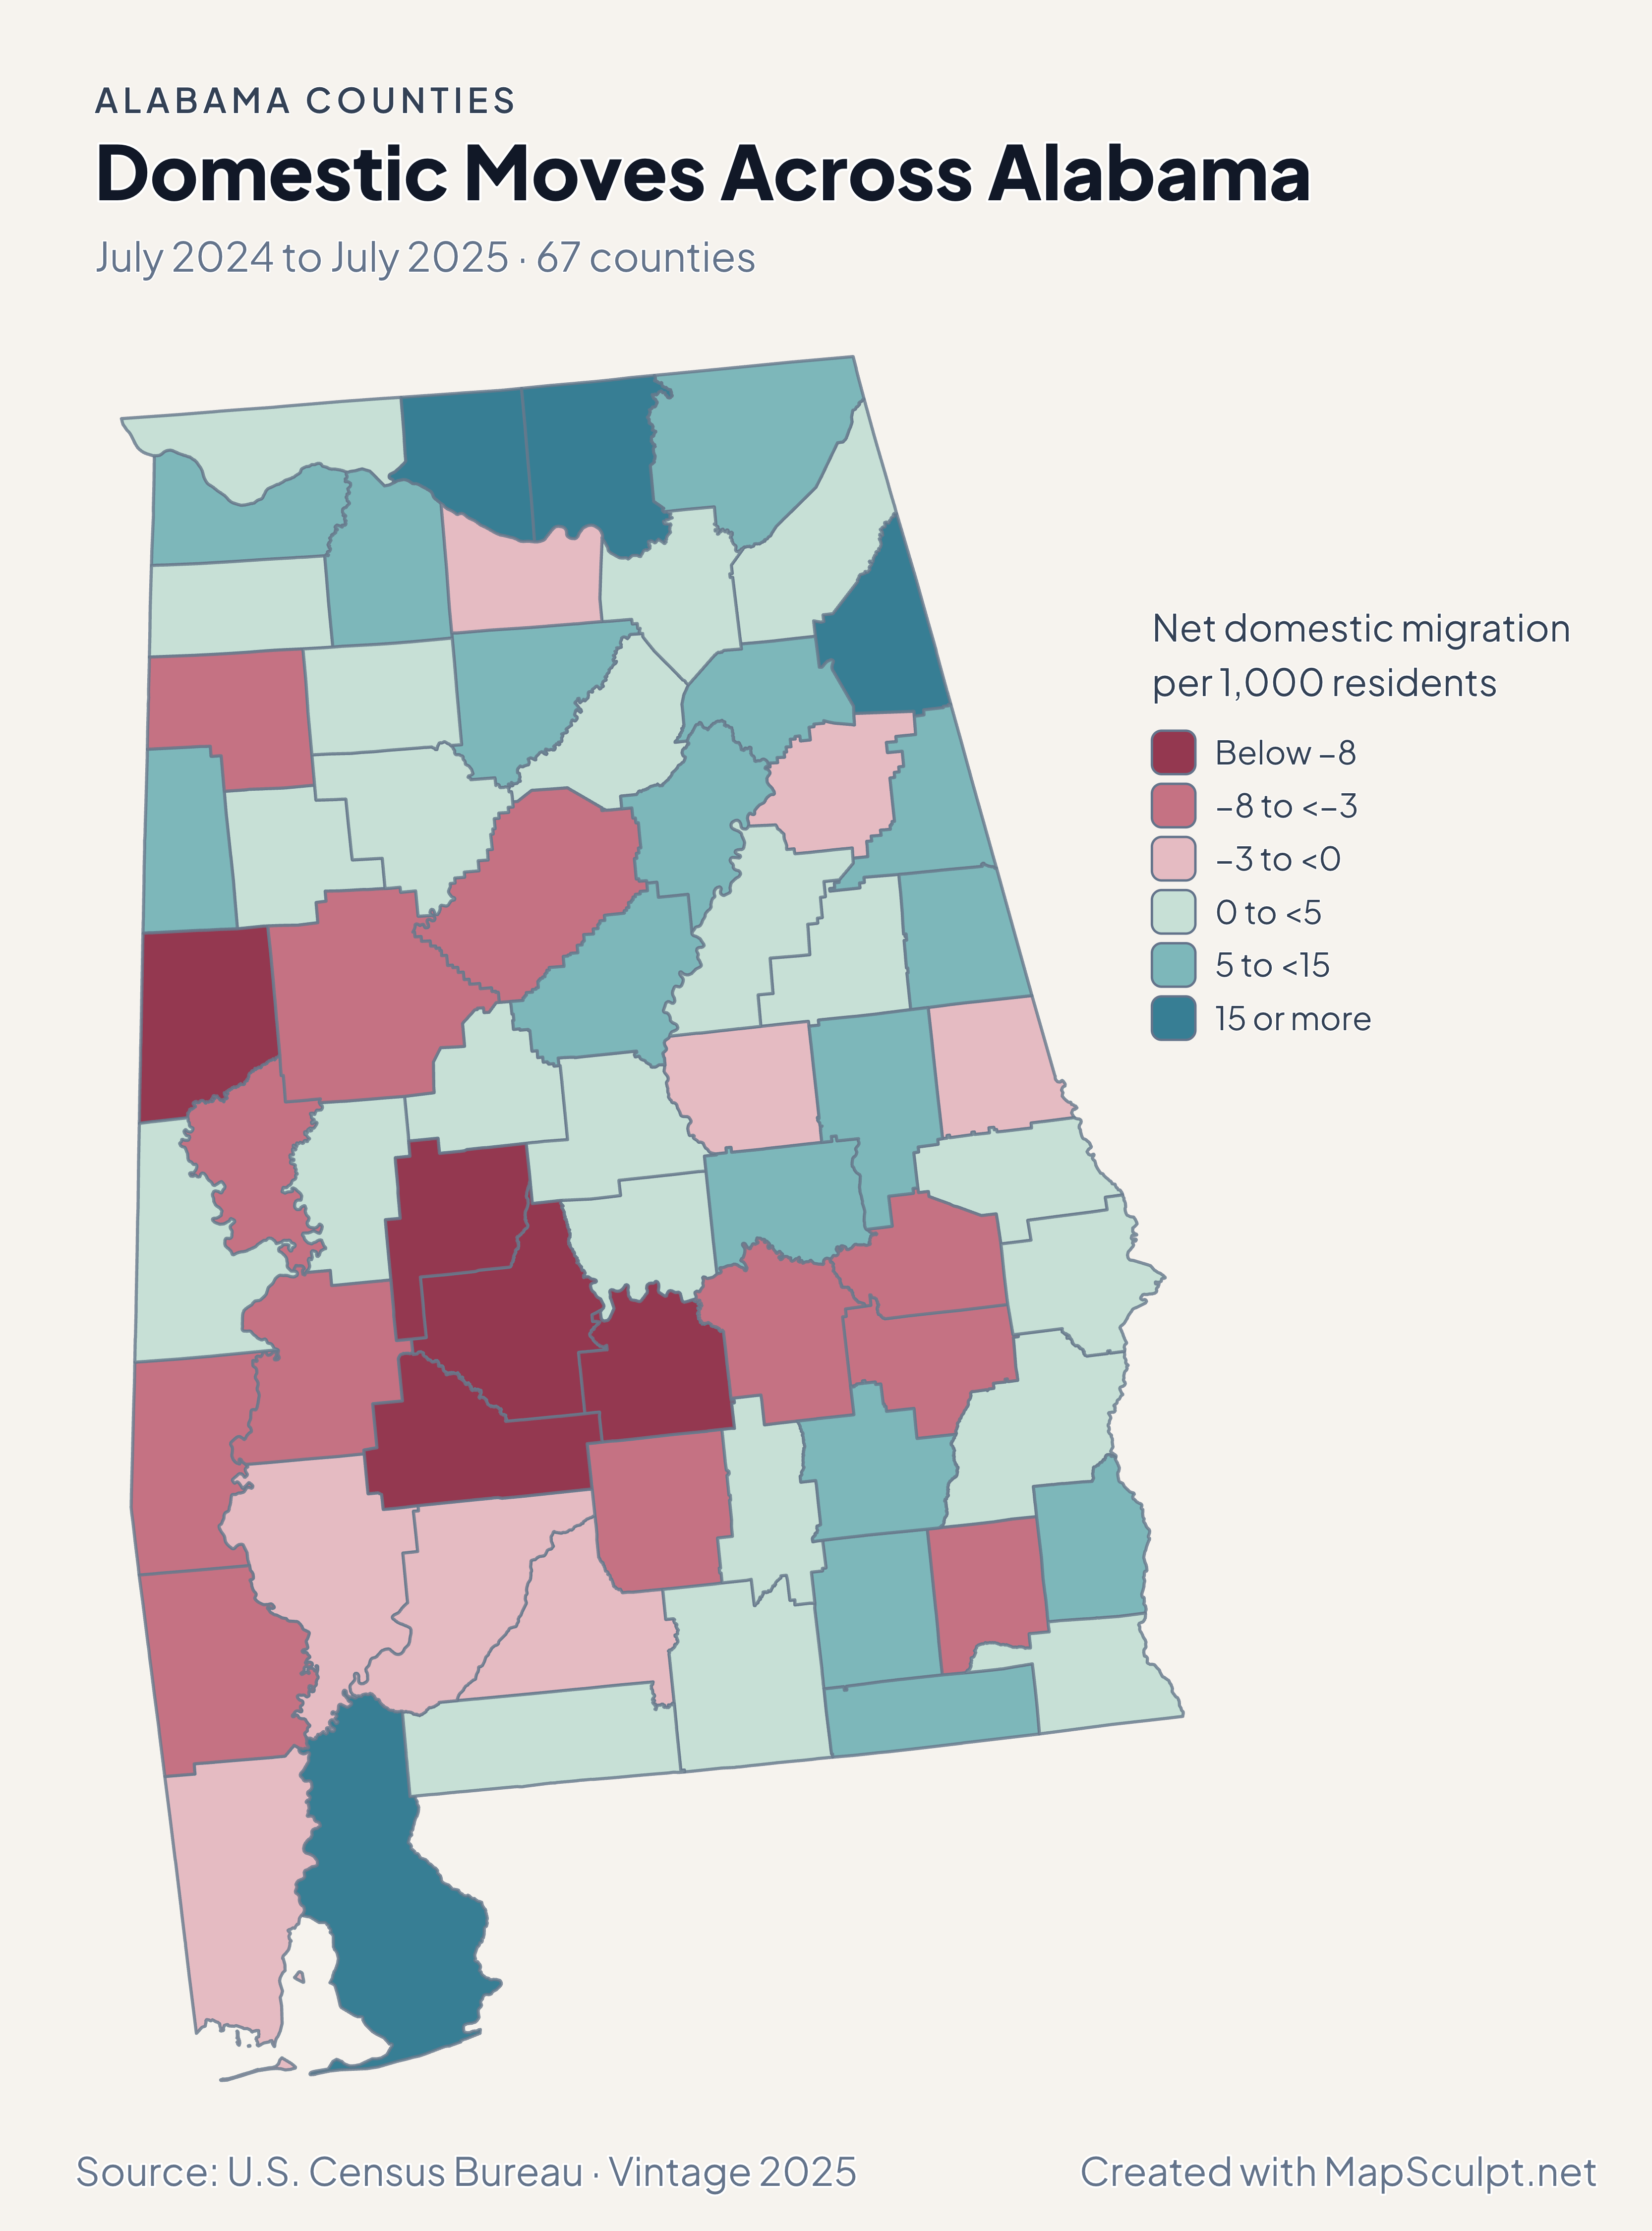
Alabama domestic migration with high-gain classes in Limestone and Baldwin and a loss class in Mobile.

July 2024 to July 2025 · 67 counties

Domestic moves also differ across Mobile Bay.

Baldwin recorded 22.71 net domestic movers per 1,000 residents and Mobile recorded −2.42. In northern Alabama, Limestone recorded a gain of 30.02 per 1,000.

Net domestic migration per 1,000 residents

  • Below −8
  • −8 to <−3
  • −3 to <0
  • 0 to <5
  • 5 to <15
  • 15 or more

U.S. Census Bureau · Vintage 2025

Download complete PNG

Limestone led at 3.26%, Madison grew 2.47% and Baldwin grew 2.33%. Across Mobile Bay, Mobile declined about 0.13%. The rates compare each county with its own starting population. See the Census estimates ↗

MAKE IT YOURS

From county data to a finished map.

  1. Choose the editor

    Open the Alabama editor to compare the Tennessee Valley and Gulf Coast using the same county boundaries.

  2. Match the county rows

    Format the GEOID column as text before saving your CSV. Baldwin’s 01003 and Mobile’s 01097 both need the leading zero.

  3. Write the legend

    For relative growth, use one percentage scale across the state and keep both sides of zero visible in the legend.

  4. Export the map

    Check that Mobile and Baldwin are distinguishable around the bay in the PNG preview.

TRY CSV IMPORT

Practice a six-county join in Alabama.

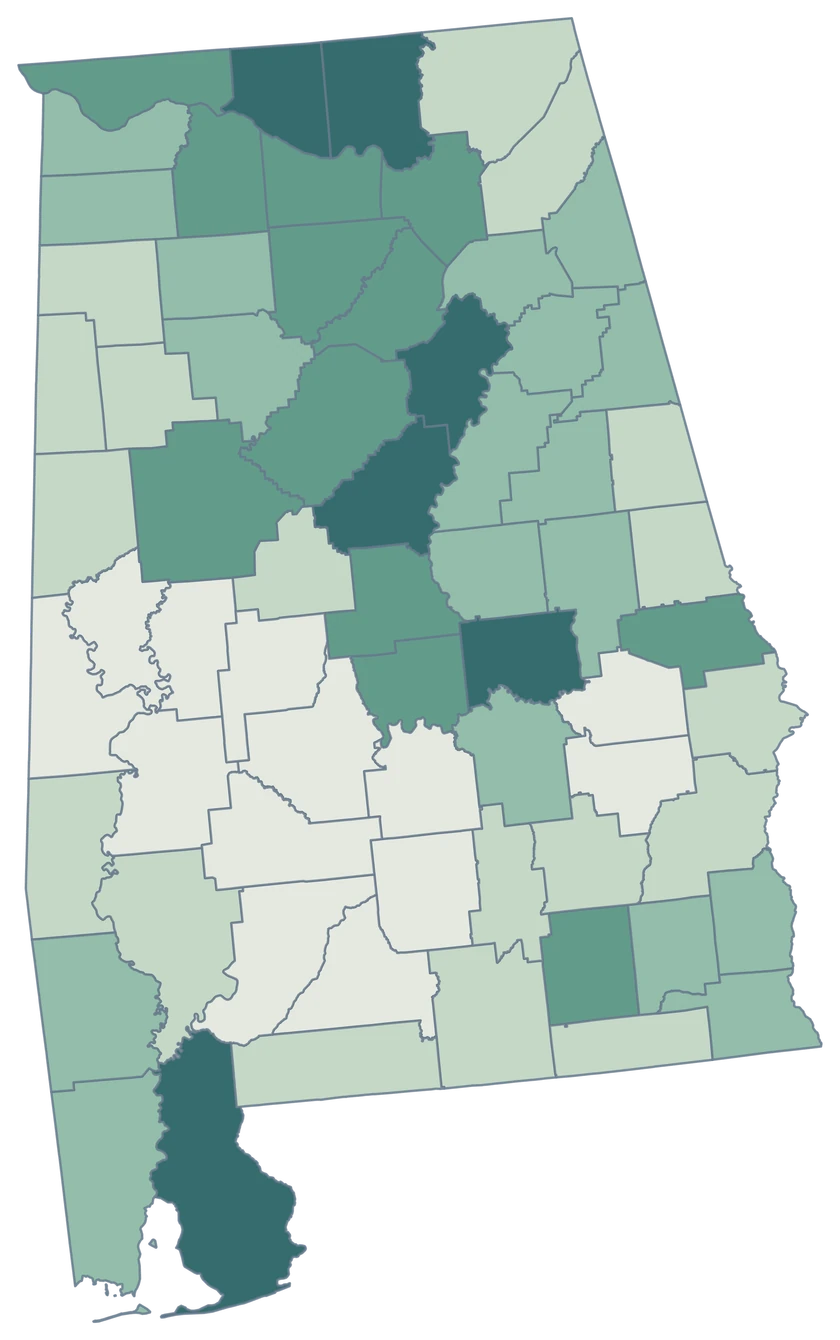
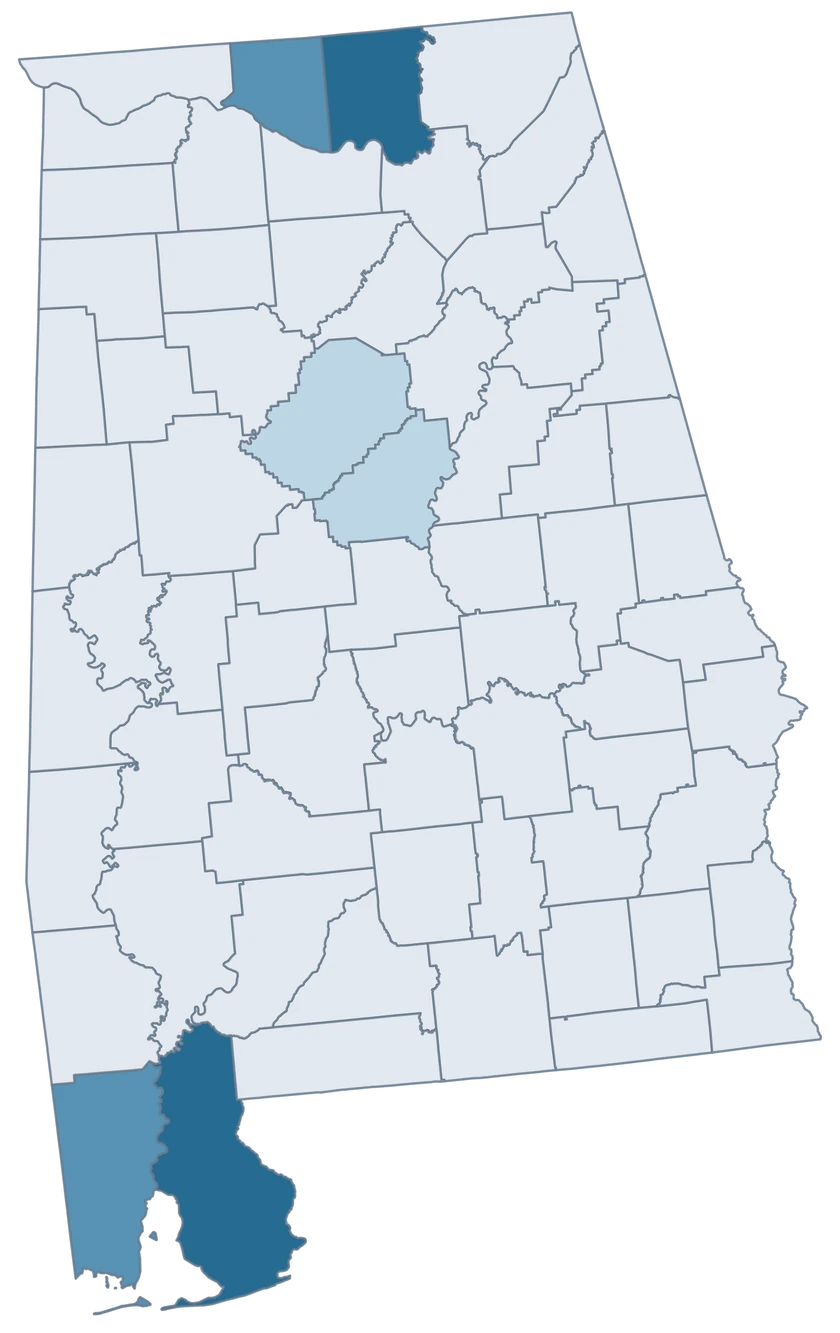
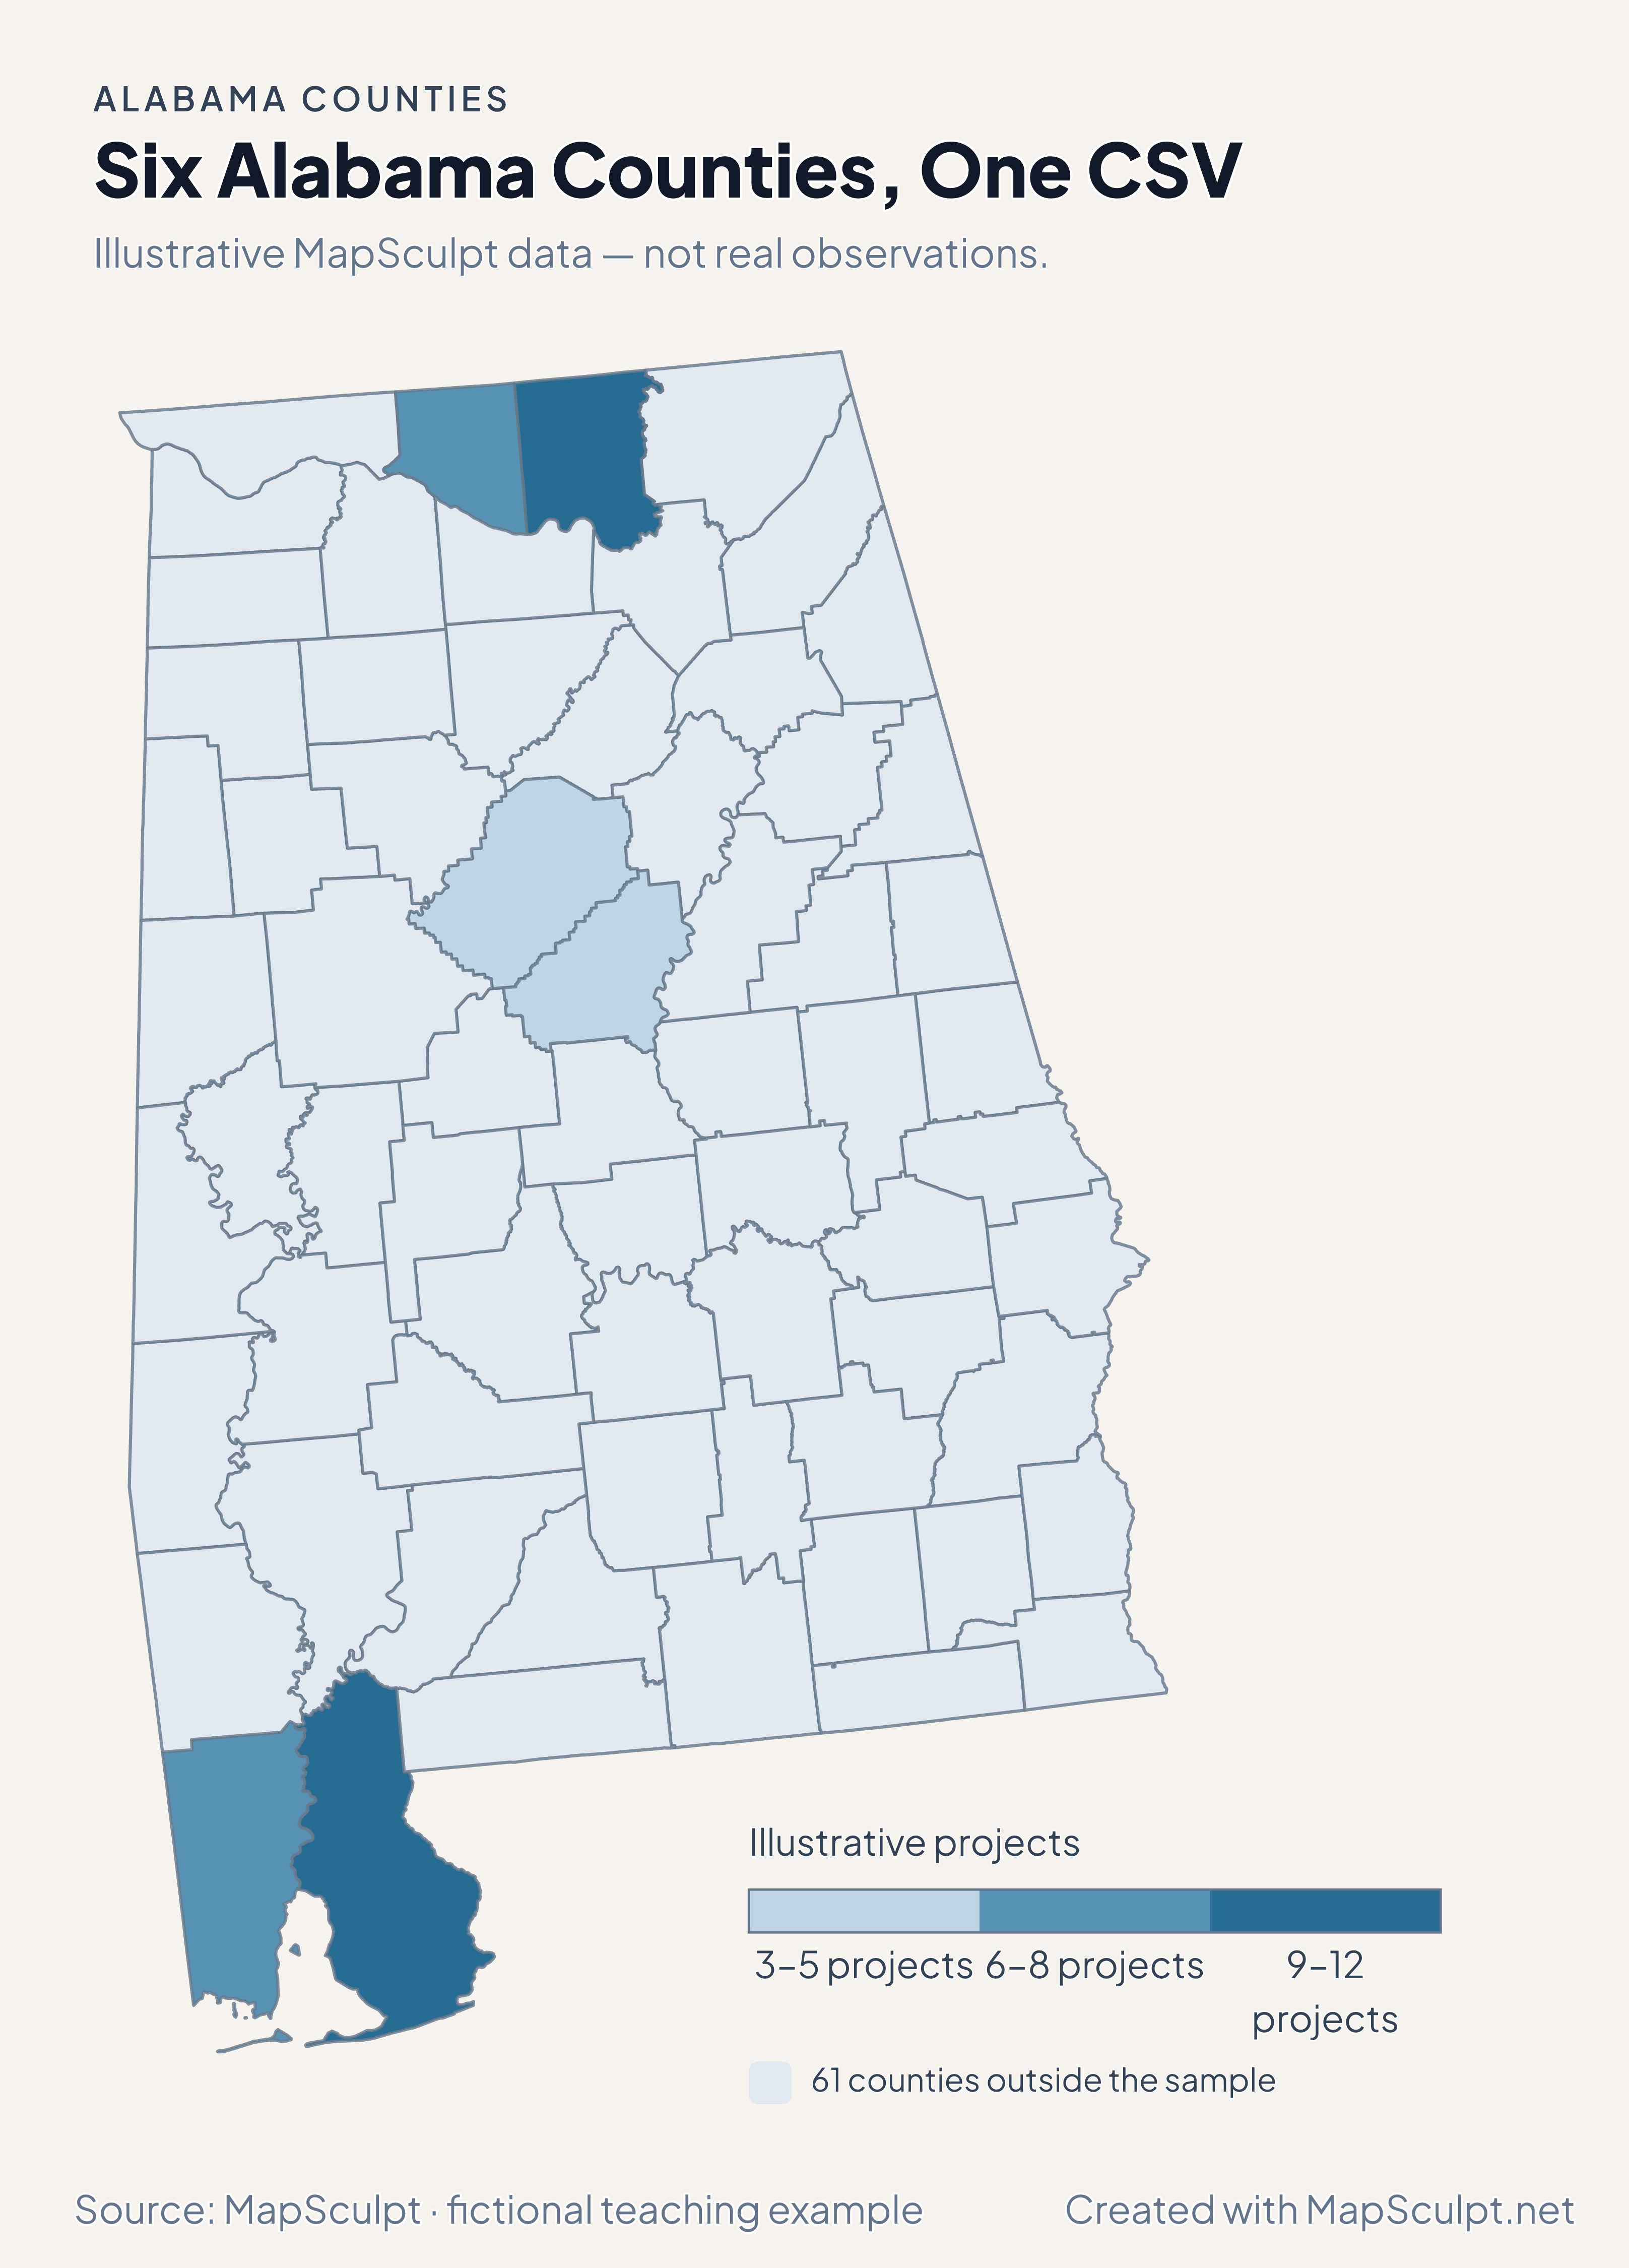
Import the fictional project counts, choose IllustrativeProjects, and set numeric boundaries of 3, 6, 9 and 12. The other 61 counties remain neutral.

Illustrative MapSculpt data — not real observations.
CountyGEOIDProjects
Baldwin County0100312
Mobile County010976
Madison County010899
Limestone County010838
Jefferson County010735
Shelby County011173

Keep GEOIDs as text. The sample matches Baldwin County with 01003. Check the directory for official names and codes before importing your data.

Download illustrative CSV ↓

Six Alabama Counties, One CSV

Illustrative MapSculpt data — not real observations.

Fictional project counts across six Alabama counties. The other 61 counties are neutral.

Illustrative projects

  • 3–5 projects
  • 6–8 projects
  • 9–12 projects
  • 61 counties outside the sample
Download complete PNG

CSV → Match 6 counties → Style → Export PNG Create a Alabama map

COUNTY REFERENCE

Find all 67 Alabama county GEOIDs.

Official county names and five-digit Census GEOIDs. Search by name or code.

  1. Autauga CountyGEOID 01001
  2. Baldwin CountyGEOID 01003
  3. Barbour CountyGEOID 01005
  4. Bibb CountyGEOID 01007
  5. Blount CountyGEOID 01009
  6. Bullock CountyGEOID 01011
  7. Butler CountyGEOID 01013
  8. Calhoun CountyGEOID 01015
  9. Chambers CountyGEOID 01017
  10. Cherokee CountyGEOID 01019
  11. Chilton CountyGEOID 01021
  12. Choctaw CountyGEOID 01023
  13. Clarke CountyGEOID 01025
  14. Clay CountyGEOID 01027
  15. Cleburne CountyGEOID 01029
  16. Coffee CountyGEOID 01031
  17. Colbert CountyGEOID 01033
  18. Conecuh CountyGEOID 01035
  19. Coosa CountyGEOID 01037
  20. Covington CountyGEOID 01039
  21. Crenshaw CountyGEOID 01041
  22. Cullman CountyGEOID 01043
  23. Dale CountyGEOID 01045
  24. Dallas CountyGEOID 01047
  25. DeKalb CountyGEOID 01049
  26. Elmore CountyGEOID 01051
  27. Escambia CountyGEOID 01053
  28. Etowah CountyGEOID 01055
  29. Fayette CountyGEOID 01057
  30. Franklin CountyGEOID 01059
  31. Geneva CountyGEOID 01061
  32. Greene CountyGEOID 01063
  33. Hale CountyGEOID 01065
  34. Henry CountyGEOID 01067
  35. Houston CountyGEOID 01069
  36. Jackson CountyGEOID 01071
  37. Jefferson CountyGEOID 01073
  38. Lamar CountyGEOID 01075
  39. Lauderdale CountyGEOID 01077
  40. Lawrence CountyGEOID 01079
  41. Lee CountyGEOID 01081
  42. Limestone CountyGEOID 01083
  43. Lowndes CountyGEOID 01085
  44. Macon CountyGEOID 01087
  45. Madison CountyGEOID 01089
  46. Marengo CountyGEOID 01091
  47. Marion CountyGEOID 01093
  48. Marshall CountyGEOID 01095
  49. Mobile CountyGEOID 01097
  50. Monroe CountyGEOID 01099
  51. Montgomery CountyGEOID 01101
  52. Morgan CountyGEOID 01103
  53. Perry CountyGEOID 01105
  54. Pickens CountyGEOID 01107
  55. Pike CountyGEOID 01109
  56. Randolph CountyGEOID 01111
  57. Russell CountyGEOID 01113
  58. Shelby CountyGEOID 01117
  59. St. Clair CountyGEOID 01115
  60. Sumter CountyGEOID 01119
  61. Talladega CountyGEOID 01121
  62. Tallapoosa CountyGEOID 01123
  63. Tuscaloosa CountyGEOID 01125
  64. Walker CountyGEOID 01127
  65. Washington CountyGEOID 01129
  66. Wilcox CountyGEOID 01131
  67. Winston CountyGEOID 01133

U.S. Census Bureau · 2025 Cartographic Boundary Files

COMMON QUESTIONS

Alabama county map questions.

How do I preserve an Alabama GEOID in a spreadsheet?

Set the GEOID column to text so codes keep the leading zero. For example, use 01097 for Mobile County.

Are Mobile and Baldwin separate selections?

Yes. Mobile uses 01097 and Baldwin uses 01003. Coastal pieces shown in the source remain part of their respective county.

Can I color Huntsville as one feature?

The map selects whole counties. Use the appropriate county GEOIDs for county-wide Huntsville-area observations, and city geography for city-only data.

How do I compare counties in the Tennessee Valley?

Pick the counties that match your definition of the region, then join the same indicator for every county. Use the national editor if your comparison crosses into Tennessee.

Why does Baldwin differ from Mobile in the growth and migration maps?

The 2024–2025 estimates show Baldwin gaining on both measures and Mobile declining on both. One legend measures percentage population change and the other net domestic moves per 1,000.

Can I use this map as a flood or shoreline map?

The 1:500,000 cartographic boundaries are suited to county comparisons. Use a separate detailed hazard or shoreline source for those purposes.

YOUR NEXT MAP STARTS HERE

Put an Alabama county story on the map.

Join official county identifiers to your values, choose a readable legend, and download your finished Alabama map.

Create a Alabama map