MapSculpt

USA / 3,144 COUNTIES / MAP MAKER

US Counties Map Maker

Create maps of 3,144 US counties. Import CSV data, customize your legend and export polished PNGs.

Create a US county map

Free browser-based editor · CSV import · PNG export

3,144 COUNTIES / ILLUSTRATIVE VALUES

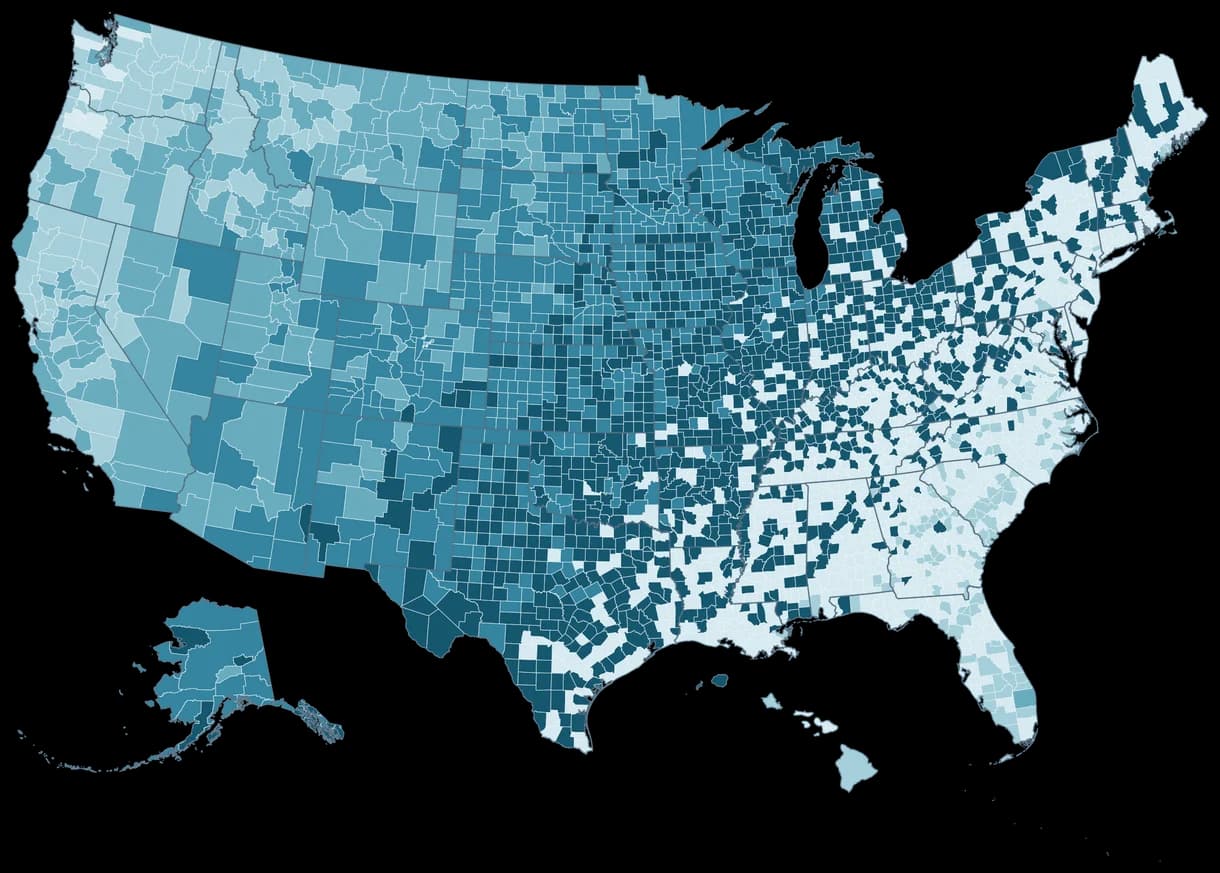
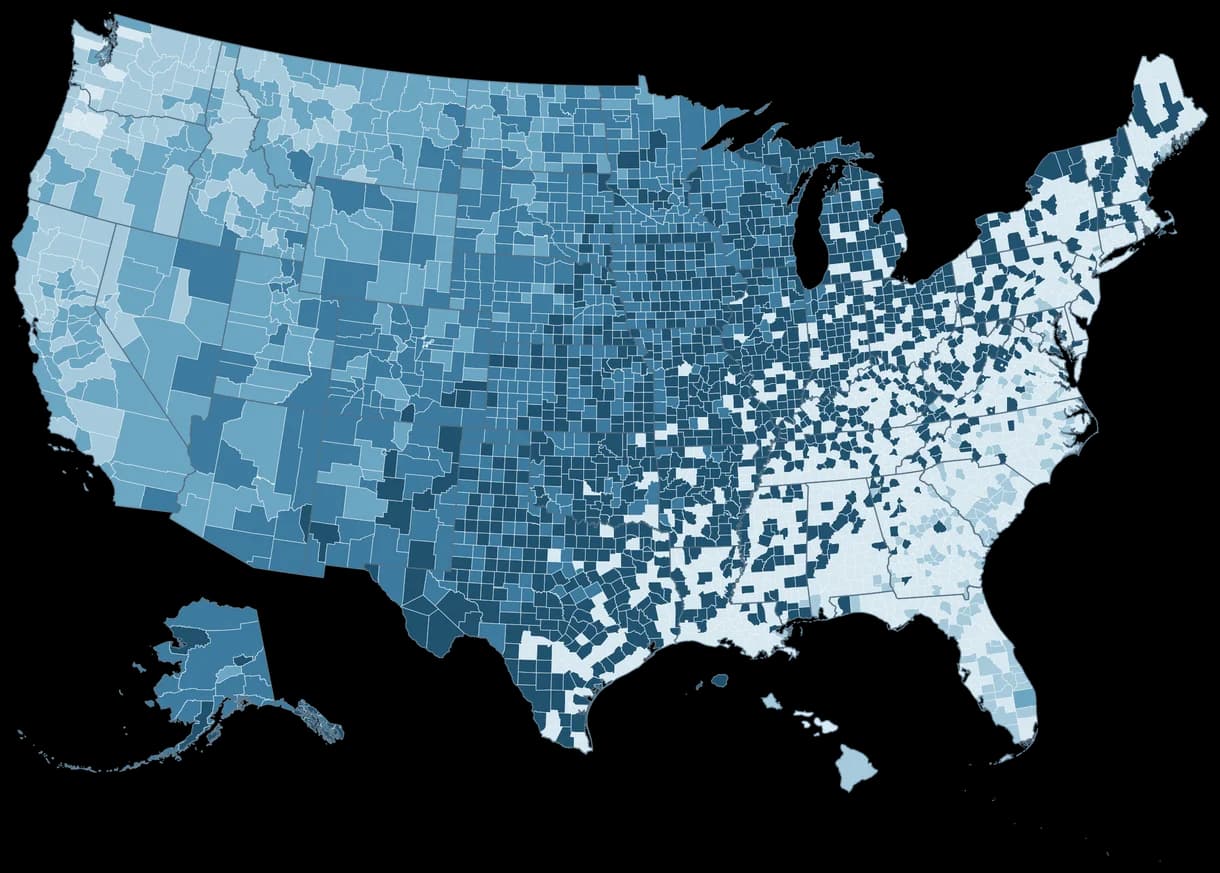
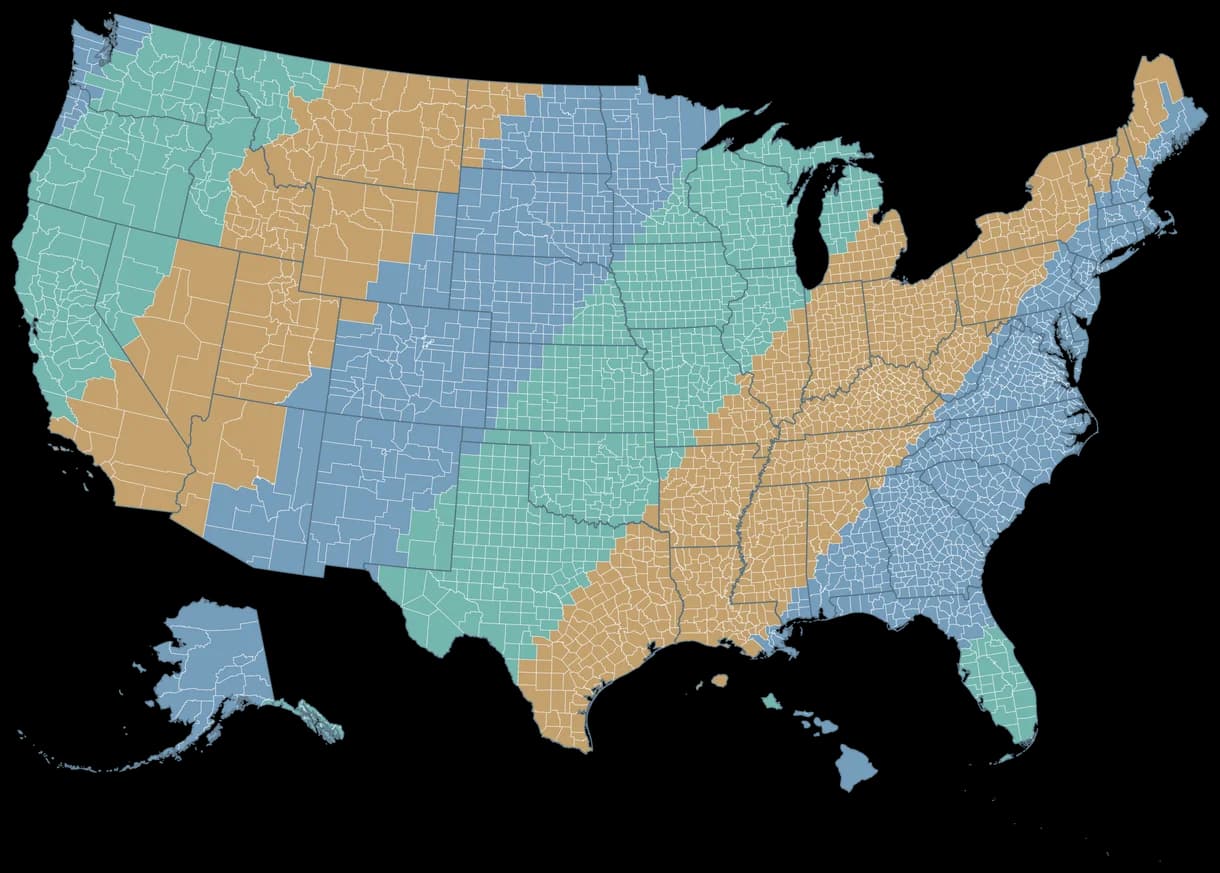
Map of 3,144 US counties and county equivalents using an illustrative five-color sequential scale, with Alaska and Hawaii insets.
  • Very low
  • Low
  • Medium
  • High
  • Very high
Census 2025 boundaries · Alaska / Hawaii insets

CSV DATA IMPORT / AUTOMATIC MATCHING

From spreadsheet to county map.

Upload county-level values using Census GEOIDs or FIPS codes. Match geographic IDs, review any issues and turn thousands of rows into a clear map.

county-data.csv · 5 sample rows
GEOIDValue
0603742
1703165
3606183
0401351
4820174

Illustrative values. GEOIDs stay as text to preserve leading zeroes.

CSV → MATCH COUNTIES → COLOR MAP

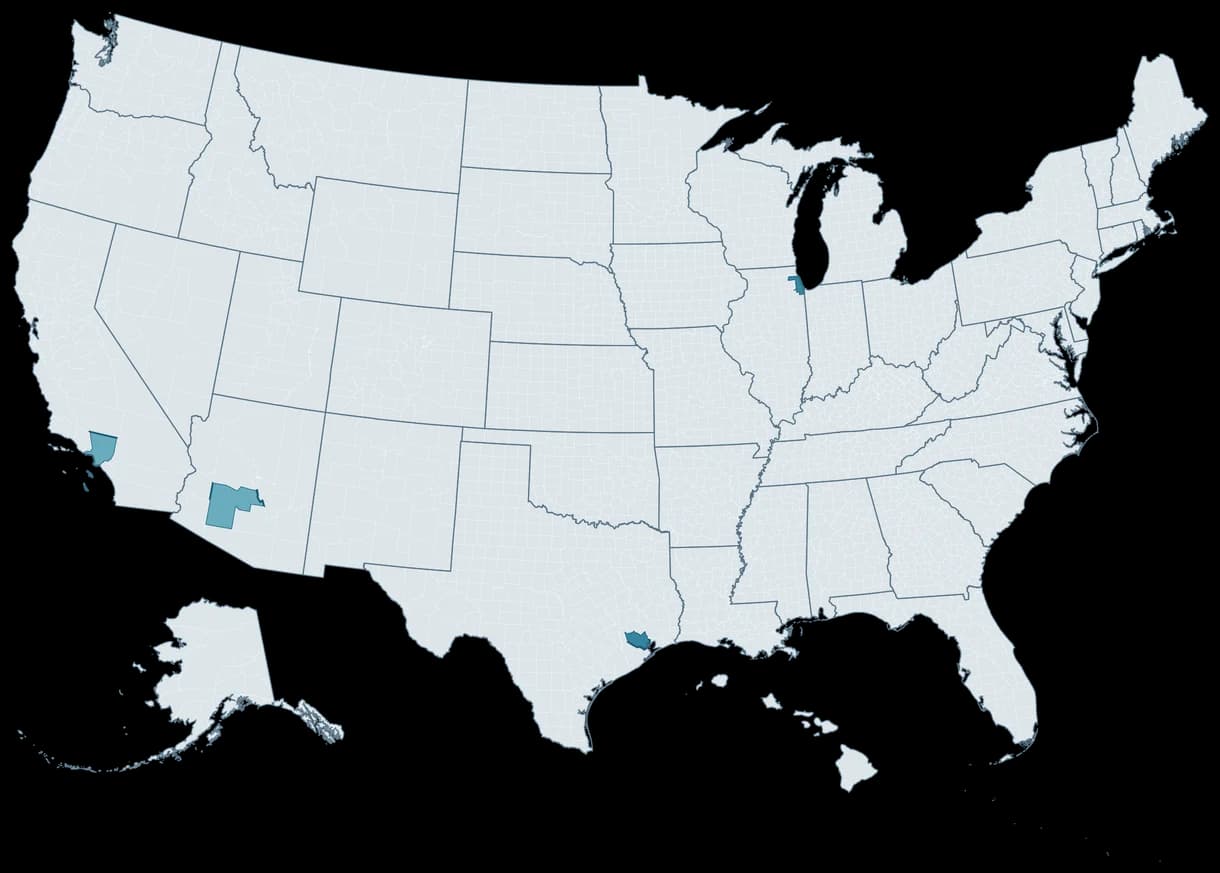
CSV-to-map example matching five county GEOIDs: 06037 at 42, 17031 at 65, 36061 at 83, 04013 at 51 and 48201 at 74; all other counties have no data.
  • 0–20
  • 21–40
  • 41–60
  • 61–80
  • 81–100
  • No data
5 GEOIDs matched · All other counties: no data

COUNTY ELECTIONS / RESPONSIBLE MAPPING

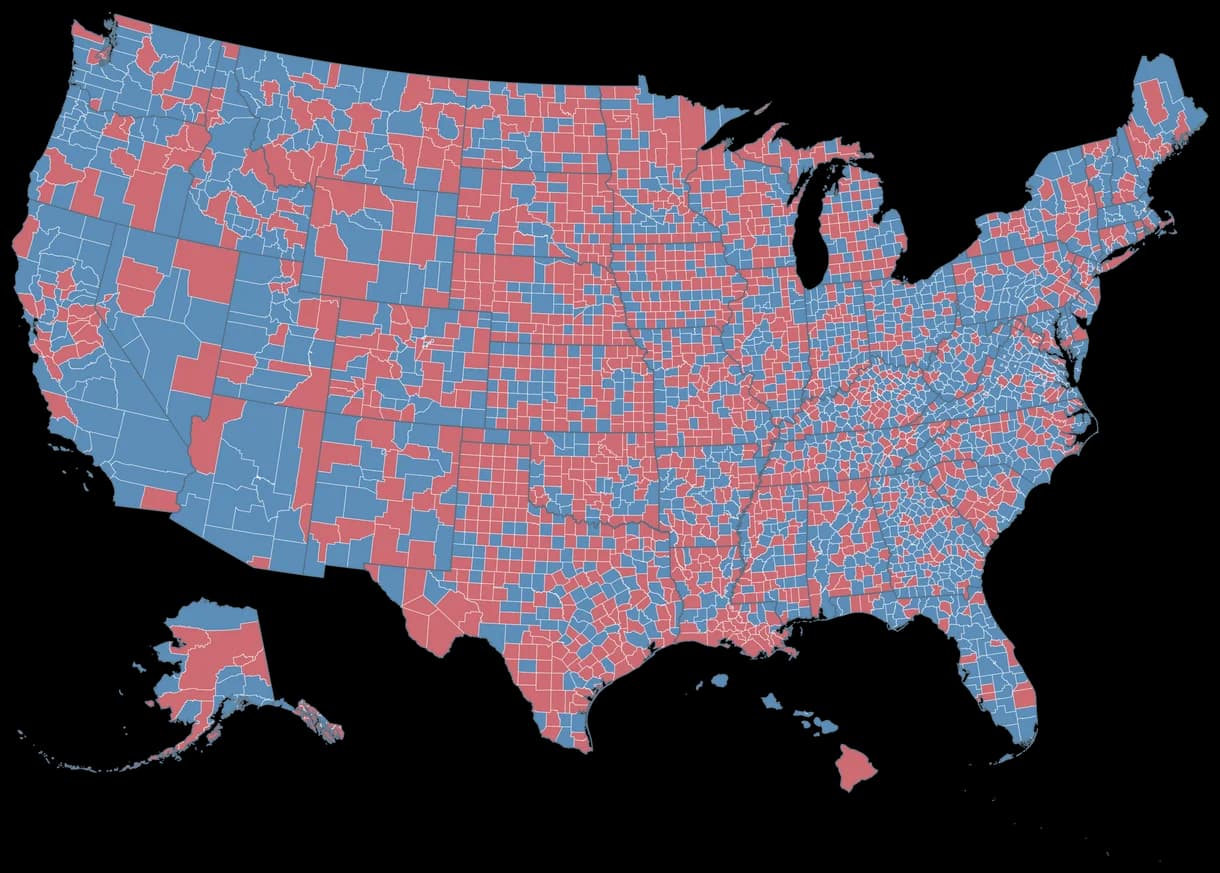
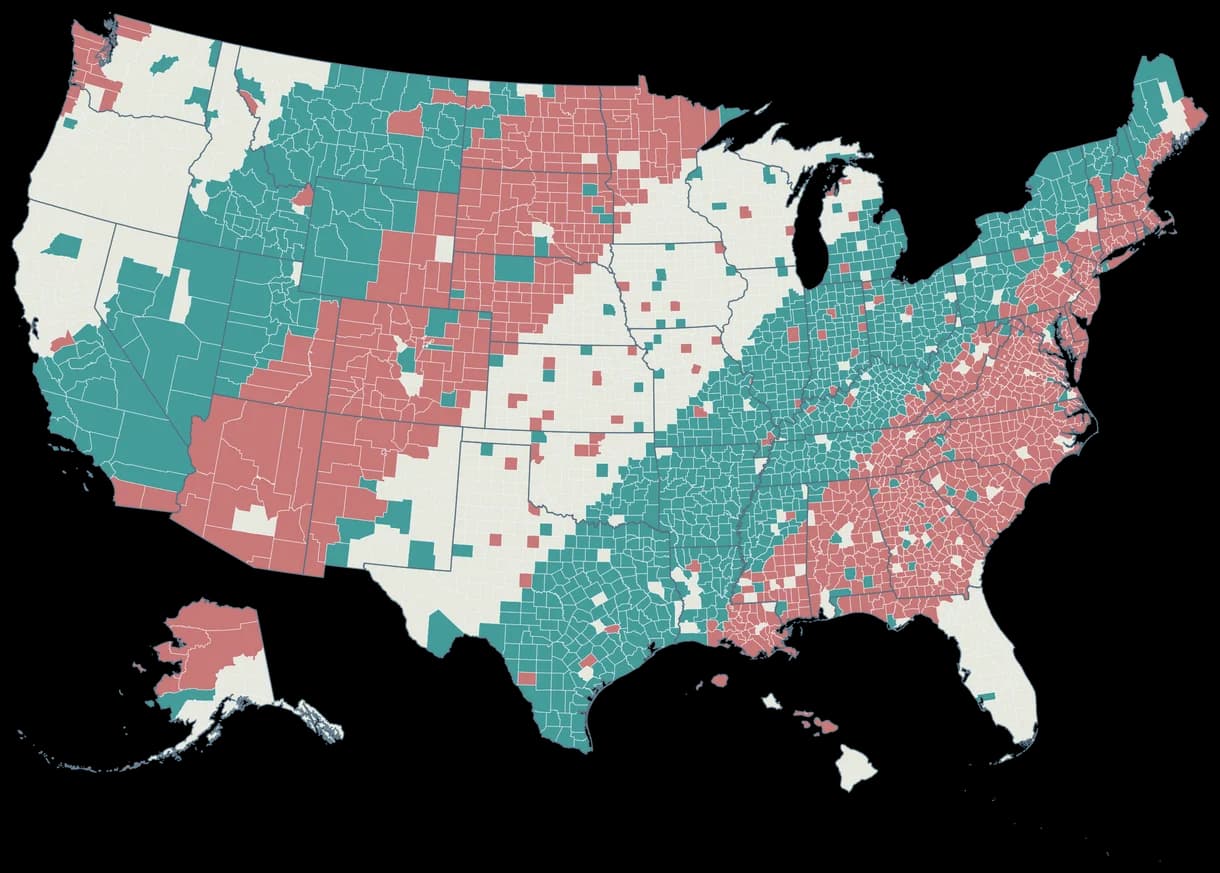
US county election example with illustrative Party A and Party B categories, including Alaska and Hawaii insets; not actual election results.
  • Party A
  • Party B

Illustrative categories · not actual election results

COUNTY DATA / RESPONSIBLE MAPPING

From county data to a clear geographic story.

Import a county dataset, review geographic matches and apply colors to thousands of regions without coloring each county individually.

The map uses 2025 Census county boundaries and stable five-digit GEOIDs. Preserve leading zeroes in CSV identifiers.

The examples shown use illustrative values. Import verified results and cite your data source when publishing statistical maps.

Create a county data map

GET STARTED

How to make a US county map

Choose the counties template, import CSV values or color counties manually, customize your design and export.

  1. 01

    Choose US Counties

    Start with 3,144 counties and state boundaries.

  2. 02

    Import data or color

    Match CSV GEOIDs or select counties manually.

  3. 03

    Customize the design

    Add palettes, a title, categories and a legend.

  4. 04

    Export your map

    Download a crisp PNG ready for a report, article or slide.

BUILT FOR YOUR OWN MAP

Everything you need to make a county map.

County-level editing

Color individual counties with custom palettes.

CSV data import

Import thousands of county records in one workflow.

FIPS and GEOID matching

Match standard Census geographic identifiers.

Numerical choropleths

Color county values with numerical ranges.

Categories and legends

Design clear groups, labels and legends.

High-resolution PNG

Export a polished image for digital or print use.

GEOGRAPHIC COVERAGE

Every county. One canvas.

All 3,144 counties and county equivalents across 50 states and Washington, D.C., with dedicated Alaska and Hawaii insets.

WHAT IS INCLUDED

3,144 county equivalents · 51 state units

Includes Louisiana parishes, Alaska boroughs/census areas, Virginia independent cities and Connecticut’s nine planning regions.

The 91 additional territory equivalents are excluded. Puerto Rico and other US territories are not selectable in this map.

COMMON QUESTIONS

US counties map maker FAQ

How do I create a map of US counties?

Choose the US Counties template, color individual counties or upload a CSV, then customize the legend and export your map.

Can I upload a CSV to color counties automatically?

Yes. Import county-level data, review geographic matches and apply numerical or categorical values to the map.

How do I use county FIPS codes in a CSV?

Use five-digit Census GEOIDs such as 06037 or 09110. Keep codes as text to preserve leading zeroes. You can also use separate STATEFP and COUNTYFP columns.

Can I create a county-level election map?

Yes. Import verified election results by county, choose categories or numerical colors, and add a legend and data source. The examples on this page are illustrative.

How many counties are included in the map?

The map includes 3,144 counties and county equivalents across all 50 states and Washington, D.C., using 2025 Census boundaries.

Does the map include Alaska, Hawaii and D.C.?

Yes. Alaska and Hawaii appear as insets, and D.C. is selectable. Puerto Rico and other US territories are not part of this template.

Can I export my county map as a PNG?

Yes. Download a high-resolution PNG with your chosen colors, title, legend and source.

Can I create maps for r/MapPorn, r/dataisbeautiful, r/europe and other Reddit communities?

Yes. MapSculpt lets you create custom maps for data visualizations, geographic comparisons and original map posts. You can color countries or regions using, for example, Eurostat data or other official sources, add a clear title, legend and source, and download your map as a high-resolution PNG. For communities such as r/MapPorn, r/dataisbeautiful, r/europe and other subreddits, use accurate data, explain your methodology where needed, and check each community’s posting rules before submitting.

READY TO BUILD YOUR MAP?

Your data has a geographic story.

Import county data, customize the design and share a clear geographic story.

Create a US county map