Skip to content
MapSculpt

GEOGRAPHIC MAP MAKER / WASHINGTON

Washington
State Counties Map Maker

Compare county growth around Puget Sound and east of the Cascades, then see how domestic migration changes the picture. Use all 39 Washington State counties for your own map.

Free online editor · No sign-up required

39counties
individually editable

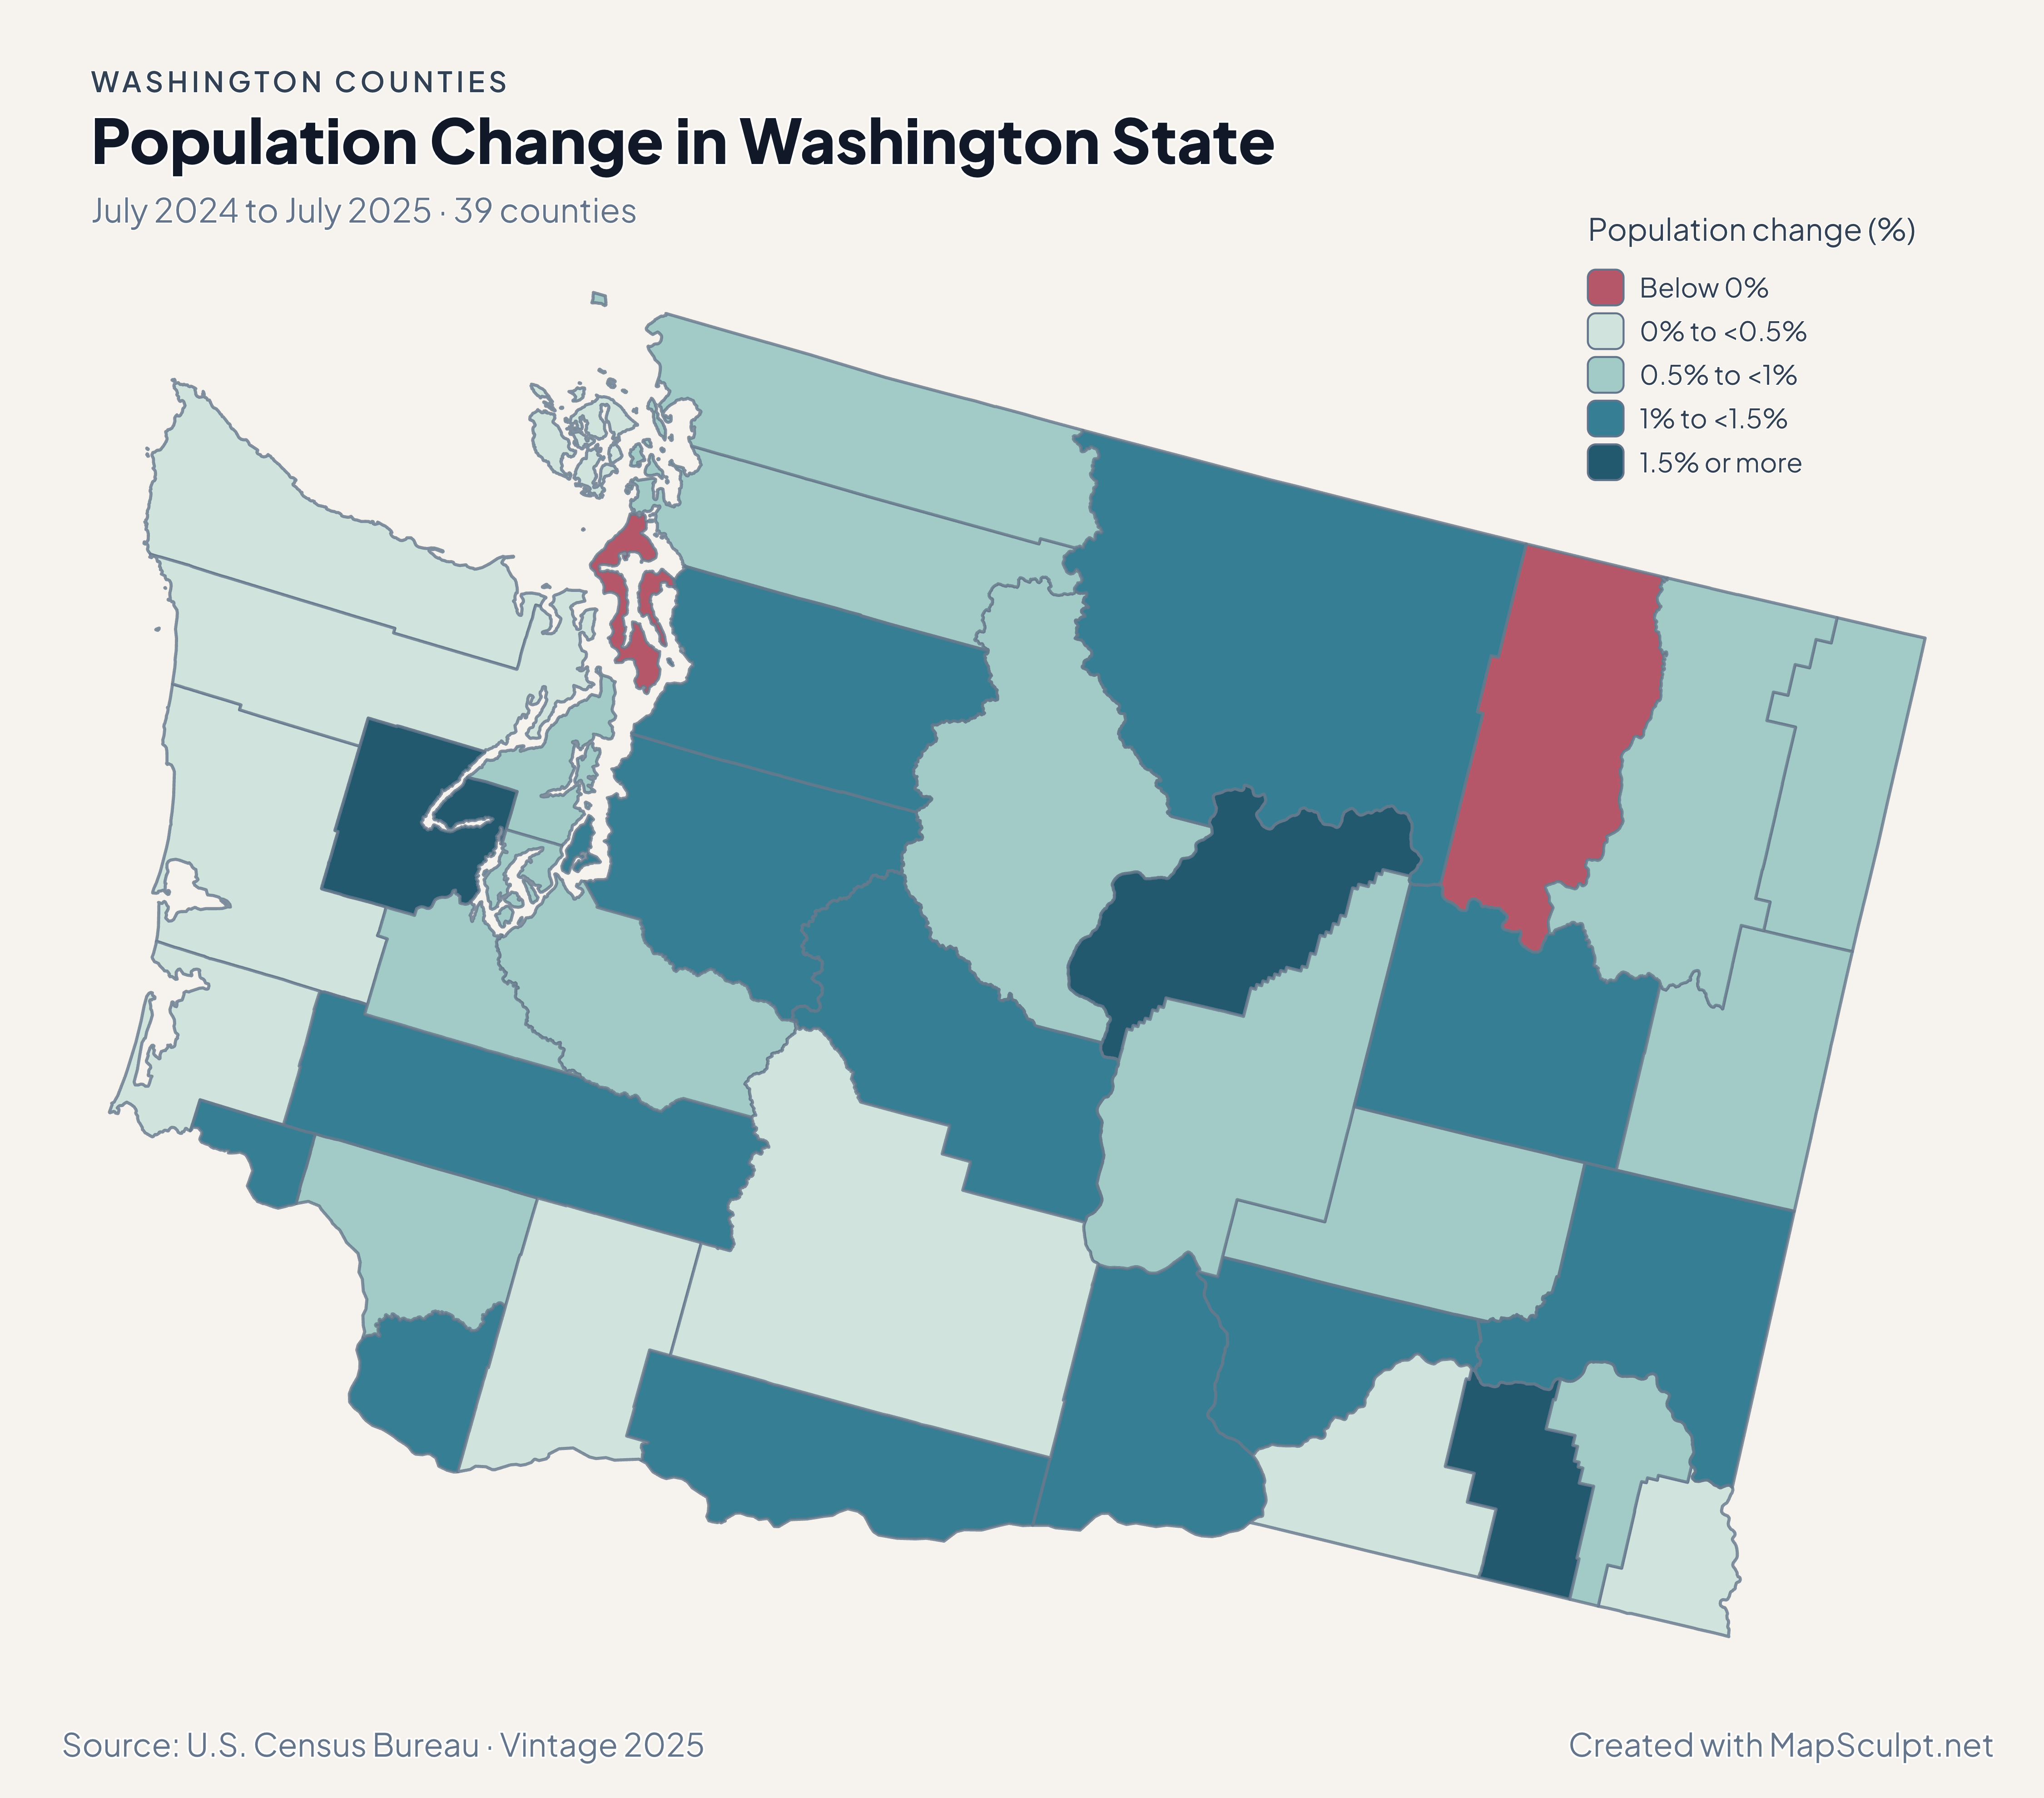
Population Change in Washington State

July 2024 to July 2025 · 39 counties

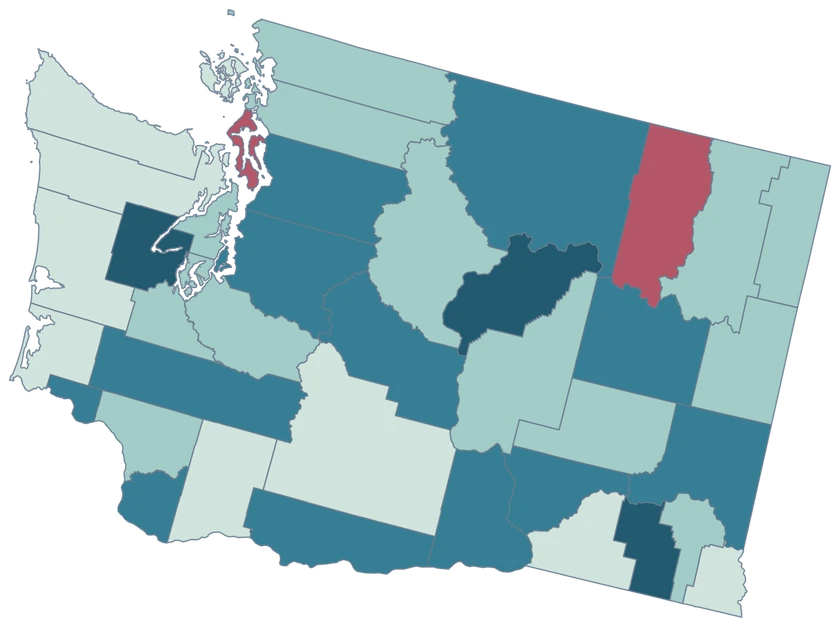
Washington State population change map with Columbia in the highest band and Island County in the decline band.

Population change (%)

  • Below 0%
  • 0% to <0.5%
  • 0.5% to <1%
  • 1% to <1.5%
  • 1.5% or more
U.S. Census Bureau · Vintage 2025Download complete PNG Percentage change compares each area with its July 2024 population.

KNOW YOUR GEOGRAPHY

Puget Sound, the Pacific coast and inland Washington.

Washington State’s county geography includes the Olympic Peninsula, the Puget Sound shoreline and the San Juan Islands, alongside the counties east of the Cascades.

The 2025 cartographic source generalizes fine shoreline detail. Separate pieces of San Juan County share a single Census identity, and the county view supports statewide comparisons.

Browse all county GEOIDs ↗

2025 Census boundaries

OFFICIAL DATA

From Puget Sound to eastern Washington.

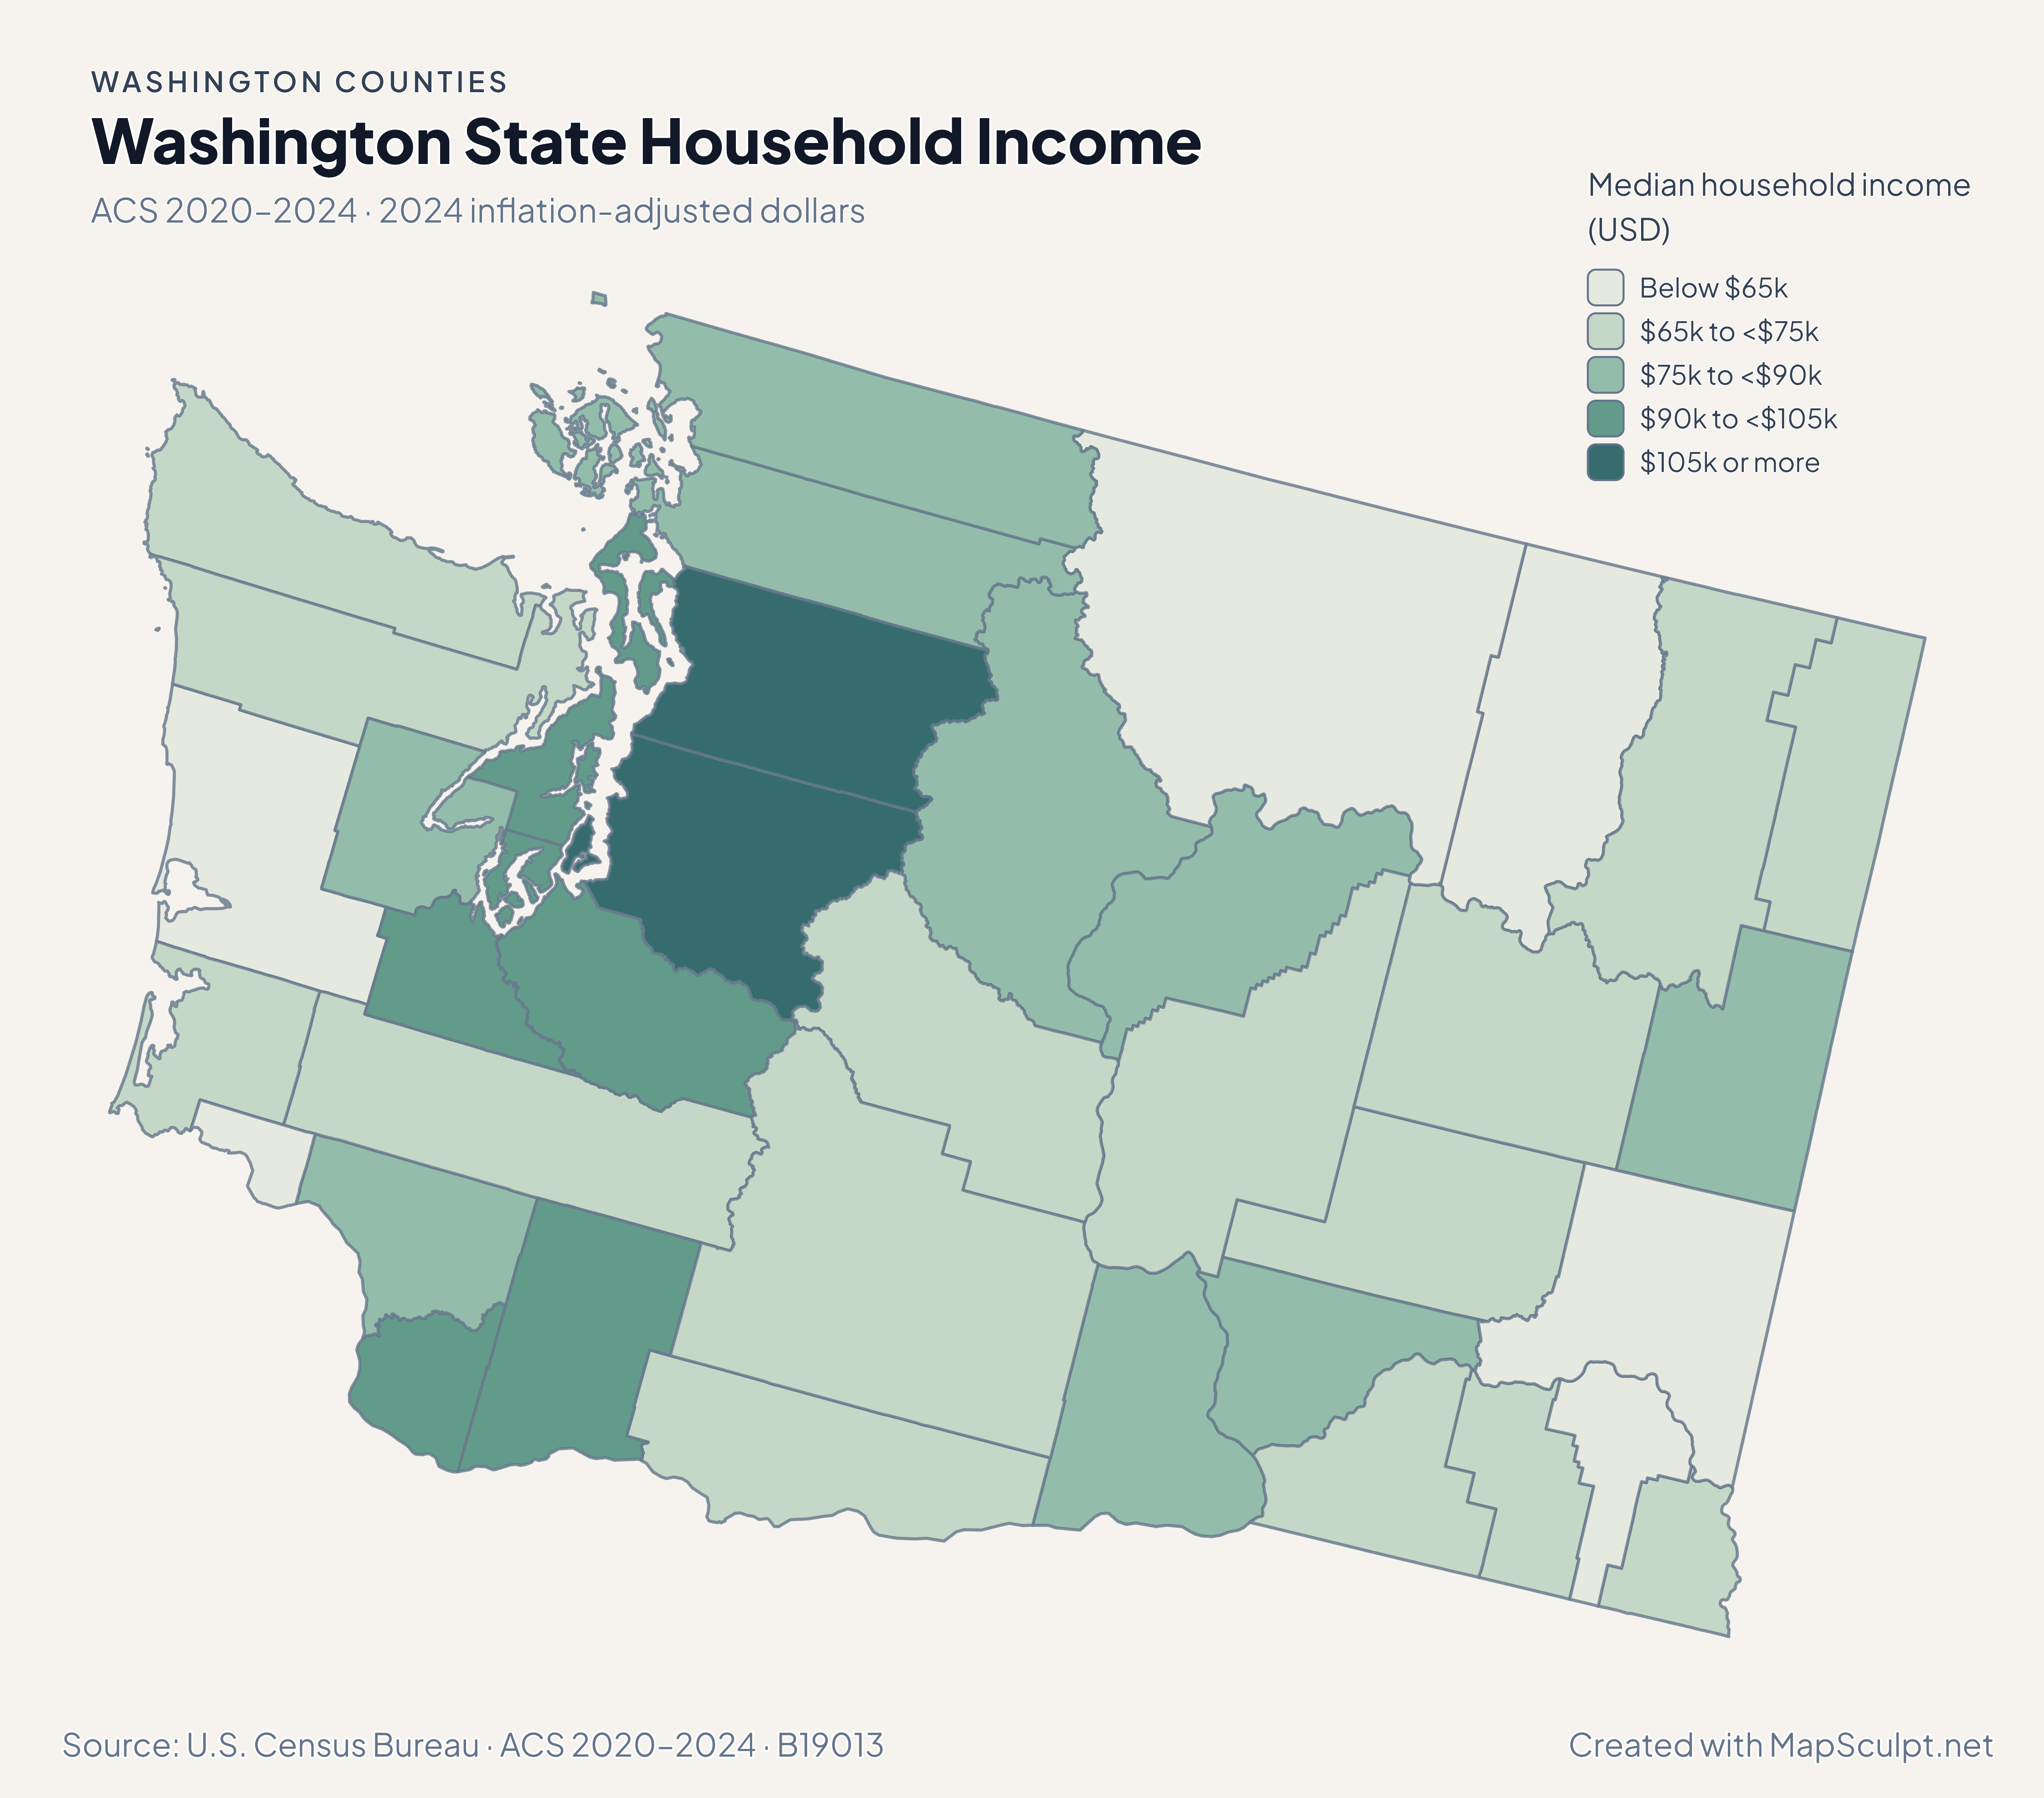
Compare July 2024–July 2025 population estimates with five-year ACS survey estimates for 2020–2024. Each map identifies its own period and units.

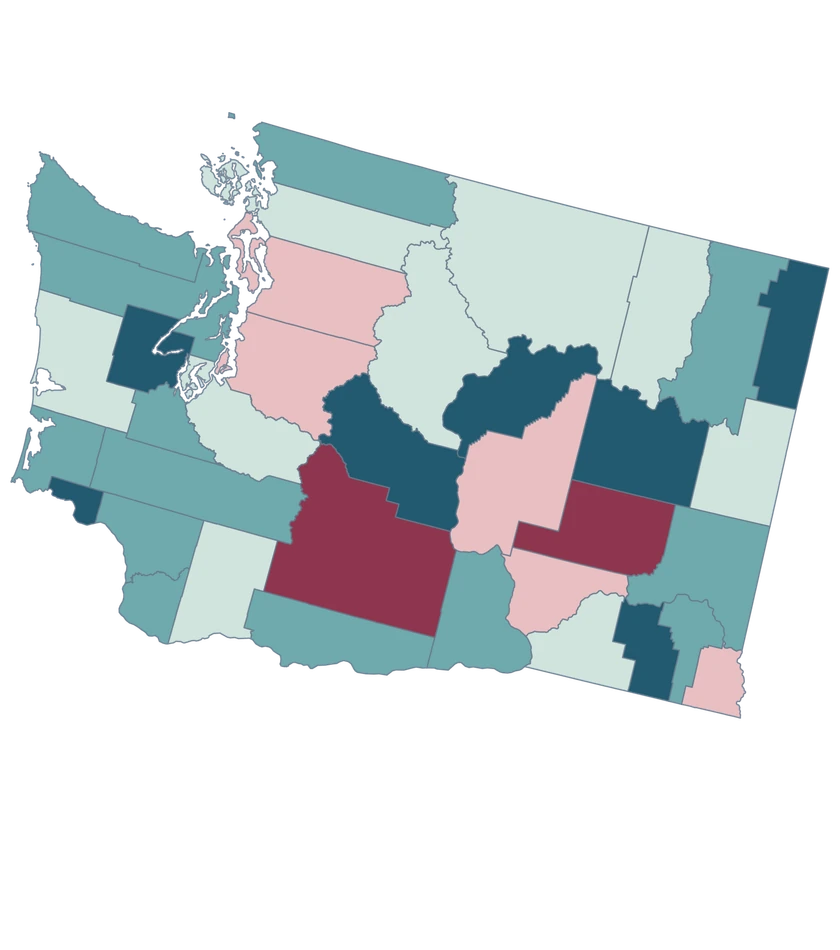
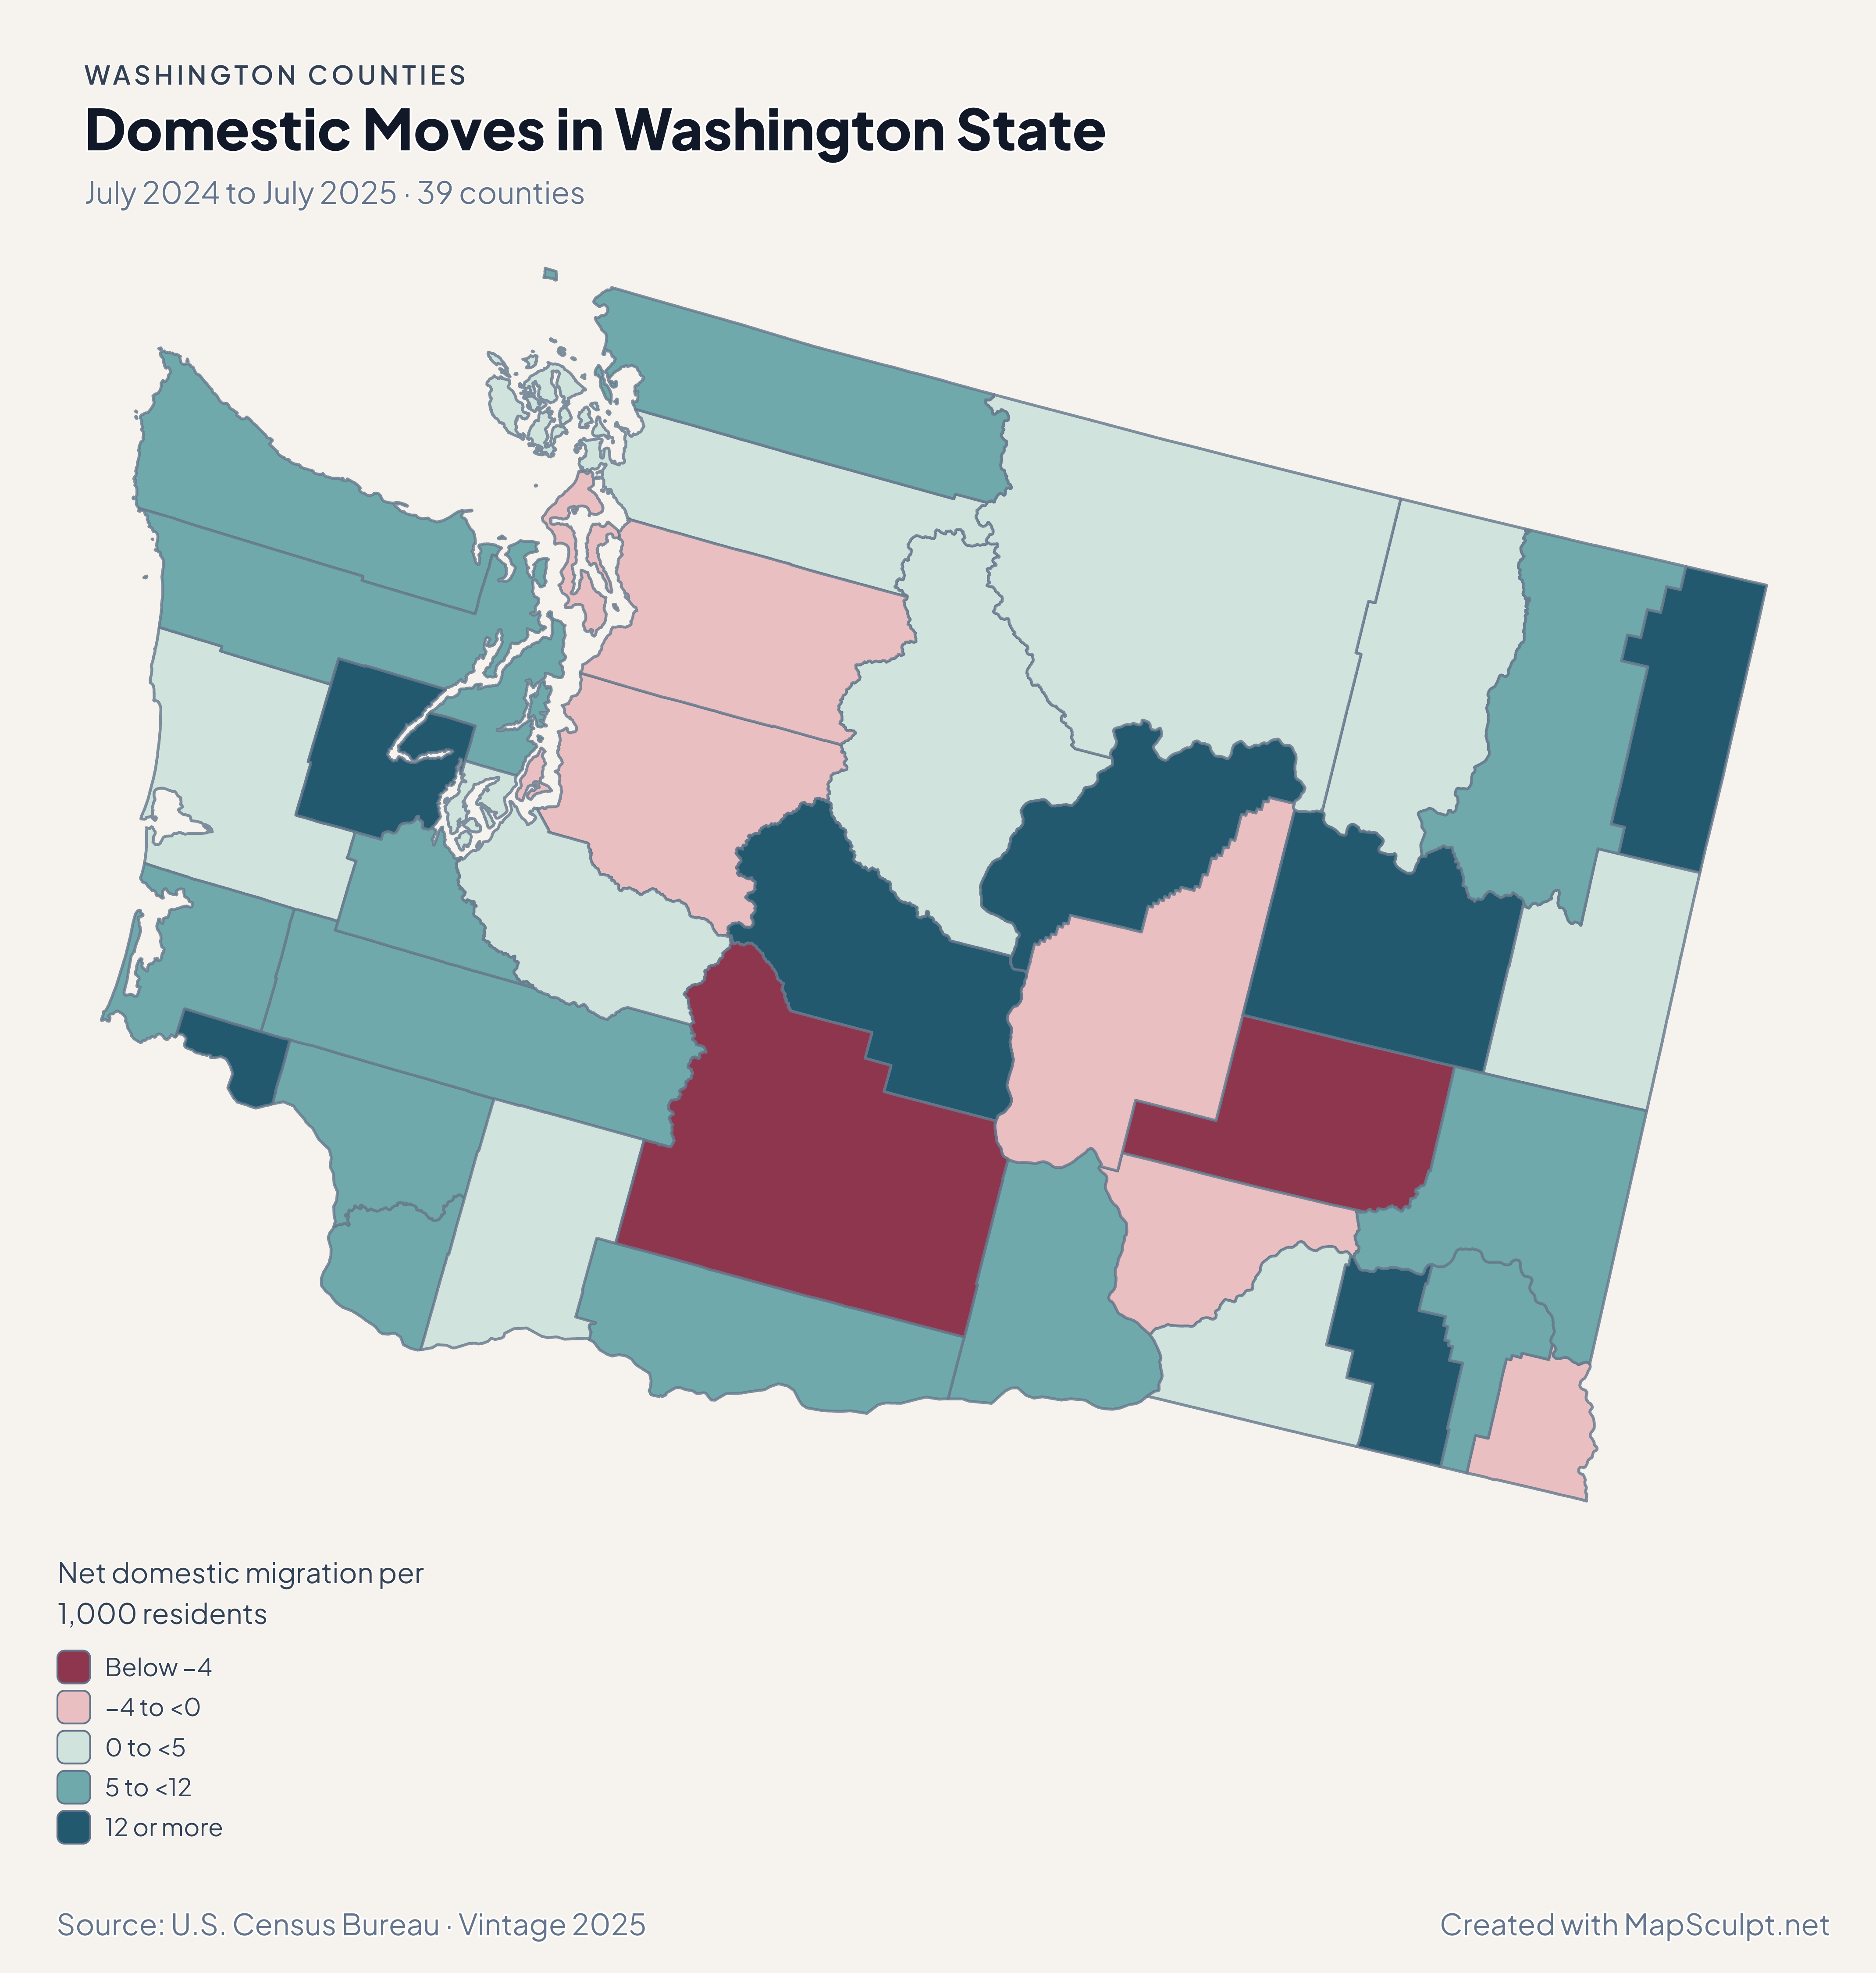
Washington State migration rates showing gains in Pierce, San Juan and Spokane and losses in King and Yakima.

July 2024 to July 2025 · 39 counties

Puget Sound counties did not move in lockstep.

King recorded −3.89 net domestic movers per 1,000, while Pierce recorded 1.25 and San Juan recorded 3.77. Farther east, Spokane recorded 2.39 and Yakima −5.98.

Net domestic migration per 1,000 residents

  • Below −4
  • −4 to <0
  • 0 to <5
  • 5 to <12
  • 12 or more

U.S. Census Bureau · Vintage 2025

Download complete PNG

Thirty-seven counties gained residents and two declined. Columbia led at 2.35%, and King grew 1.16%. Island County declined 0.38%, while neighboring San Juan gained 0.11%. See the Census estimates ↗

MAKE IT YOURS

From county data to a finished map.

  1. Open the Washington State editor

    Start with all 39 selectable counties.

  2. Match your county records

    Use a five-digit GEOID such as 53033 for King County. Review the match list before applying the data.

  3. Choose classes and colors

    Use bands that make the units and direction of change easy to read.

  4. Export with context

    Keep the source, period and legend visible in your full-resolution PNG.

TRY CSV IMPORT

Try six Washington State records.

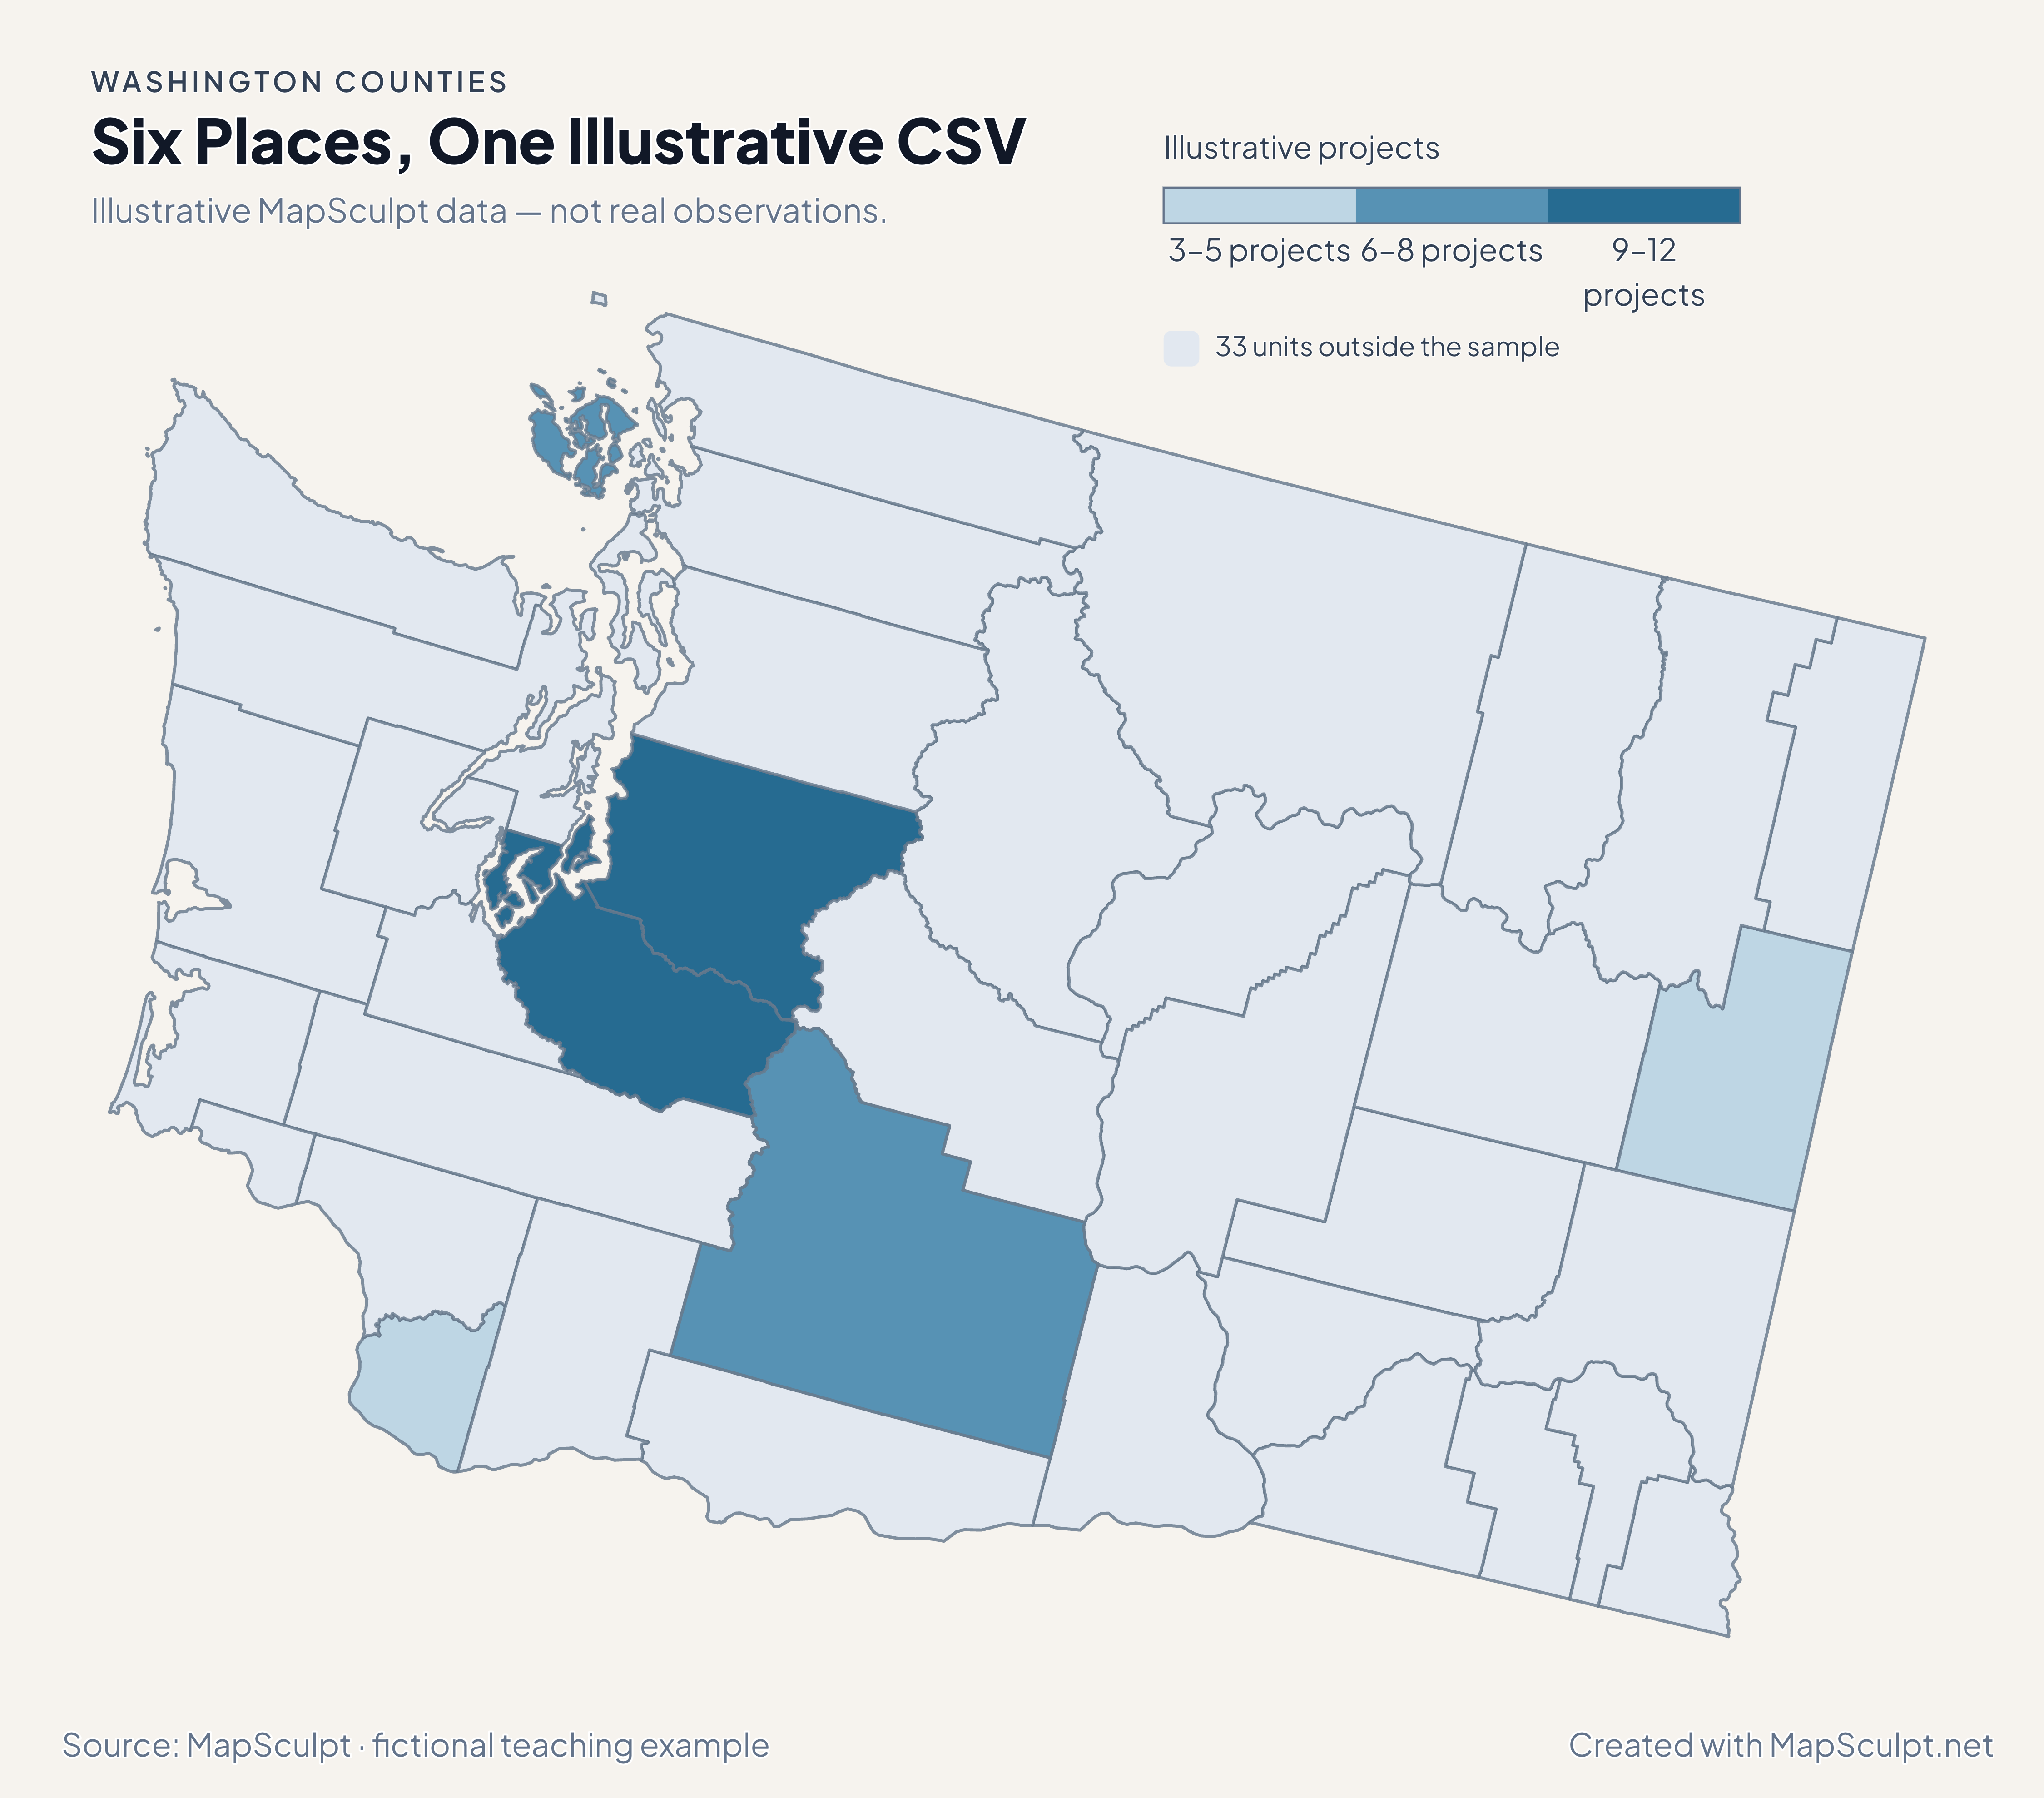
Import the fictional file, select IllustrativeProjects and use custom boundaries of 3, 6, 9 and 12. The remaining 33 units stay neutral.

Illustrative MapSculpt data — not real observations.
CountyGEOIDProjects
King County5303312
Pierce County530539
San Juan County530557
Spokane County530633
Yakima County530778
Clark County530115

Keep IDs as text. The sample uses 53033 for King County and 53053 for Pierce County.

Download illustrative CSV ↓

Six Places, One Illustrative CSV

Illustrative MapSculpt data — not real observations.

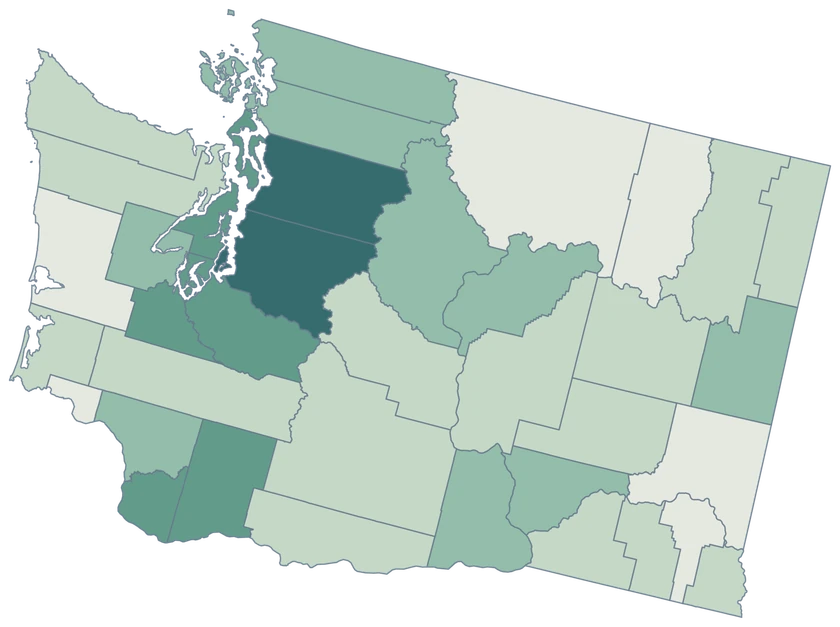
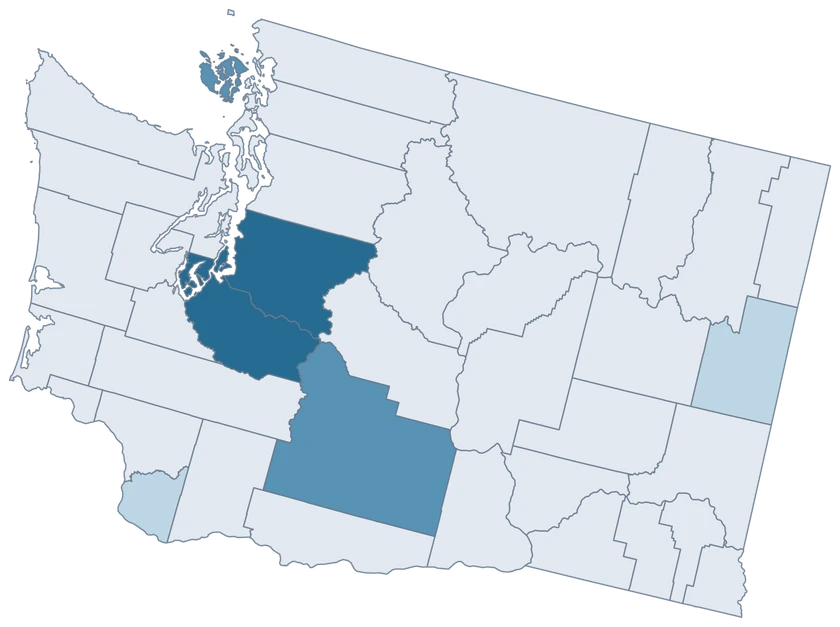
Washington State fictional project map with six sampled county-level units and 33 neutral units.

Illustrative projects

  • 3–5 projects
  • 6–8 projects
  • 9–12 projects
  • 33 units outside the sample
Download complete PNG

CSV → Match 6 counties → Style → Export PNG Create a Washington State map

COUNTY REFERENCE

All 39 Washington State counties and GEOIDs.

Official county names and five-digit Census GEOIDs. Search by name or code.

  1. Adams CountyGEOID 53001
  2. Asotin CountyGEOID 53003
  3. Benton CountyGEOID 53005
  4. Chelan CountyGEOID 53007
  5. Clallam CountyGEOID 53009
  6. Clark CountyGEOID 53011
  7. Columbia CountyGEOID 53013
  8. Cowlitz CountyGEOID 53015
  9. Douglas CountyGEOID 53017
  10. Ferry CountyGEOID 53019
  11. Franklin CountyGEOID 53021
  12. Garfield CountyGEOID 53023
  13. Grant CountyGEOID 53025
  14. Grays Harbor CountyGEOID 53027
  15. Island CountyGEOID 53029
  16. Jefferson CountyGEOID 53031
  17. King CountyGEOID 53033
  18. Kitsap CountyGEOID 53035
  19. Kittitas CountyGEOID 53037
  20. Klickitat CountyGEOID 53039
  21. Lewis CountyGEOID 53041
  22. Lincoln CountyGEOID 53043
  23. Mason CountyGEOID 53045
  24. Okanogan CountyGEOID 53047
  25. Pacific CountyGEOID 53049
  26. Pend Oreille CountyGEOID 53051
  27. Pierce CountyGEOID 53053
  28. San Juan CountyGEOID 53055
  29. Skagit CountyGEOID 53057
  30. Skamania CountyGEOID 53059
  31. Snohomish CountyGEOID 53061
  32. Spokane CountyGEOID 53063
  33. Stevens CountyGEOID 53065
  34. Thurston CountyGEOID 53067
  35. Wahkiakum CountyGEOID 53069
  36. Walla Walla CountyGEOID 53071
  37. Whatcom CountyGEOID 53073
  38. Whitman CountyGEOID 53075
  39. Yakima CountyGEOID 53077

U.S. Census Bureau · 2025 Cartographic Boundary Files

COMMON QUESTIONS

Washington county map questions.

Does this page cover Washington, D.C.?

It covers Washington State, Census state FIPS 53. Use five-digit codes beginning with 53 for its county rows.

Can I color islands within San Juan County separately?

For this county map, all pieces of San Juan County use GEOID 53055 and share a fill. Island-level data requires a different boundary layer.

How do I map a Seattle-area observation?

Use King County’s GEOID 53033 for an estimate that covers the whole county. A Seattle city figure covers a different geography.

What shows the difference between King and Pierce?

The population map shows total change, while the domestic migration map compares net internal moves. King grew with net domestic losses and Pierce recorded net domestic gains.

Can I make one map of inland Washington and Idaho?

Use the national county editor to include both states. Its five-digit county GEOIDs support a consistent join across the state line.

How much shoreline detail does the map preserve?

The 1:500,000 cartographic source is intended for statewide views. It retains major shoreline and island shapes with small features generalized.

YOUR NEXT MAP STARTS HERE

Put your Washington State data on the map.

Choose a comparison for Washington State, join your observations by Census GEOID and export a map with the period and source included.

Create a Washington State map