Skip to content
MapSculpt

GEOGRAPHIC MAP MAKER / NORTH CAROLINA

North Carolina
Counties Map Maker

Compare domestic moves from the coast through the Piedmont and into western North Carolina. Then use the 100 county boundaries to map your own figures, from a six-county example to the full state.

Free online editor · No sign-up required

100counties
individually editable

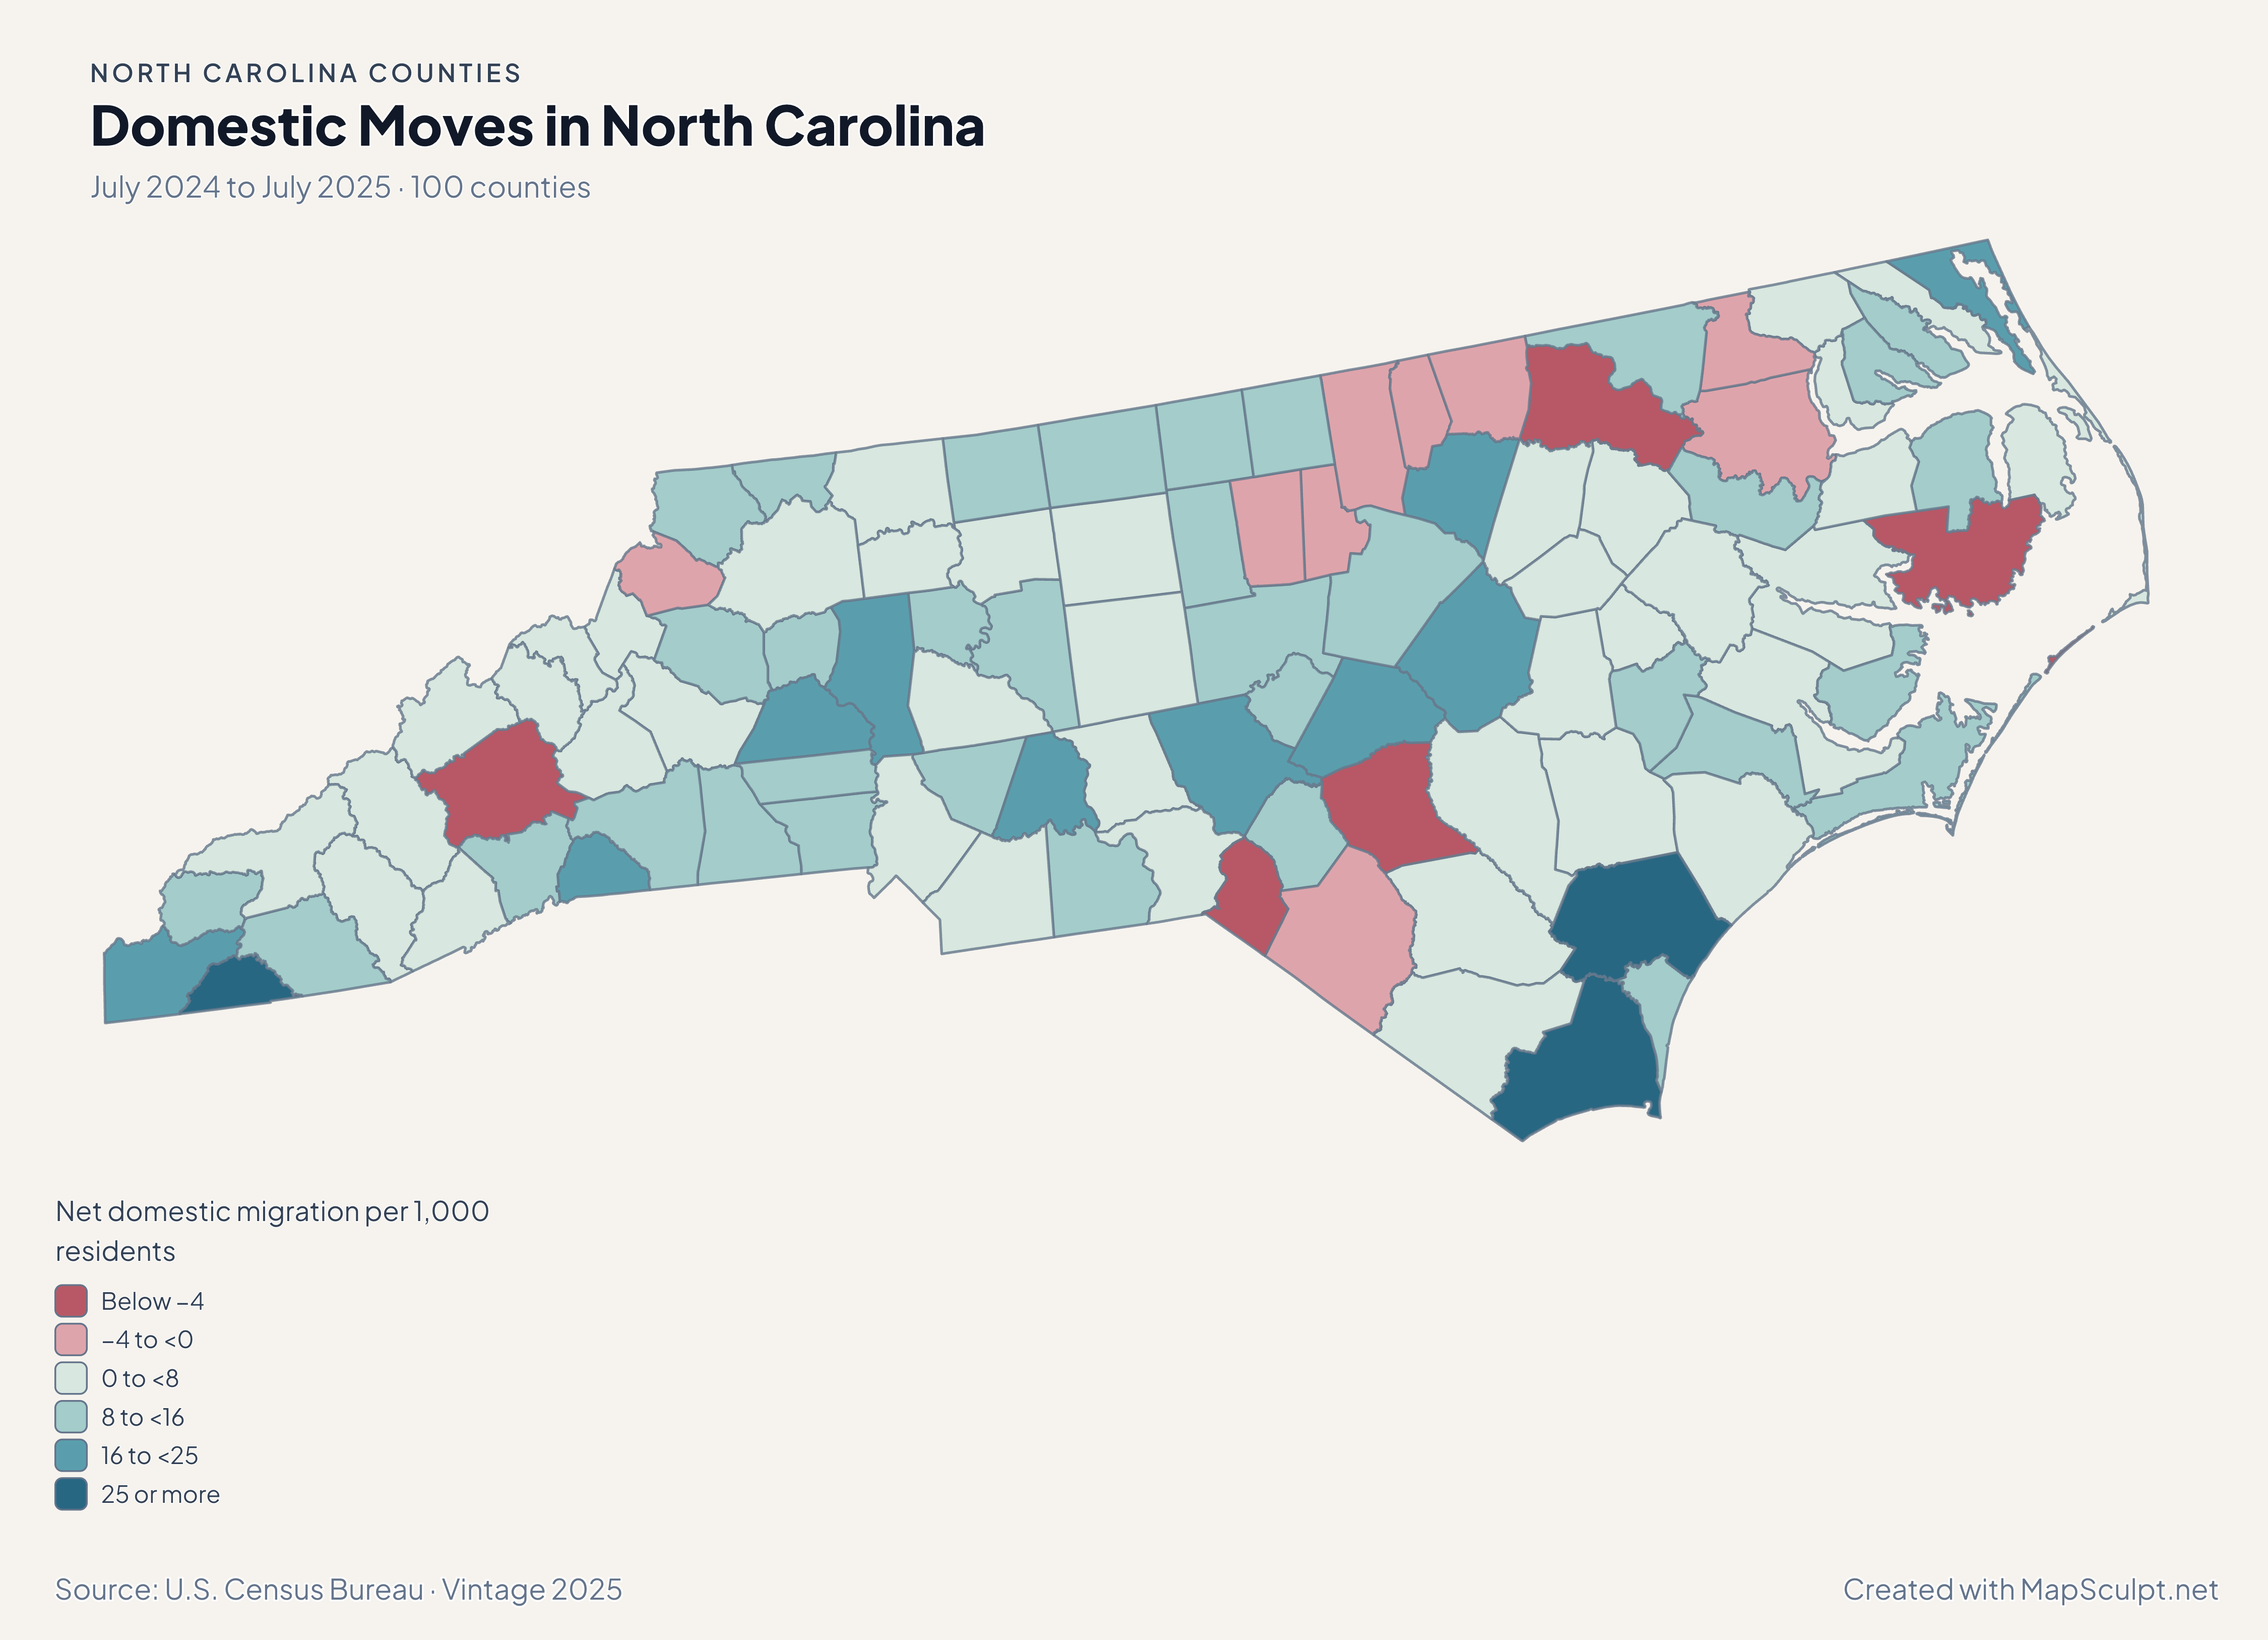
Domestic Moves in North Carolina

July 2024 to July 2025 · 100 counties

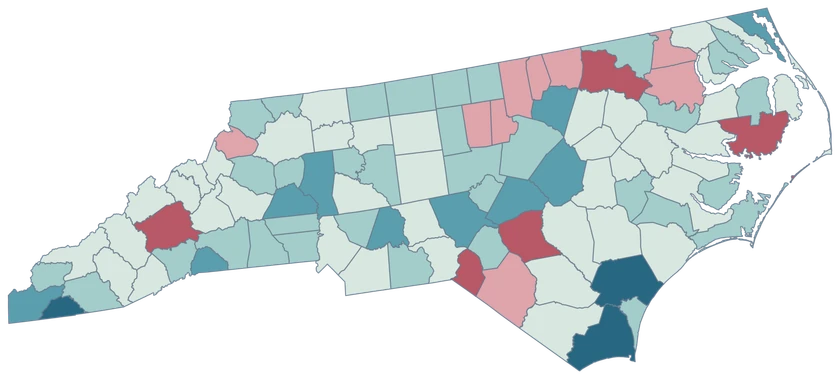
North Carolina net domestic migration map with Brunswick and Johnston in high gain bands and Buncombe in a loss band.

Net domestic migration per 1,000 residents

  • Below −4
  • −4 to <0
  • 0 to <8
  • 8 to <16
  • 16 to <25
  • 25 or more
U.S. Census Bureau · Vintage 2025Download complete PNG Rates compare net moves within the United States with the average of the two July county populations.

KNOW YOUR GEOGRAPHY

From the mountains to the Outer Banks.

North Carolina’s county map stretches from the western mountains across the Piedmont to the coast. The Outer Banks appear at the level of detail retained in the Census cartographic file. Separate pieces of the same county share its GEOID.

Compare a coastal county like Brunswick with Piedmont and western counties using values at the same geographic scale. Cities, barrier islands and reservations do not become separate county records.

Browse all county GEOIDs ↗

2025 Census boundaries

OFFICIAL DATA

The coast and Piedmont show different kinds of growth.

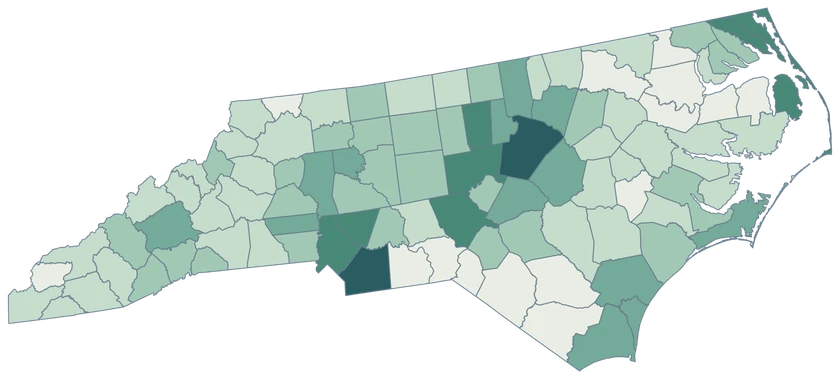
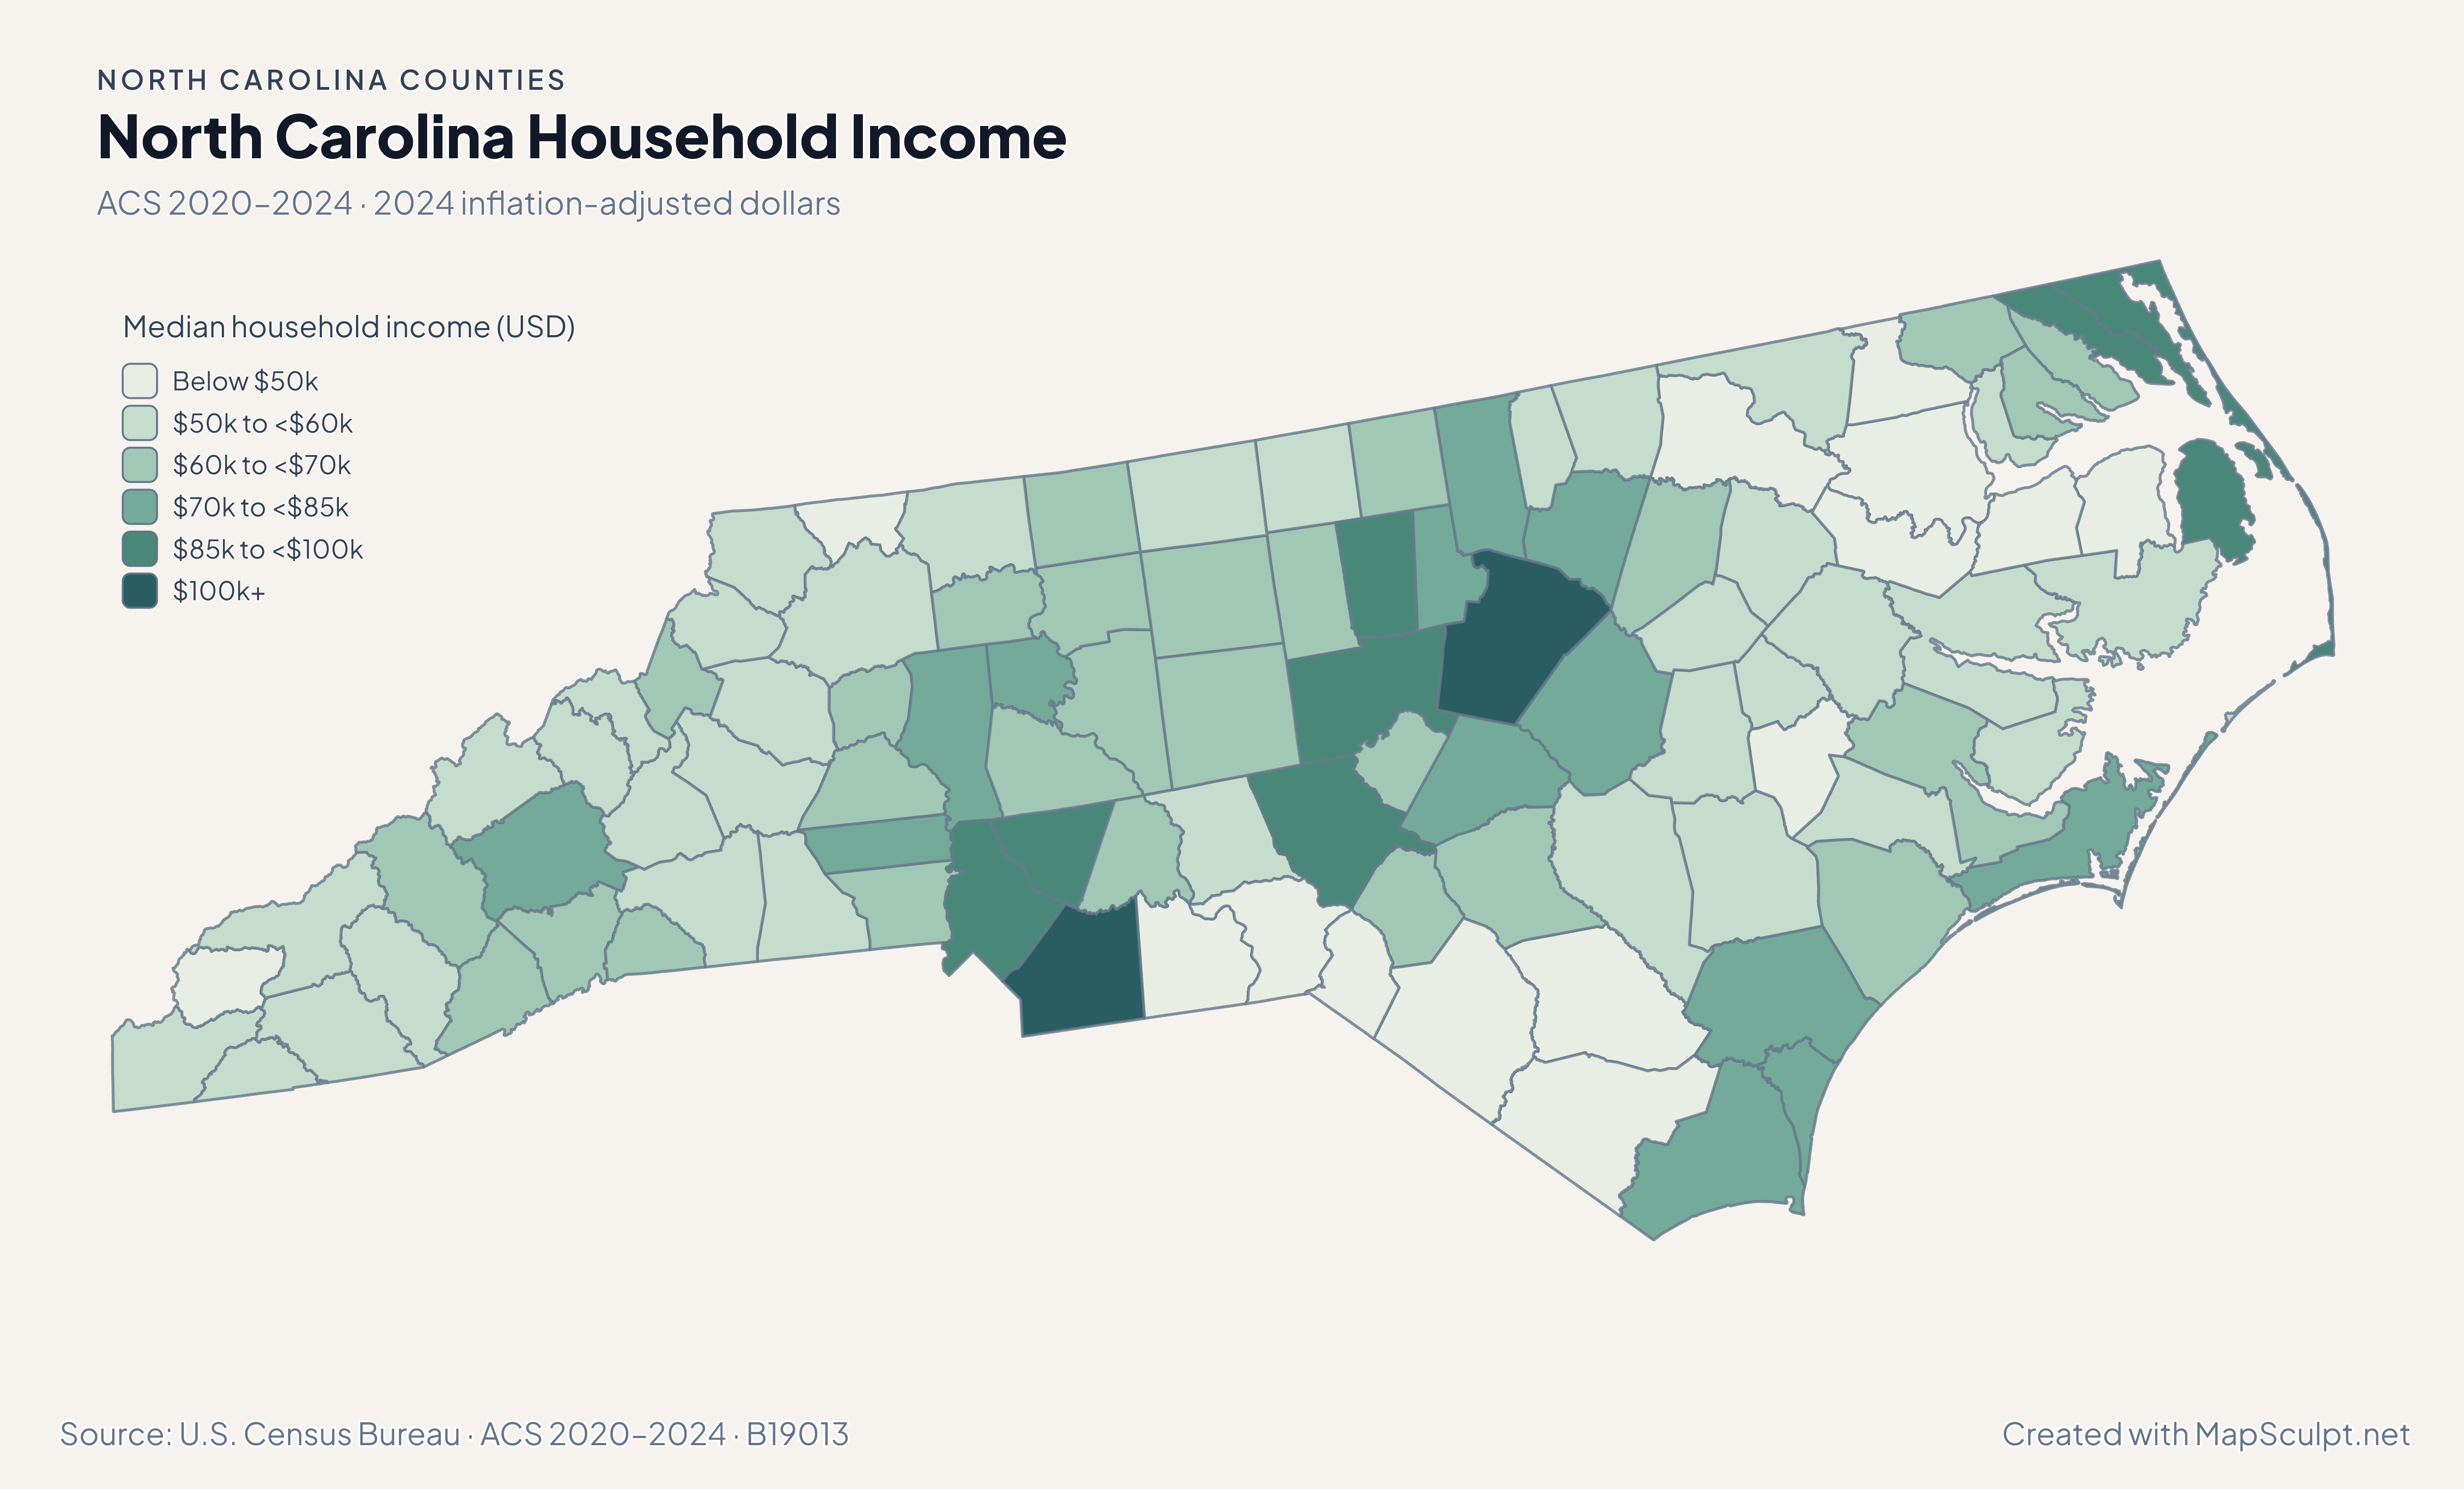
Follow the difference between domestic migration and total growth along the coast, across the Piedmont and into western North Carolina. The ACS maps add income and renter context.

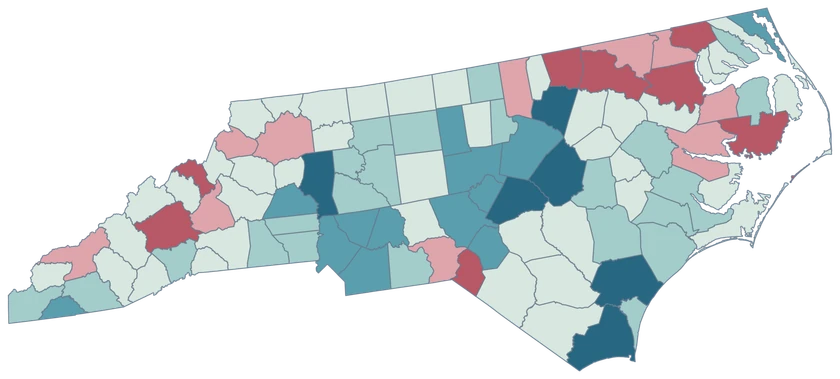
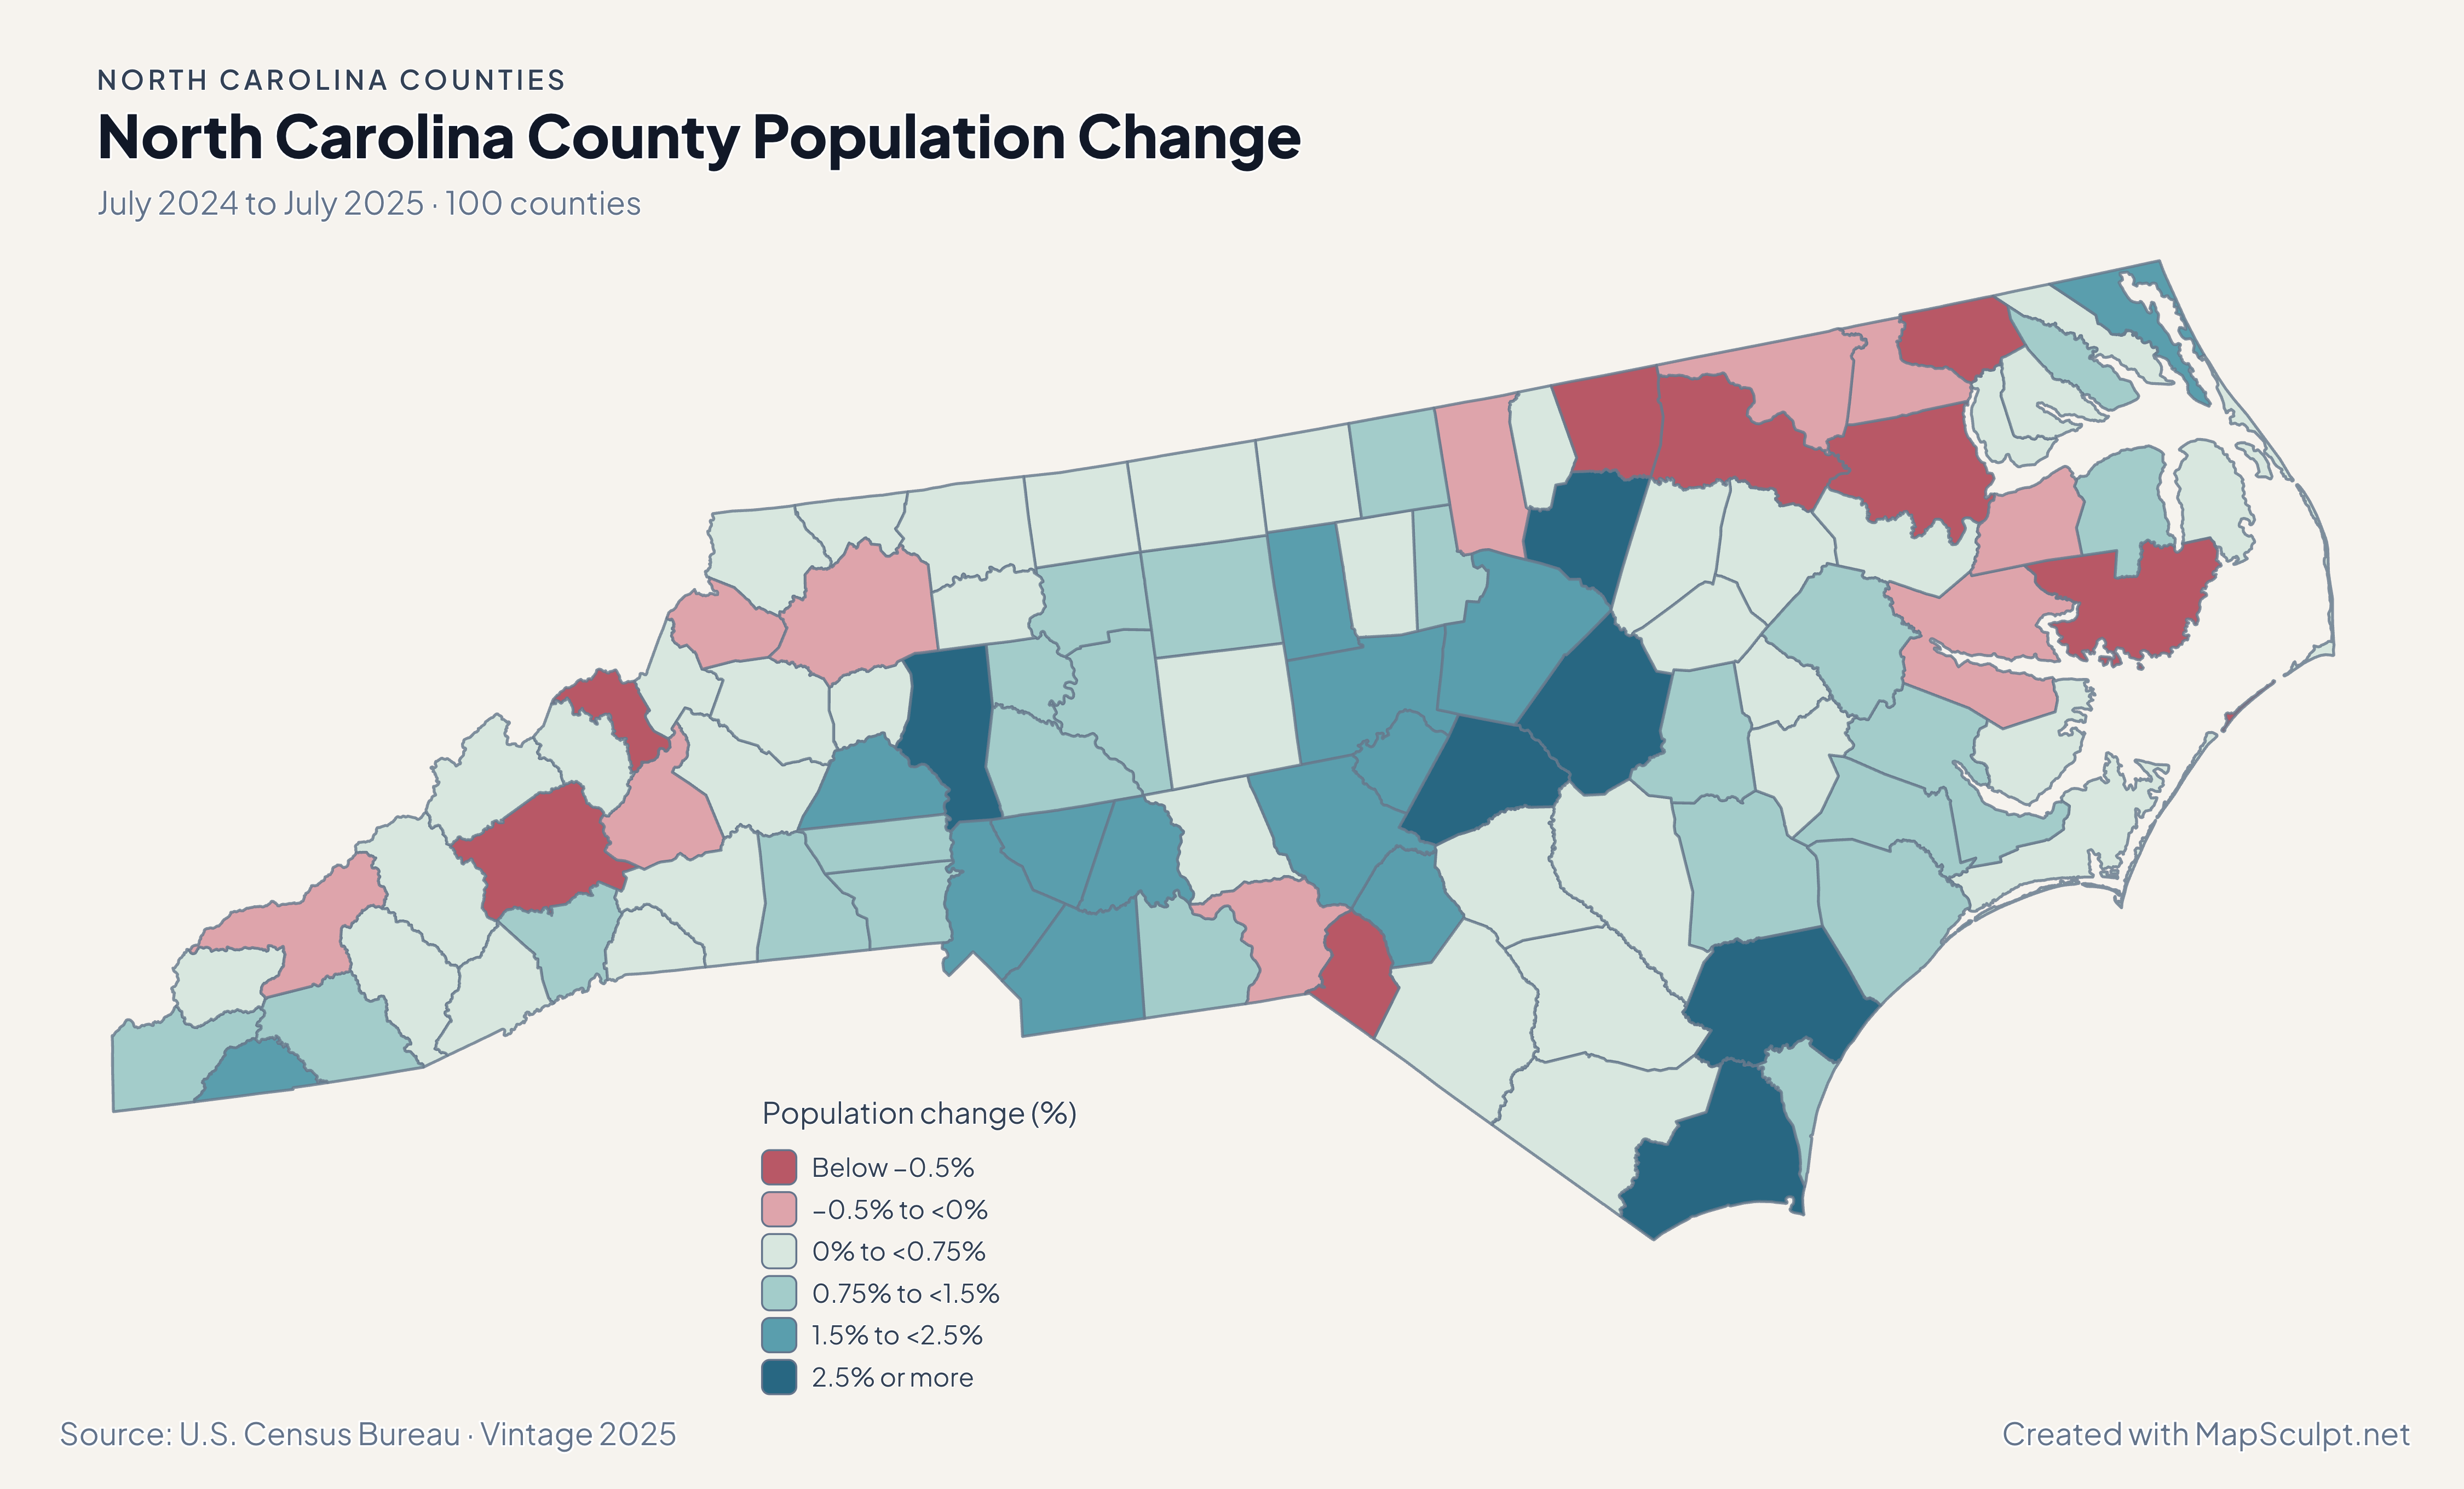
North Carolina population change map with strong gains on the southern coast and in parts of the Piedmont.

July 2024 to July 2025 · 100 counties

Overall growth also reached the Piedmont.

Brunswick led percentage growth at 4.68%, with Johnston at 2.78%, Wake at 2.26%, and Mecklenburg at 2.20%. Buncombe declined 0.65%. Population and migration estimates describe different measures across the same period.

Population change (%)

  • Below −0.5%
  • −0.5% to <0%
  • 0% to <0.75%
  • 0.75% to <1.5%
  • 1.5% to <2.5%
  • 2.5% or more

U.S. Census Bureau · Vintage 2025

Download complete PNG

Brunswick led at 50.25 net domestic movers per 1,000 residents. Johnston recorded 21.53, Wake 10.29, and Buncombe −7.39. The rates show a coastal maximum alongside gains and losses farther inland. See the Census estimates ↗

MAKE IT YOURS

From county data to a finished map.

  1. Open the North Carolina editor

    Start with the 100 official county features.

  2. Match county GEOIDs

    Use a dedicated five-digit county column, such as 37183 for Wake County.

  3. Build a readable legend

    Choose class breaks that fit your measure and write the period and units beside the map.

  4. Export the finished map

    Check the full composition, then download a high-resolution PNG with your title and source.

TRY CSV IMPORT

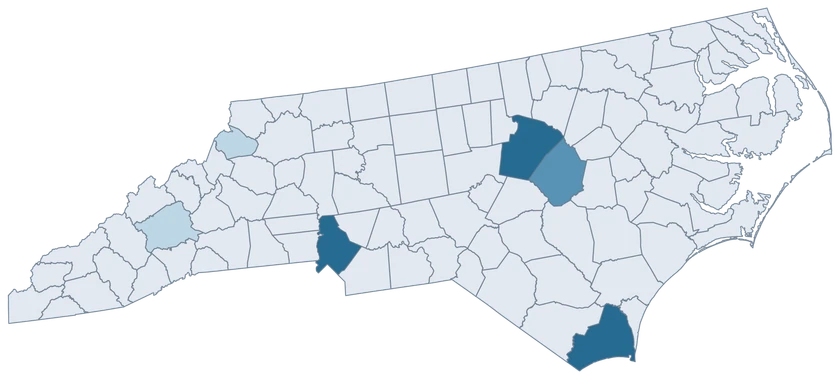
Practice with six North Carolina counties.

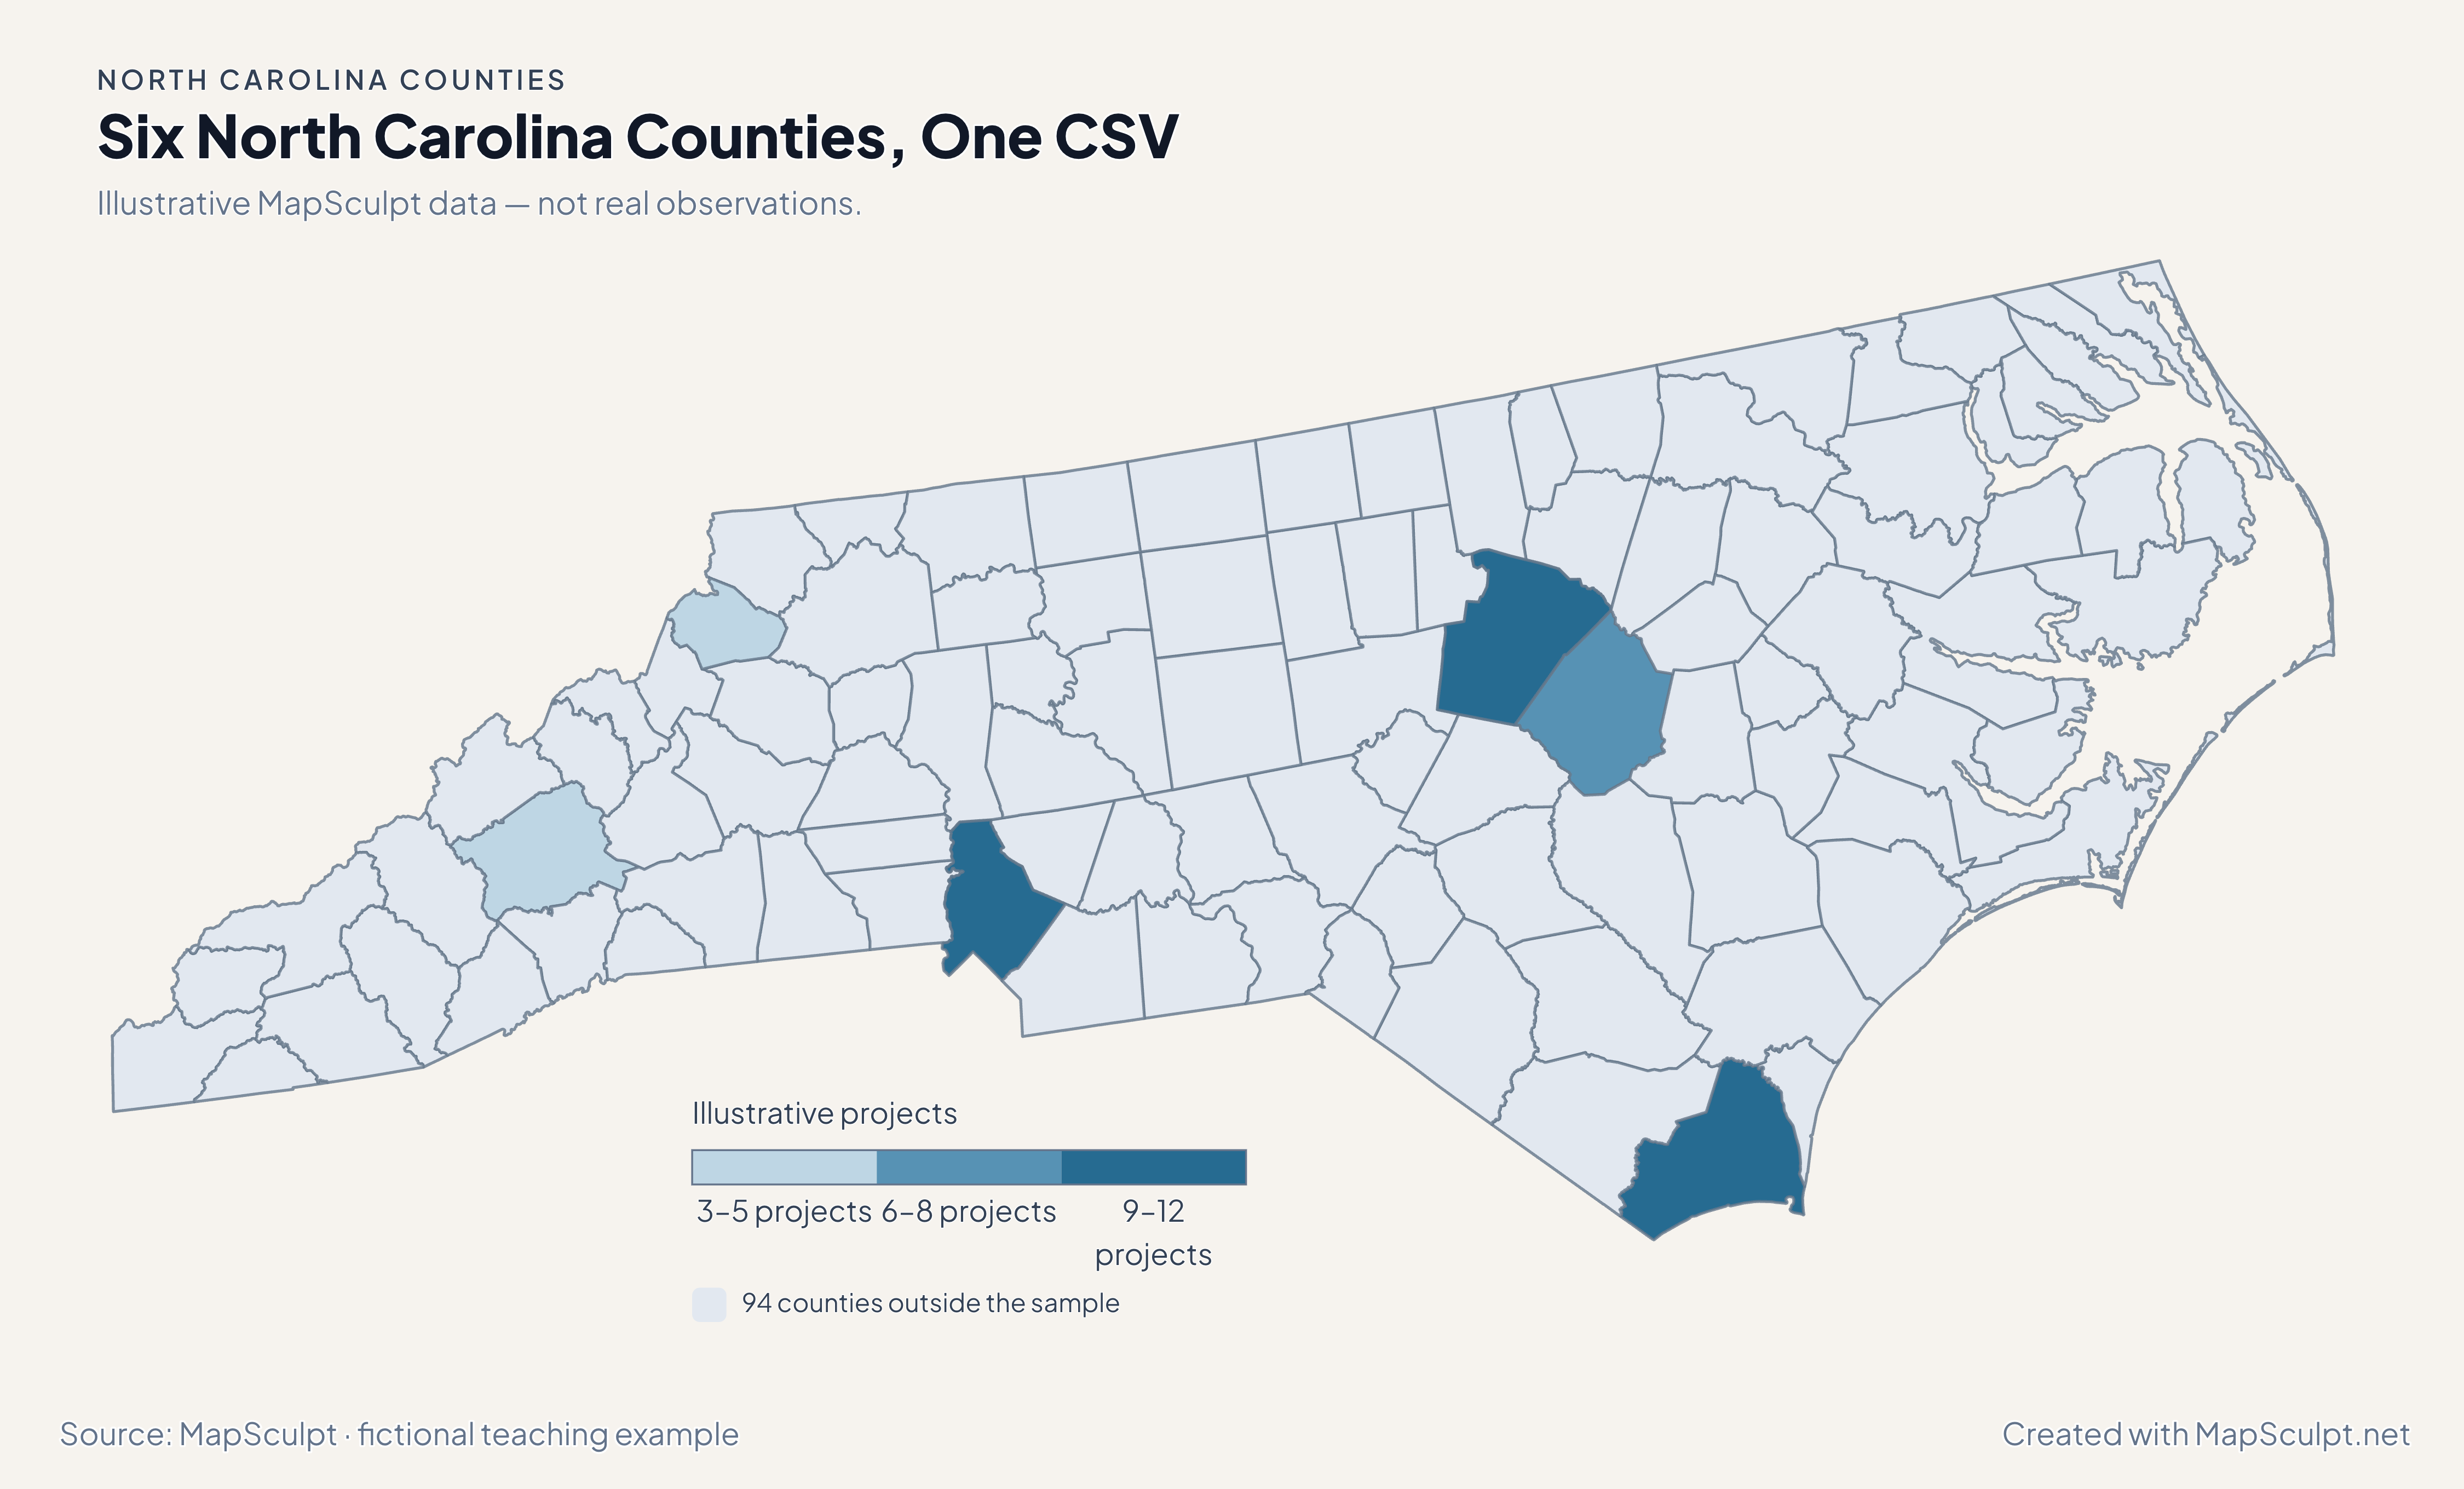
Import the fictional project counts, choose IllustrativeProjects and set numeric boundaries of 3, 6, 9 and 12. The 94 counties outside the sample share a neutral fill.

Illustrative MapSculpt data — not real observations.
CountyGEOIDProjects
Wake County3718312
Mecklenburg County371199
Brunswick County3701911
Buncombe County370215
Johnston County371017
Watauga County371893

Keep GEOIDs as text. In this sample Wake County is 37183 and Watauga County is 37189. Use the directory when preparing a larger county join.

Download illustrative CSV ↓

Six North Carolina Counties, One CSV

Illustrative MapSculpt data — not real observations.

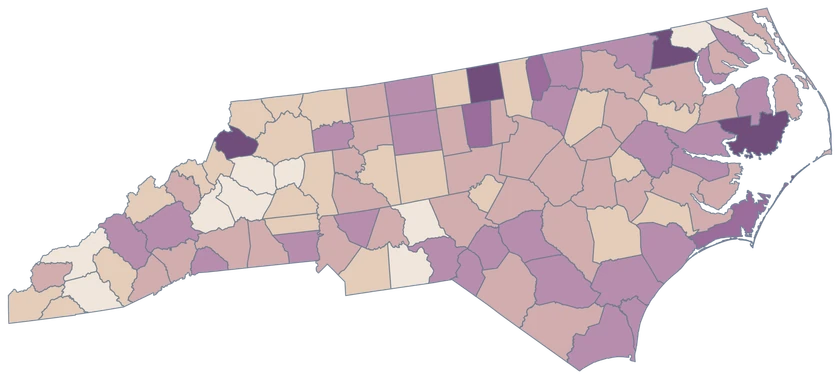
Illustrative North Carolina map highlighting six sampled counties, with the remaining 94 counties in a neutral shade.

Illustrative projects

  • 3–5 projects
  • 6–8 projects
  • 9–12 projects
  • 94 counties outside the sample
Download complete PNG

CSV → Match 6 counties → Style → Export PNG Create a North Carolina map

COUNTY REFERENCE

Find all 100 North Carolina county GEOIDs.

Official county names and five-digit Census GEOIDs. Search by name or code.

  1. Alamance CountyGEOID 37001
  2. Alexander CountyGEOID 37003
  3. Alleghany CountyGEOID 37005
  4. Anson CountyGEOID 37007
  5. Ashe CountyGEOID 37009
  6. Avery CountyGEOID 37011
  7. Beaufort CountyGEOID 37013
  8. Bertie CountyGEOID 37015
  9. Bladen CountyGEOID 37017
  10. Brunswick CountyGEOID 37019
  11. Buncombe CountyGEOID 37021
  12. Burke CountyGEOID 37023
  13. Cabarrus CountyGEOID 37025
  14. Caldwell CountyGEOID 37027
  15. Camden CountyGEOID 37029
  16. Carteret CountyGEOID 37031
  17. Caswell CountyGEOID 37033
  18. Catawba CountyGEOID 37035
  19. Chatham CountyGEOID 37037
  20. Cherokee CountyGEOID 37039
  21. Chowan CountyGEOID 37041
  22. Clay CountyGEOID 37043
  23. Cleveland CountyGEOID 37045
  24. Columbus CountyGEOID 37047
  25. Craven CountyGEOID 37049
  26. Cumberland CountyGEOID 37051
  27. Currituck CountyGEOID 37053
  28. Dare CountyGEOID 37055
  29. Davidson CountyGEOID 37057
  30. Davie CountyGEOID 37059
  31. Duplin CountyGEOID 37061
  32. Durham CountyGEOID 37063
  33. Edgecombe CountyGEOID 37065
  34. Forsyth CountyGEOID 37067
  35. Franklin CountyGEOID 37069
  36. Gaston CountyGEOID 37071
  37. Gates CountyGEOID 37073
  38. Graham CountyGEOID 37075
  39. Granville CountyGEOID 37077
  40. Greene CountyGEOID 37079
  41. Guilford CountyGEOID 37081
  42. Halifax CountyGEOID 37083
  43. Harnett CountyGEOID 37085
  44. Haywood CountyGEOID 37087
  45. Henderson CountyGEOID 37089
  46. Hertford CountyGEOID 37091
  47. Hoke CountyGEOID 37093
  48. Hyde CountyGEOID 37095
  49. Iredell CountyGEOID 37097
  50. Jackson CountyGEOID 37099
  51. Johnston CountyGEOID 37101
  52. Jones CountyGEOID 37103
  53. Lee CountyGEOID 37105
  54. Lenoir CountyGEOID 37107
  55. Lincoln CountyGEOID 37109
  56. Macon CountyGEOID 37113
  57. Madison CountyGEOID 37115
  58. Martin CountyGEOID 37117
  59. McDowell CountyGEOID 37111
  60. Mecklenburg CountyGEOID 37119
  61. Mitchell CountyGEOID 37121
  62. Montgomery CountyGEOID 37123
  63. Moore CountyGEOID 37125
  64. Nash CountyGEOID 37127
  65. New Hanover CountyGEOID 37129
  66. Northampton CountyGEOID 37131
  67. Onslow CountyGEOID 37133
  68. Orange CountyGEOID 37135
  69. Pamlico CountyGEOID 37137
  70. Pasquotank CountyGEOID 37139
  71. Pender CountyGEOID 37141
  72. Perquimans CountyGEOID 37143
  73. Person CountyGEOID 37145
  74. Pitt CountyGEOID 37147
  75. Polk CountyGEOID 37149
  76. Randolph CountyGEOID 37151
  77. Richmond CountyGEOID 37153
  78. Robeson CountyGEOID 37155
  79. Rockingham CountyGEOID 37157
  80. Rowan CountyGEOID 37159
  81. Rutherford CountyGEOID 37161
  82. Sampson CountyGEOID 37163
  83. Scotland CountyGEOID 37165
  84. Stanly CountyGEOID 37167
  85. Stokes CountyGEOID 37169
  86. Surry CountyGEOID 37171
  87. Swain CountyGEOID 37173
  88. Transylvania CountyGEOID 37175
  89. Tyrrell CountyGEOID 37177
  90. Union CountyGEOID 37179
  91. Vance CountyGEOID 37181
  92. Wake CountyGEOID 37183
  93. Warren CountyGEOID 37185
  94. Washington CountyGEOID 37187
  95. Watauga CountyGEOID 37189
  96. Wayne CountyGEOID 37191
  97. Wilkes CountyGEOID 37193
  98. Wilson CountyGEOID 37195
  99. Yadkin CountyGEOID 37197
  100. Yancey CountyGEOID 37199

U.S. Census Bureau · 2025 Cartographic Boundary Files

COMMON QUESTIONS

North Carolina county map questions.

Can I color the Outer Banks separately?

Select individual counties. The barrier-island pieces shown in the Census source share their respective county identity. A separate Outer Banks region would require different geography.

Which GEOIDs distinguish Raleigh-area and Charlotte-area county data?

Use 37183 for Wake County and 37119 for Mecklenburg County when your observations cover those counties. Raleigh and Charlotte city figures describe different boundaries.

Why does Brunswick stand out on two maps?

Brunswick recorded both the highest population growth rate and the highest net domestic migration rate in the state for July 2024 to July 2025. The maps use different units.

How can I compare a western county with the coast?

Use the same indicator and period across counties, such as the pinned migration estimates for Buncombe and Brunswick. Join each value with its own five-digit GEOID.

Which county includes Asheville on this map?

Asheville is within Buncombe County. Use GEOID 37021 for county-wide data and keep city-specific observations separate.

How much detail should I expect along the coast?

The displayed boundaries are generalized at 1:500,000. Small inlets and islands may be simplified, so use appropriate detailed data for marine navigation or parcel-level work.

YOUR NEXT MAP STARTS HERE

Create your own North Carolina county view.

Build a coastal-to-mountain comparison or highlight a set of counties. Add your legend and export a map with its context intact.

Create a North Carolina map