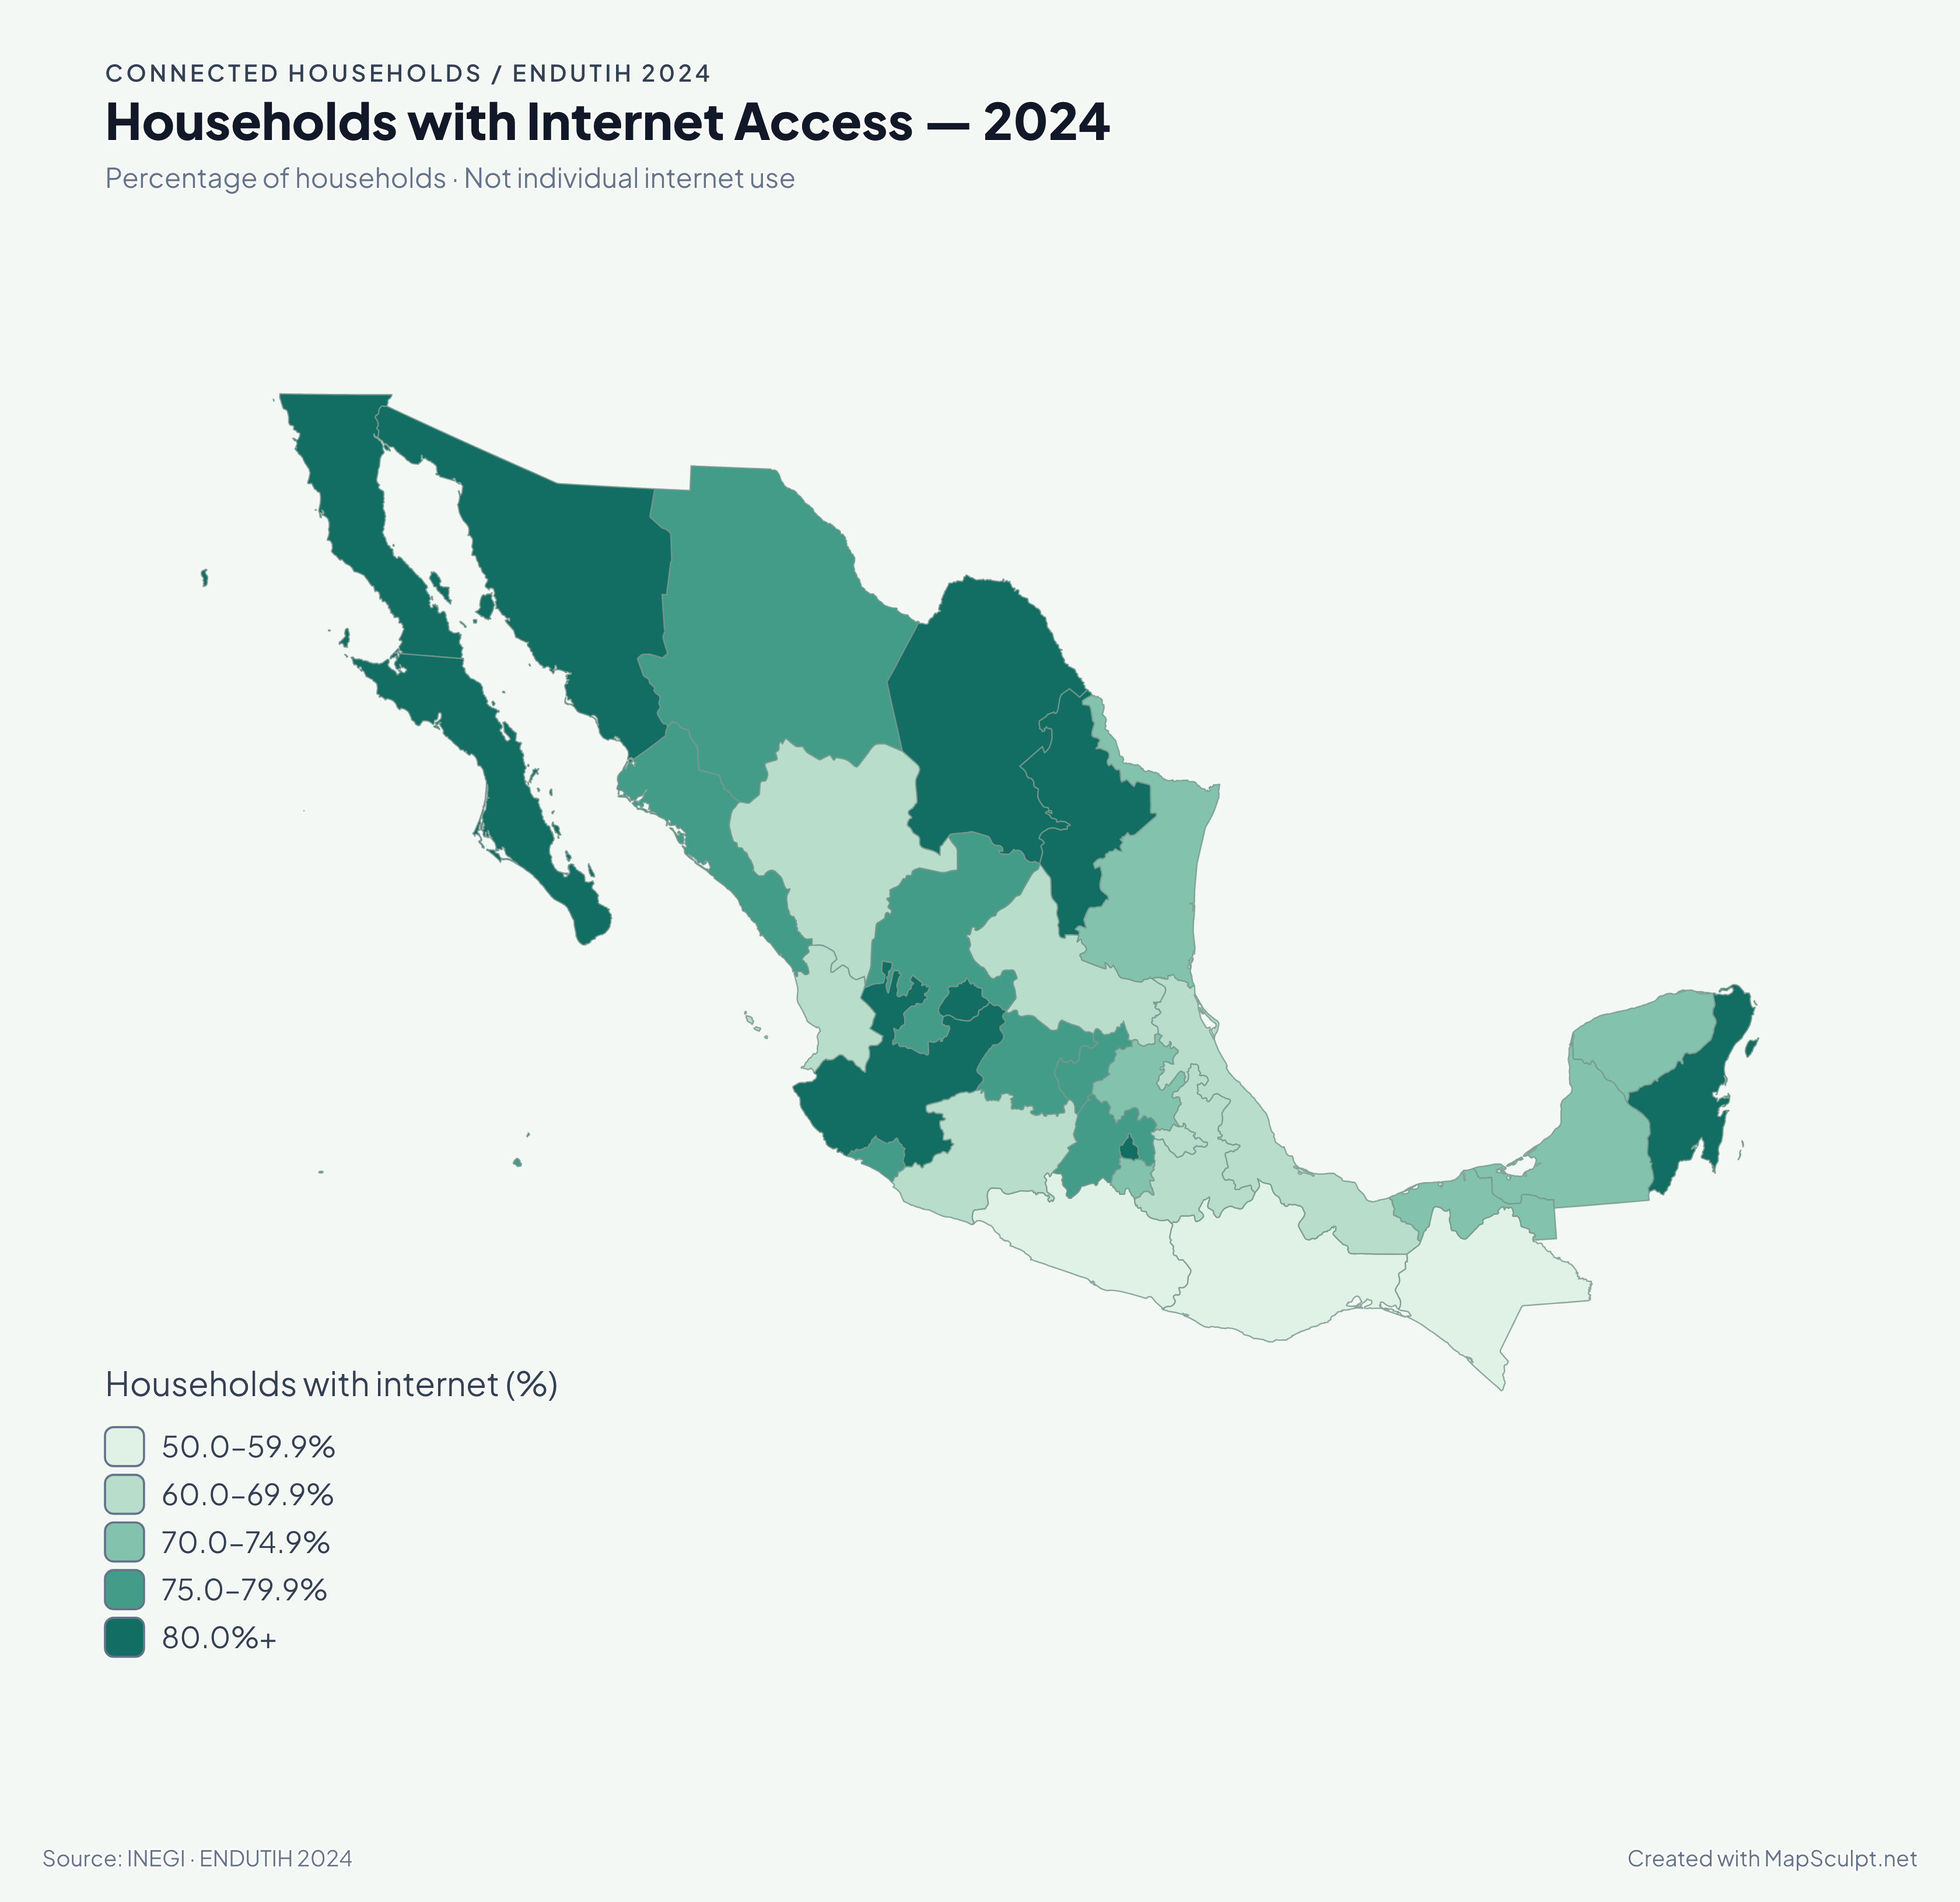
Household internet access bands: 50.0–59.9%; 60.0–69.9%; 70.0–74.9%; 75.0–79.9%; 80.0% and above. Darker teal means a larger percentage of households.
View full-size export

CHOROPLETH MAP MAKER / CSV TO MAP
Turn a table into a geographic story. Import CSV data, match geographic regions, classify numerical values, customize your map and export a PNG.
Free browser-based editor · Export a high-resolution PNG
03 / ACTUAL MAPSCULPT EXPORT
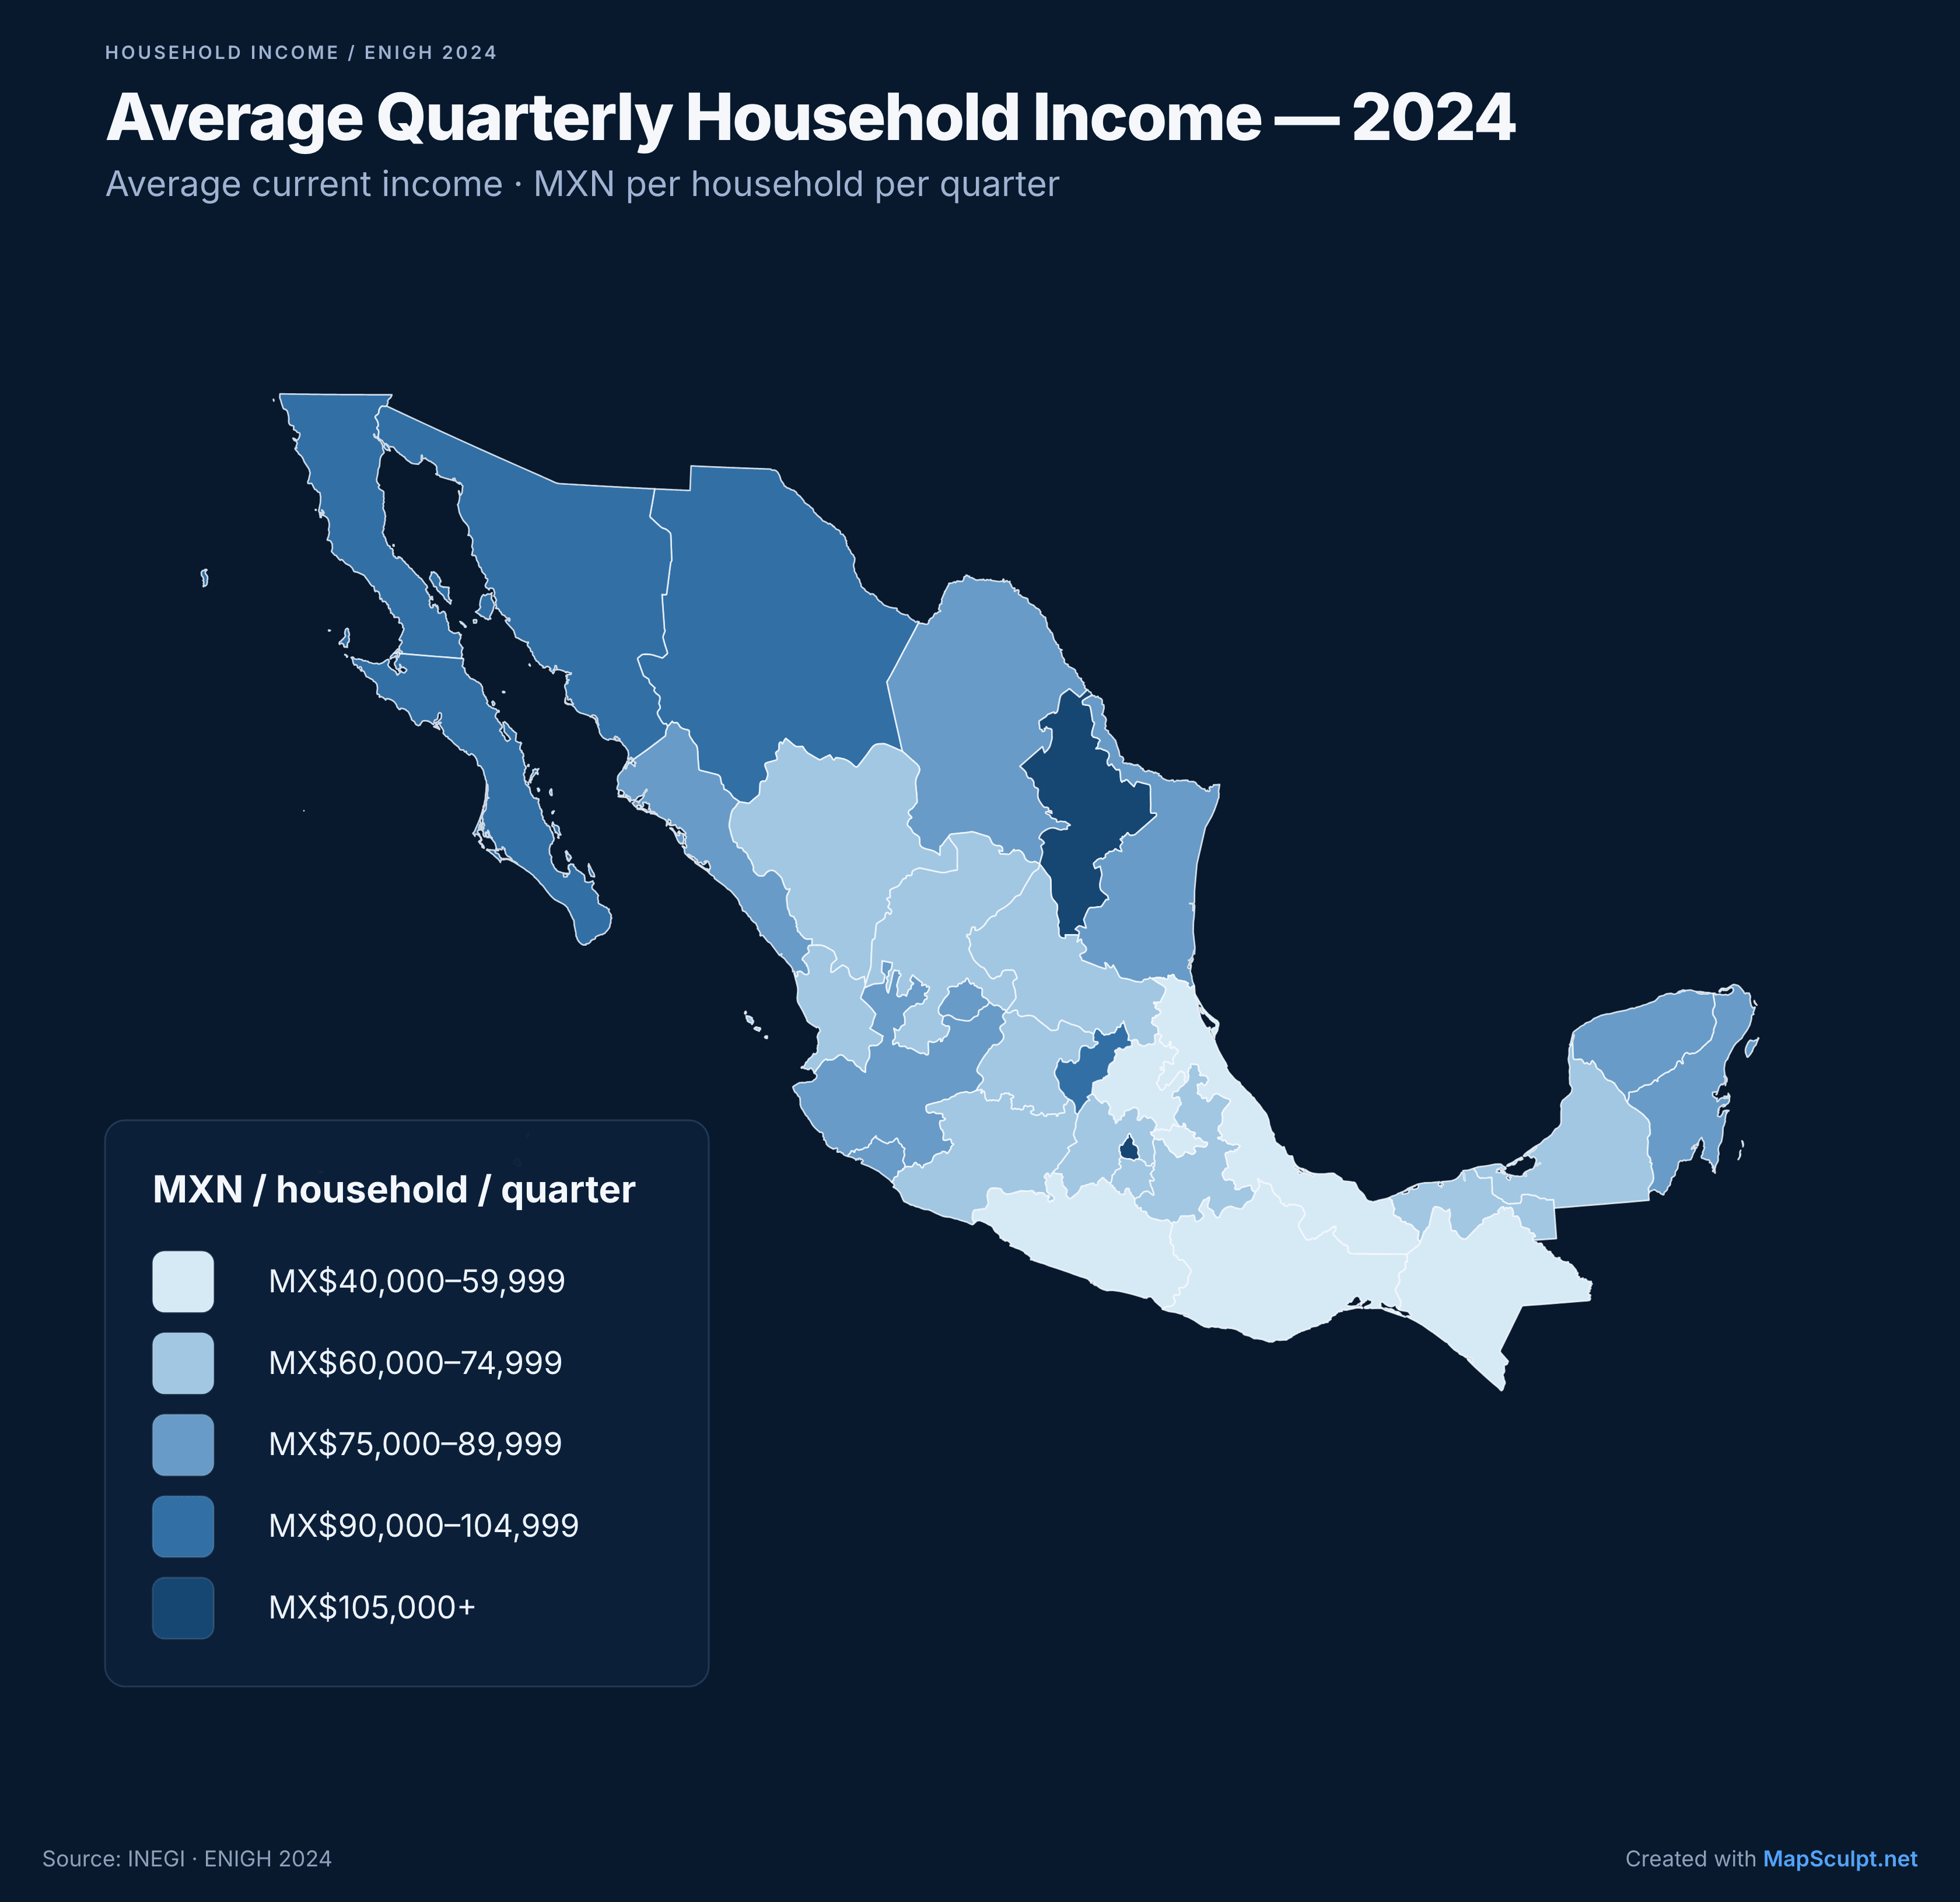
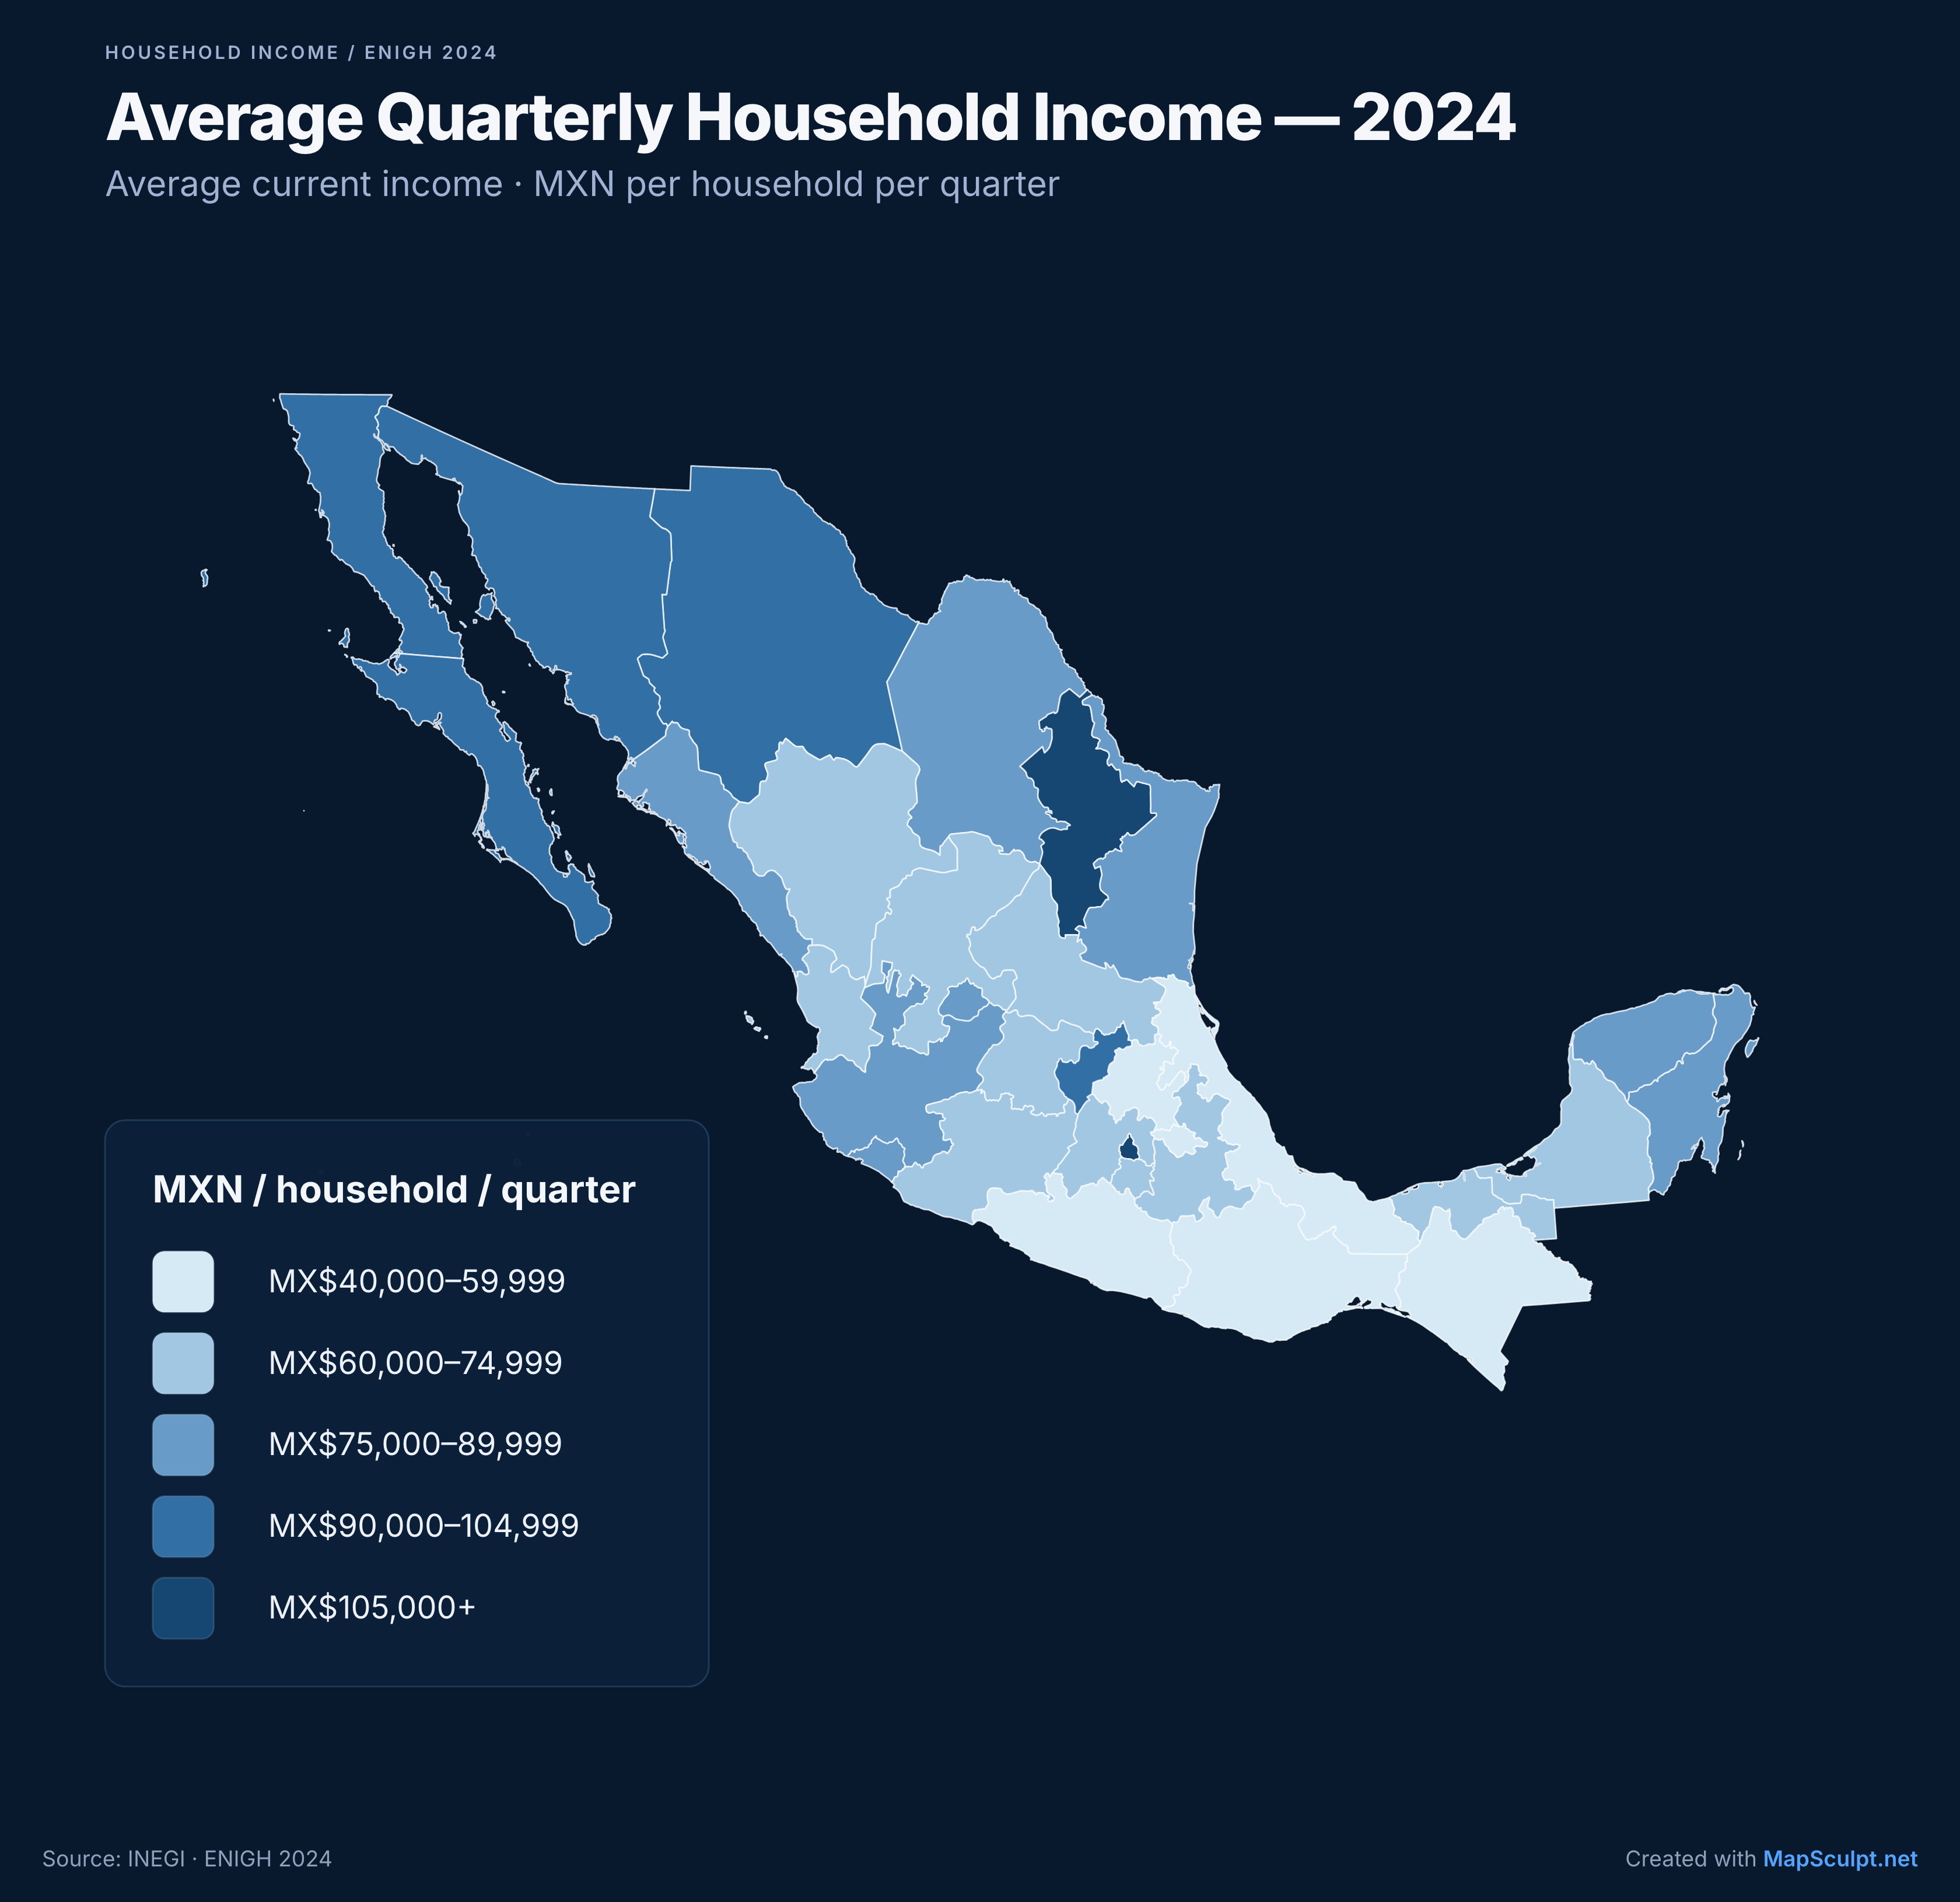
Income bands in MXN per household per quarter: 40,000–59,999; 60,000–74,999; 75,000–89,999; 90,000–104,999; 105,000 and above. Darker blue means higher income. These are visualization ranges, not official INEGI classifications.
Inspect full-size output01 / YOUR INPUT
32 rows · RegionCode + Value
RegionCode,Value
MX-CHP,41084
MX-CMX,110685
MX-NLE,117034
Three real rows from the complete, verified 32-row CSV.
Download complete sample CSV (32 rows)Download the file, then import it in the Mexico editor. Opening the editor does not preload this dataset.
02 / MATCH & CLASSIFY
ISO/editor codes keep Mexico City (MX-CMX) distinct from the State of Mexico (MX-MEX).
5 custom bands
MXN per household per quarter
Custom range boundaries: 40,000; 60,000; 75,000; 90,000; 105,000; 120,000. Review matches, choose these breaks, then apply the data.
01 / READ THE MAP
A choropleth uses colors or shades to show values across defined areas. It is useful for regional comparisons of income, rates, percentages and change over time.
Here, Nuevo León is MX$117,034 per household per quarter; Chiapas is MX$41,084. The national reference is MX$77,864. These are average quarterly current household incomes, including monetary and nonmonetary income, in pesos of 2024 — not monthly wages, median income or income per capita.
The five bands are visualization choices. Keep the period, units and method visible.
MAKE IT YOURS
Open a supported map whose boundaries match your data.
Export Excel or Google Sheets as CSV. Open Import CSV in the editor and choose your file.
Select the Region column. Resolve unmatched or ambiguous identifiers and duplicate assignments before applying.
Select the Value column and Numerical or Categorical. For numbers, choose Equal intervals, Quantiles or Custom ranges and a suitable palette.
Review the preview and apply. Edit the title, subtitle, legend and source, then download your PNG.
CSV import availability depends on the editor’s current release settings. The landing page does not upload or import files.
02 / DIFFERENT QUESTIONS, DIFFERENT MAPS
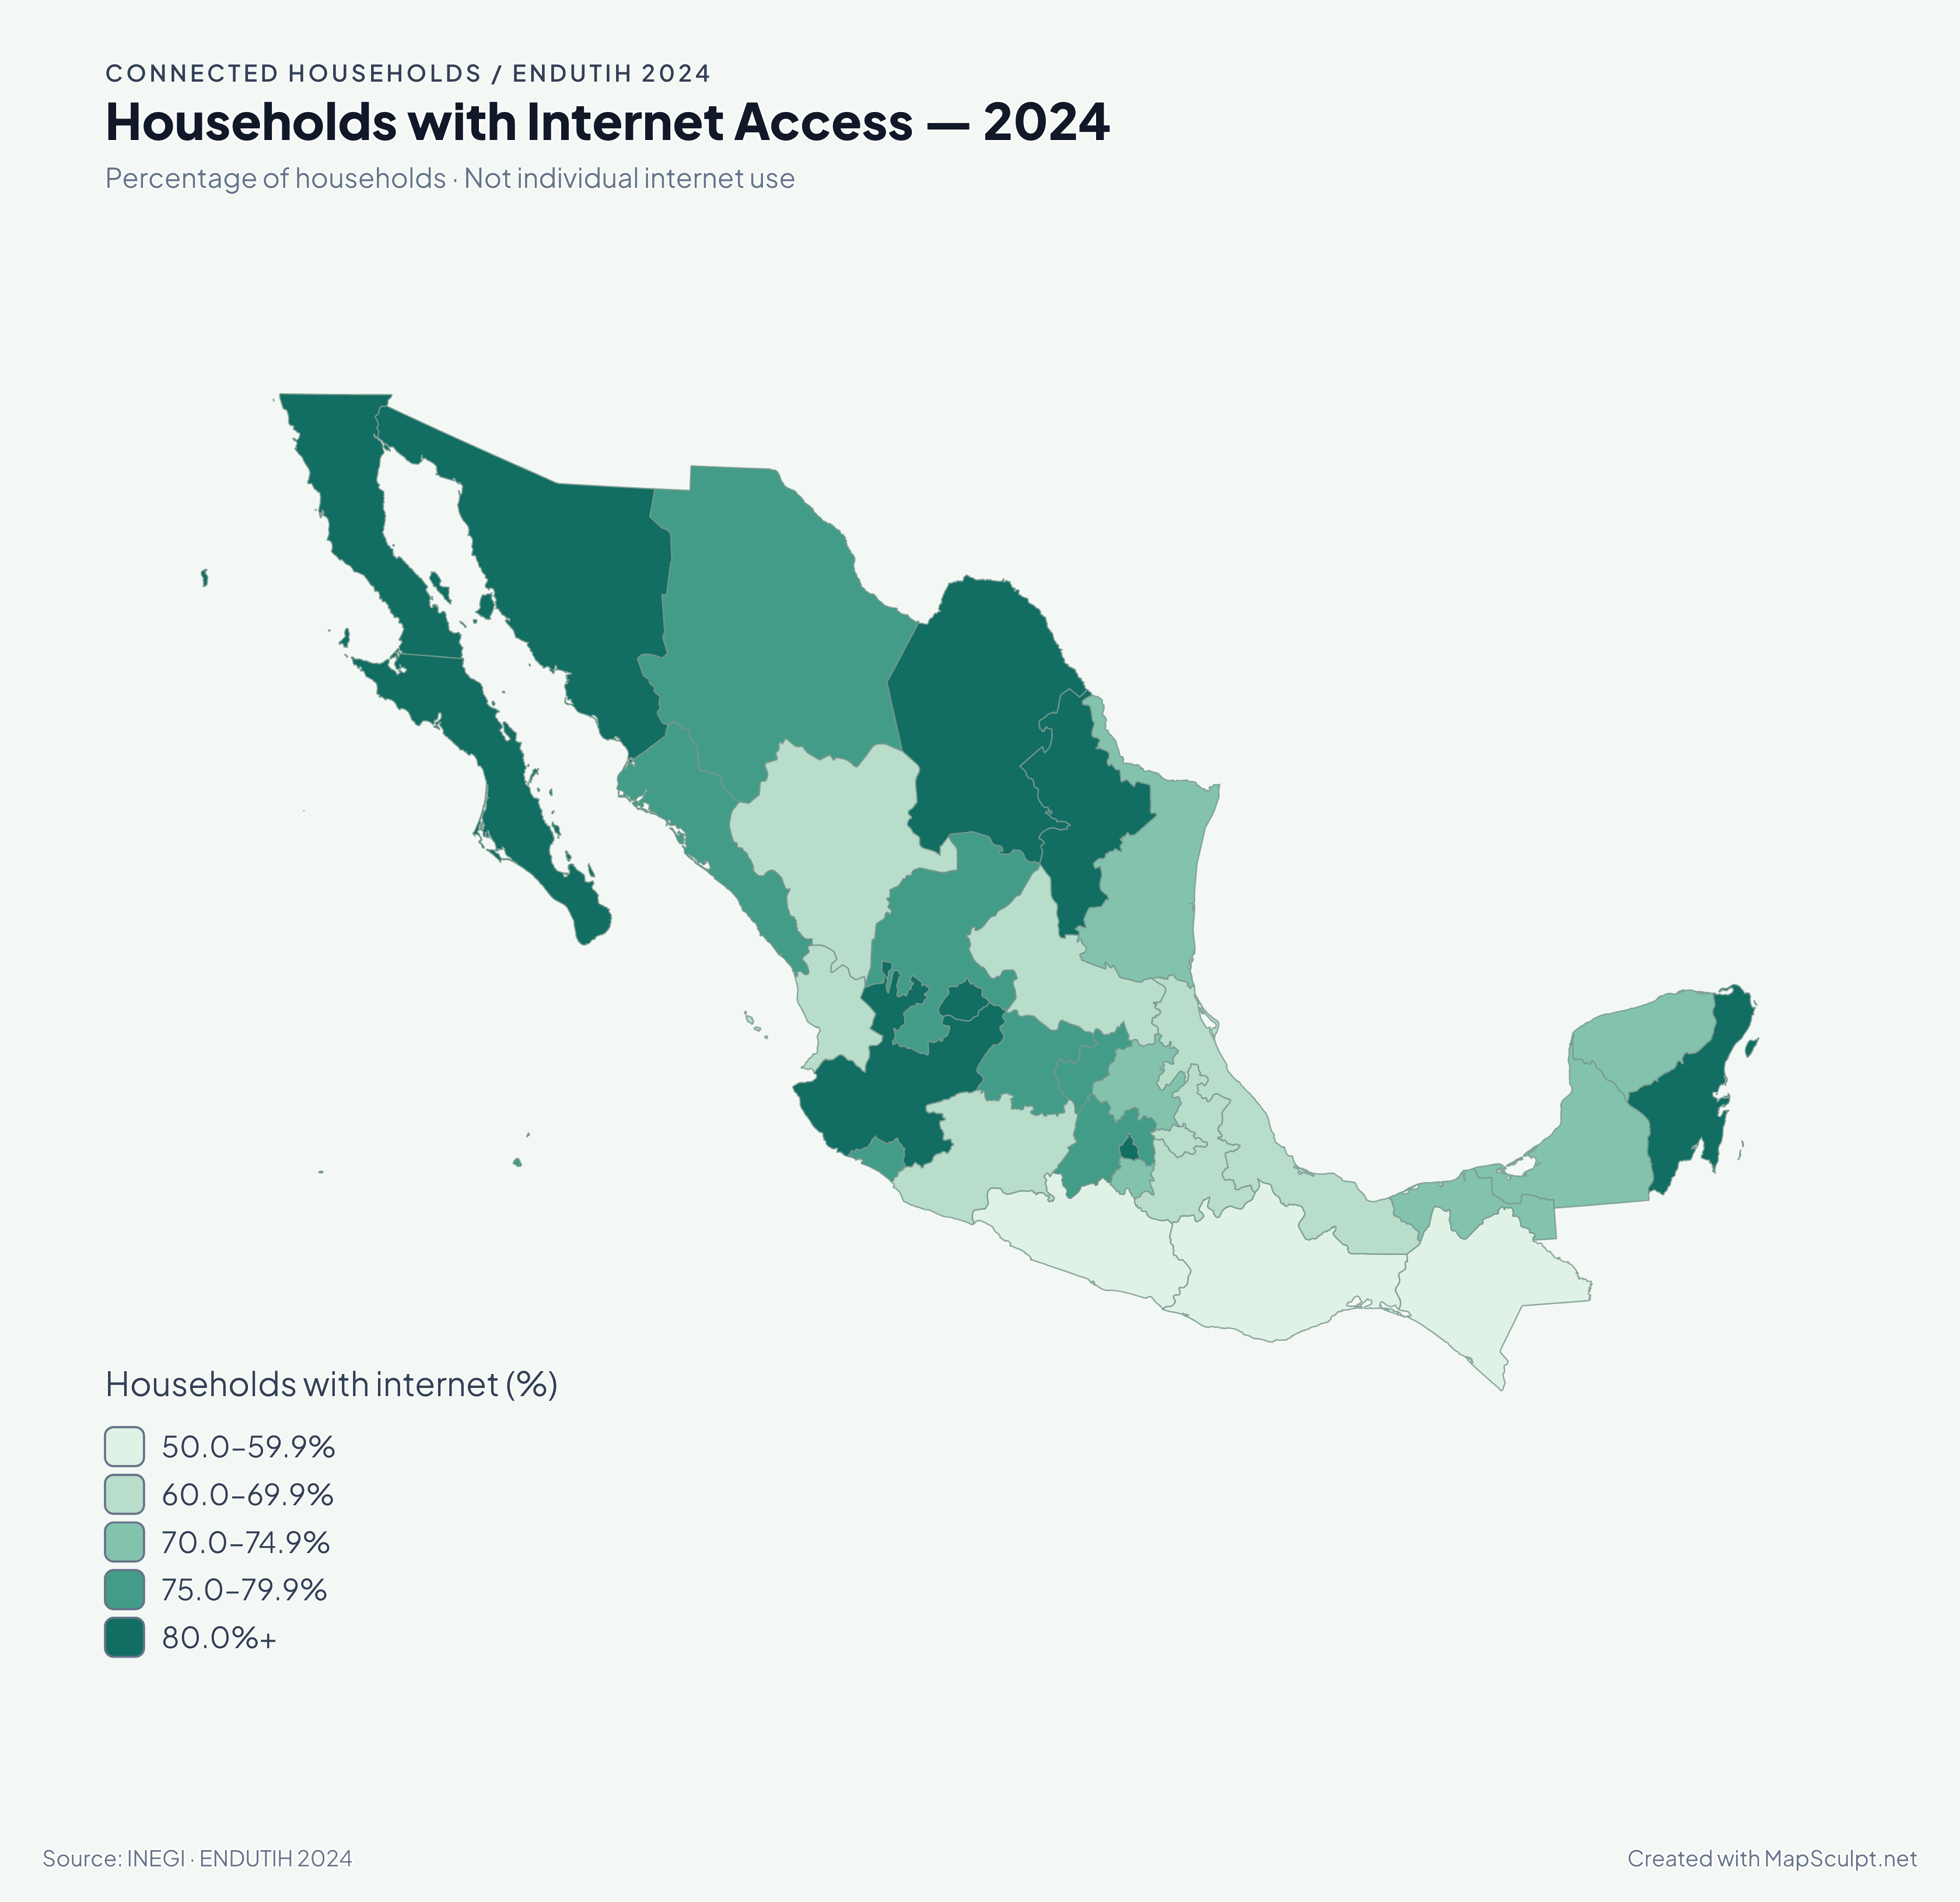
Household internet access bands: 50.0–59.9%; 60.0–69.9%; 70.0–74.9%; 75.0–79.9%; 80.0% and above. Darker teal means a larger percentage of households.
View full-size export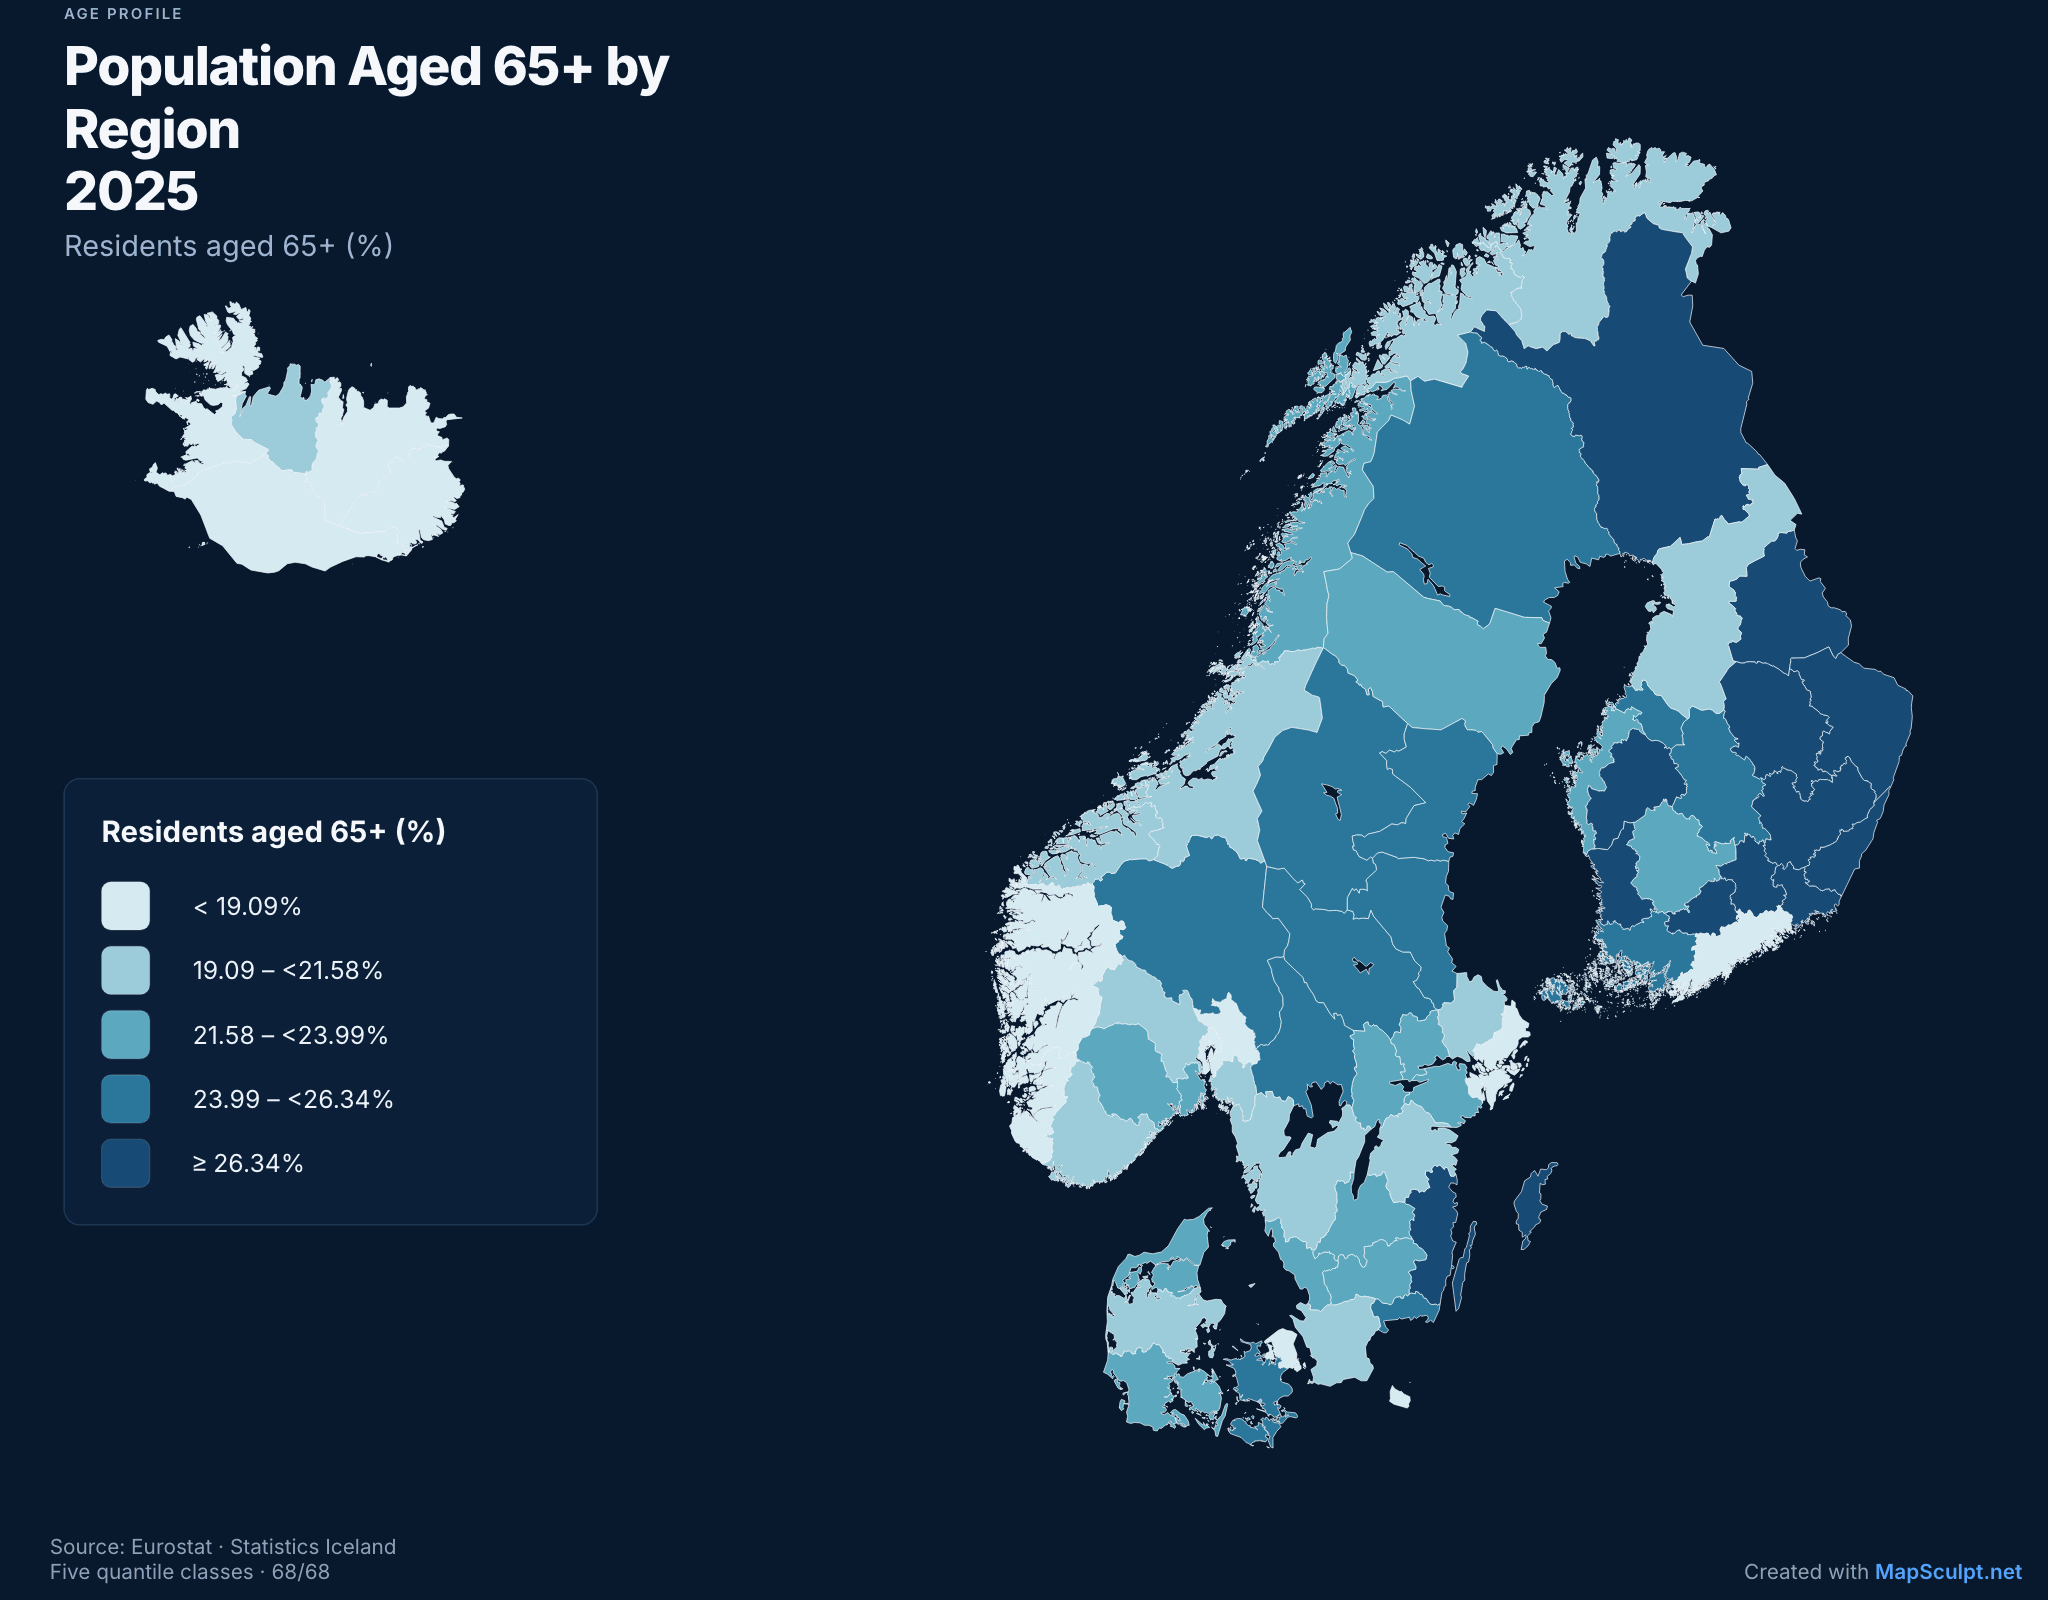
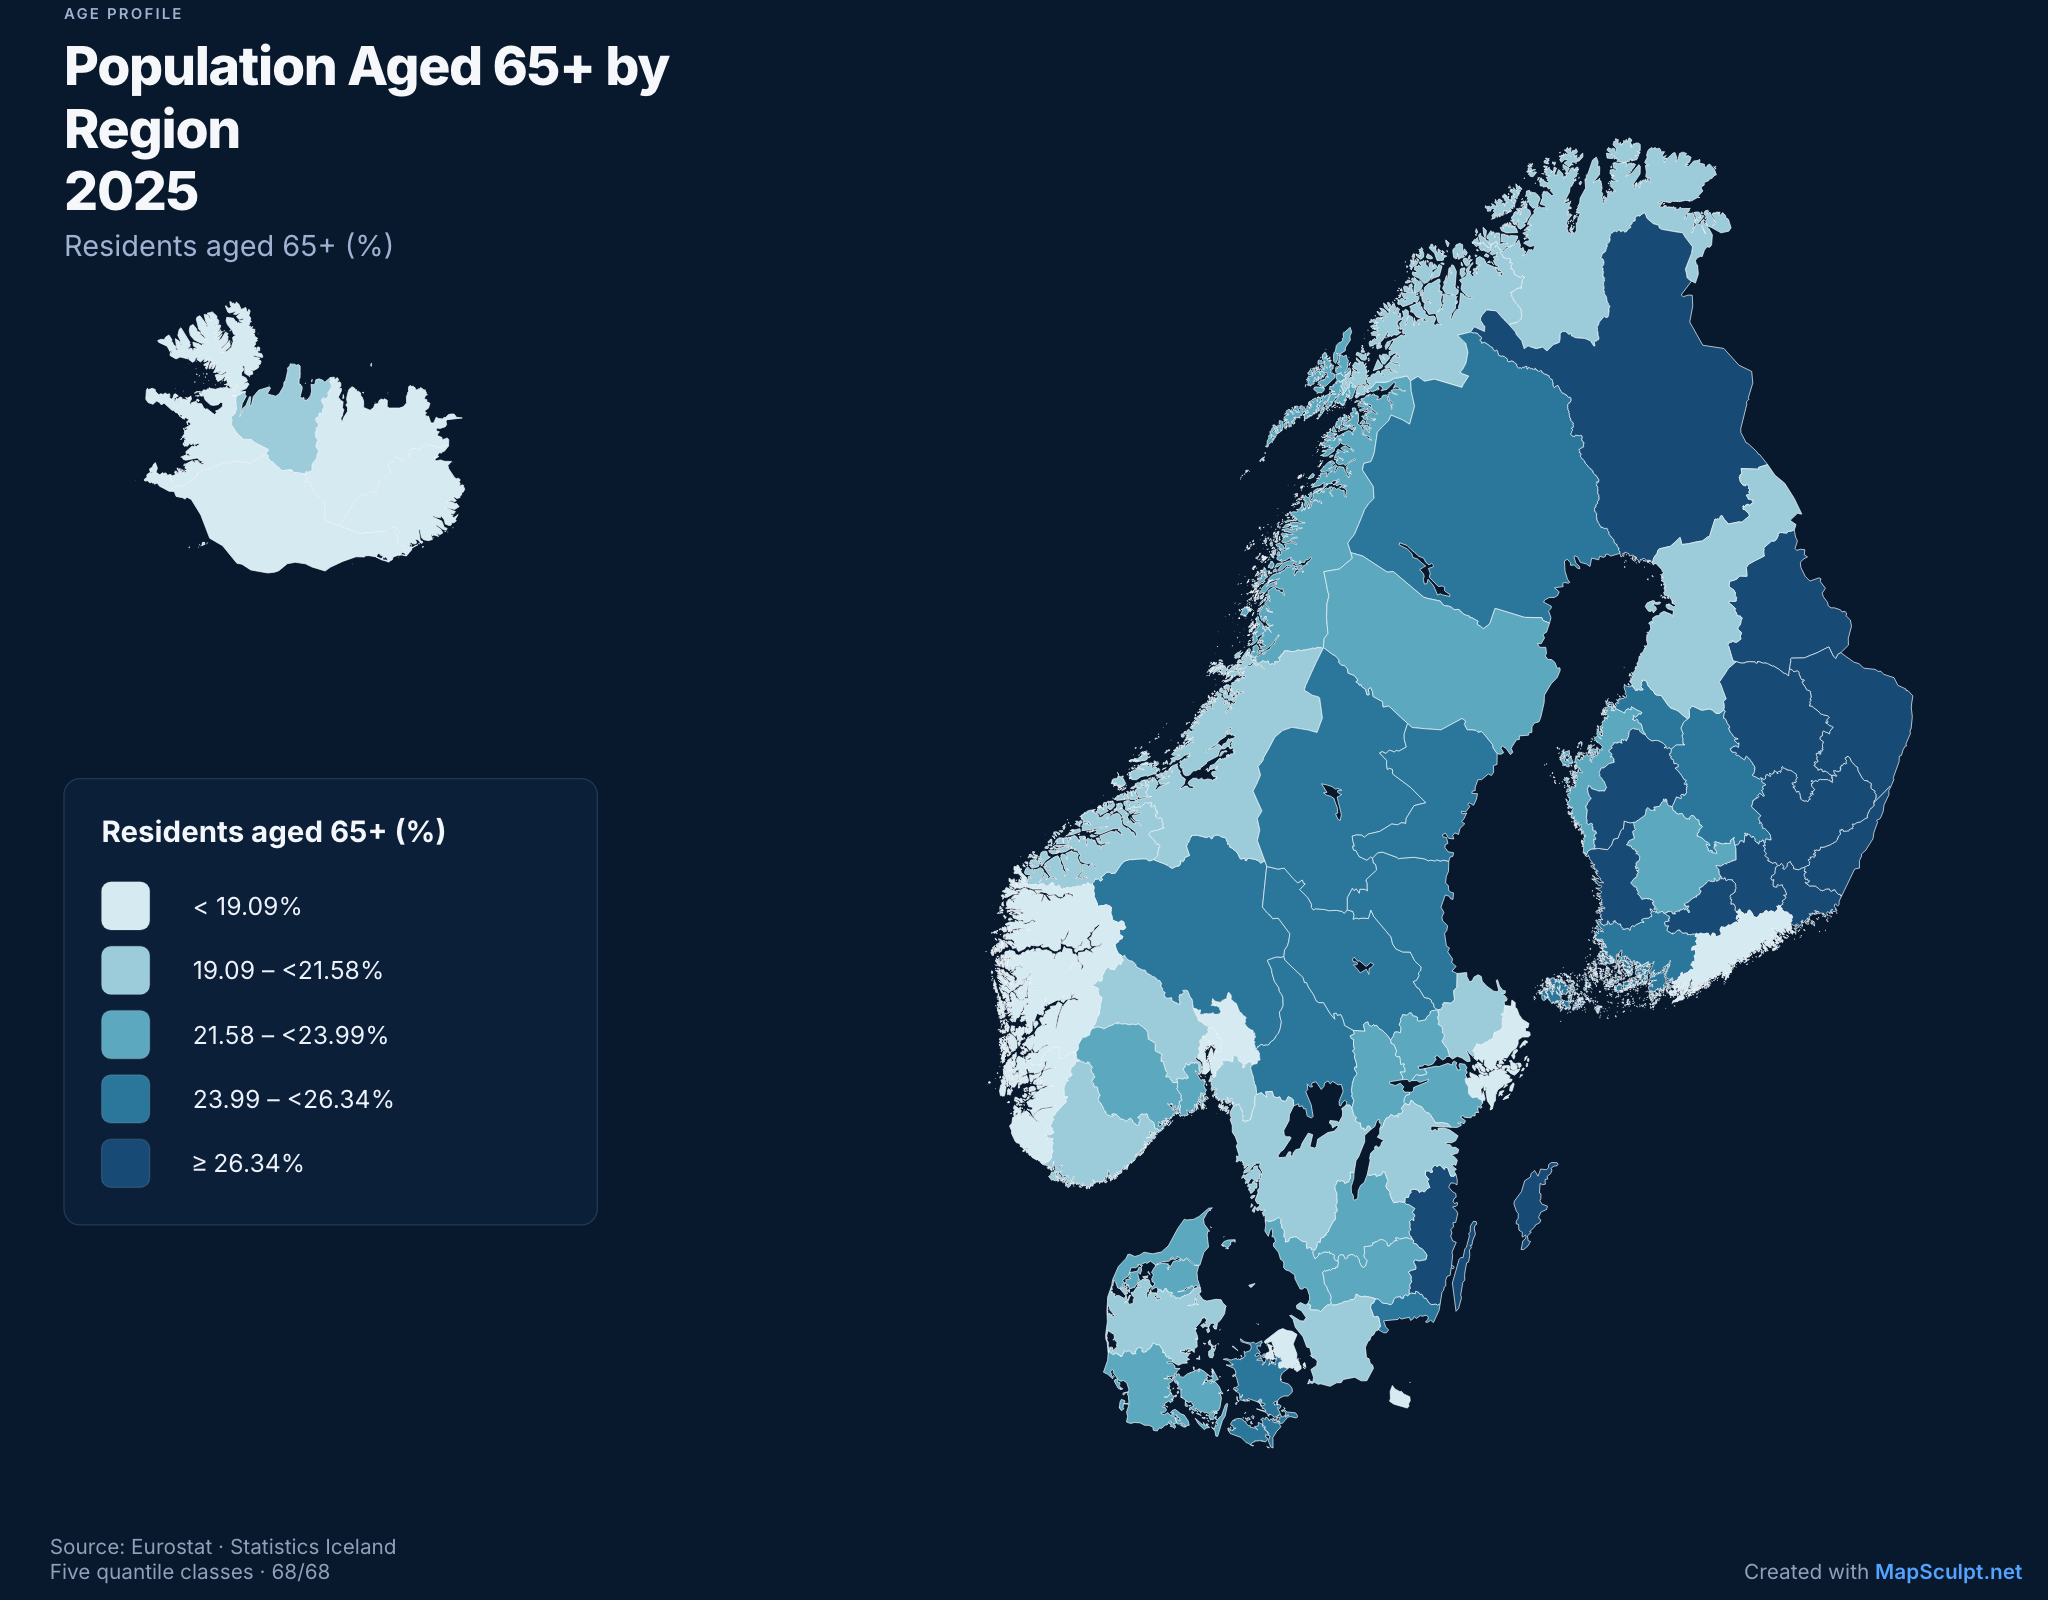
Share of residents aged 65 or over on 1 January 2025 across all 68 selectable Nordic areas. Five quantile bands.
Eurostat demo_r_pjanaggr3 · Statistics Iceland MAN03250 · 1 January 2025
03 / PRACTICAL DATA GUIDANCE
Use one header row, a region name or supported code column, and a value column. Keep one observation per region. Mexico City (MX-CMX) and the State of Mexico (MX-MEX) are distinct. The selected template determines which areas can match.
Missing is not zero. Resolve unmatched identifiers and invalid values in the import review. Use an explicit no-data treatment rather than inventing values; check the preview and coverage before applying.
Totals show scale; rates and shares support comparisons between differently sized populations. State the denominator. A percentage is a share out of 100, not a count. Compare equivalent years, units and geographic levels.
Equal intervals use ranges of equal width. Quantiles aim for similar numbers of regions; tied values stay together. Custom ranges use ordered boundaries covering every usable value. Sequential palettes suit low-to-high values; categorical colors distinguish groups rather than magnitude.
Choose Numerical to group values into ranges. Categorical treats each distinct value as its own category. Import CSV files; save Excel .xlsx and Google Sheets spreadsheets as CSV first.
Include the measure, unit, year and original dataset. These sample bands are visualization choices, not official INEGI classifications. Share original maps with source attribution and follow community rules.
Download all 32 observations. Keep RegionCode as text and Value numeric. The national average is context, not a 33rd region. To reproduce the example, set the five custom ranges above and the matching blue colors; importing a CSV alone does not recreate its editorial styling.
Download Mexico income CSV · 32 rowsCHOOSE YOUR MAP
Open an editor, then import data for that map’s actual boundaries. Examples do not preload a dataset.
32 federal entities · use the sample CSV
Open Mexico States68 selectable geographic identities
Open Nordic Regions50 states, including Alaska and Hawaii
Open US StatesCounty-level comparisons with supported GEOIDs
Open US CountiesCompare supported countries and territories
Open WorldCompare the supported European map identities
Open EuropeKEEP EXPLORING
FREQUENTLY ASKED QUESTIONS
A choropleth map uses colors or shades to show values or categories across defined geographic areas, such as countries or states.
Choose a MapSculpt geographic template, prepare your CSV, import it in the editor and customize the colors, legend and download.
Yes. Export your Excel or Google Sheets data as a CSV file, then import that CSV in MapSculpt.
Yes. MapSculpt has an existing CSV import workflow for assigning data to supported geographic areas.
Yes. Adjust categories, colors and explanatory labels to communicate your dataset clearly.
Choose from MapSculpt's supported world, continental and national or regional templates; availability varies by map.
Yes. Download a high-quality PNG with your chosen colors, legend, title and source.
Yes. You can create and download maps with the free browser-based MapSculpt editor.
Yes. Export your original map for sharing, and follow each community’s rules on sources, attribution and submissions.
YOUR NEXT MAP STARTS HERE
Choose a geography. Review your matches. Make the pattern visible.