Skip to content
MapSculpt

GEOGRAPHIC MAP MAKER / NEW JERSEY

New Jersey
Counties Map Maker

Compare household income and renter costs from the New York–facing counties to the Delaware River and the Jersey Shore, then put your data on a map of all 21 counties.

Free online editor · No sign-up required

21counties
individually editable

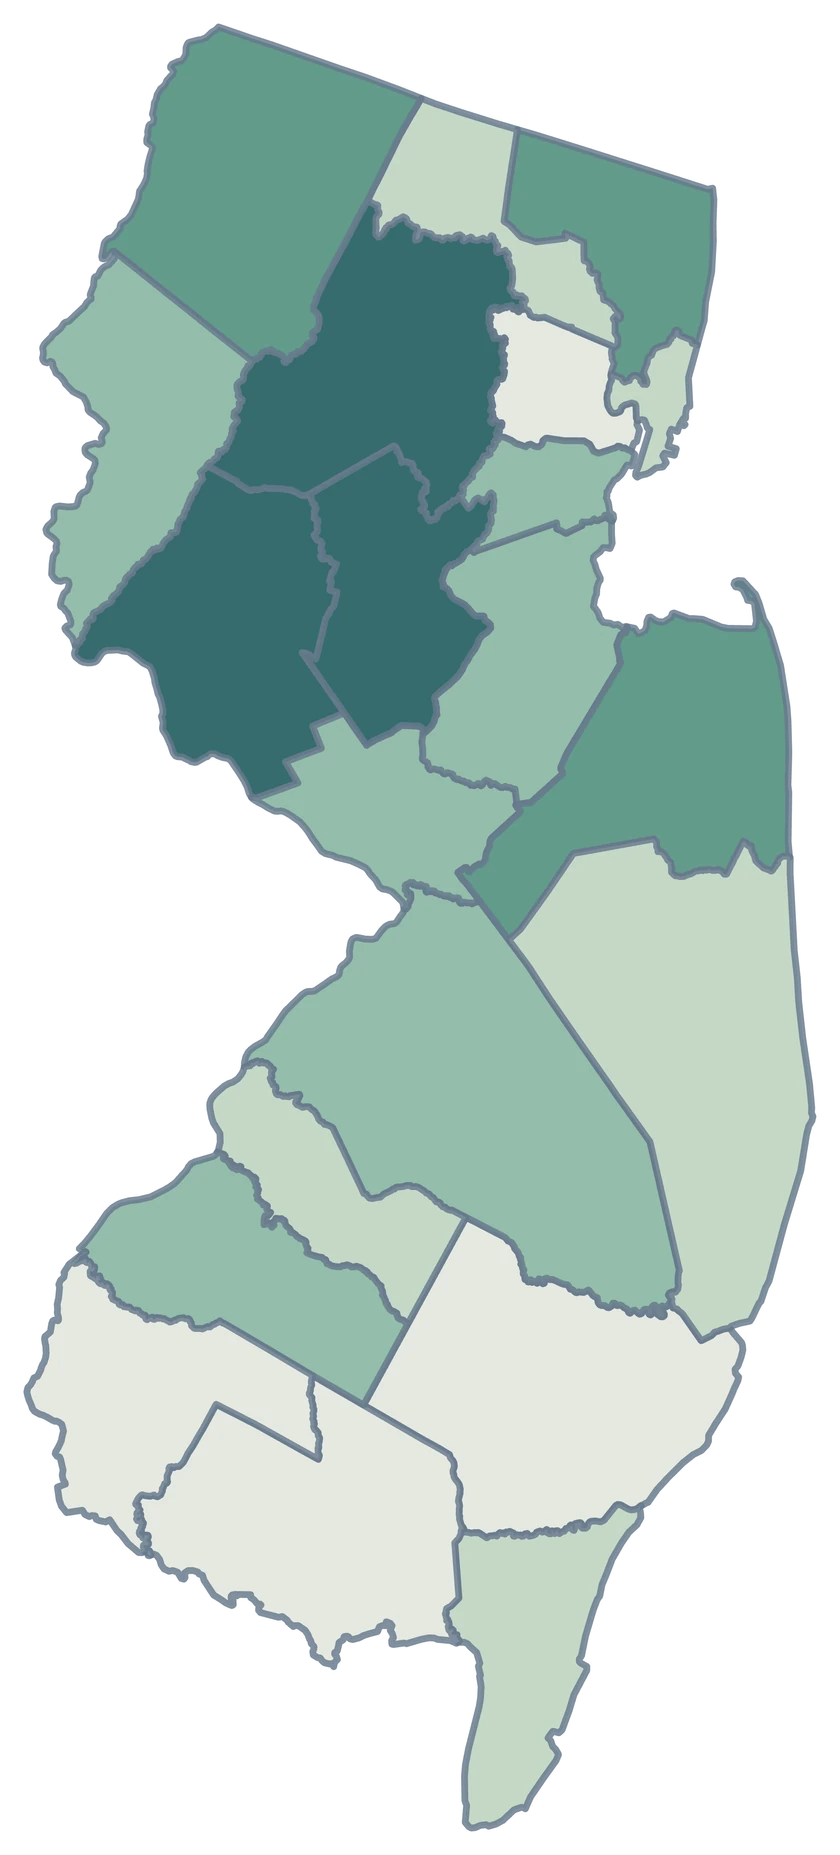
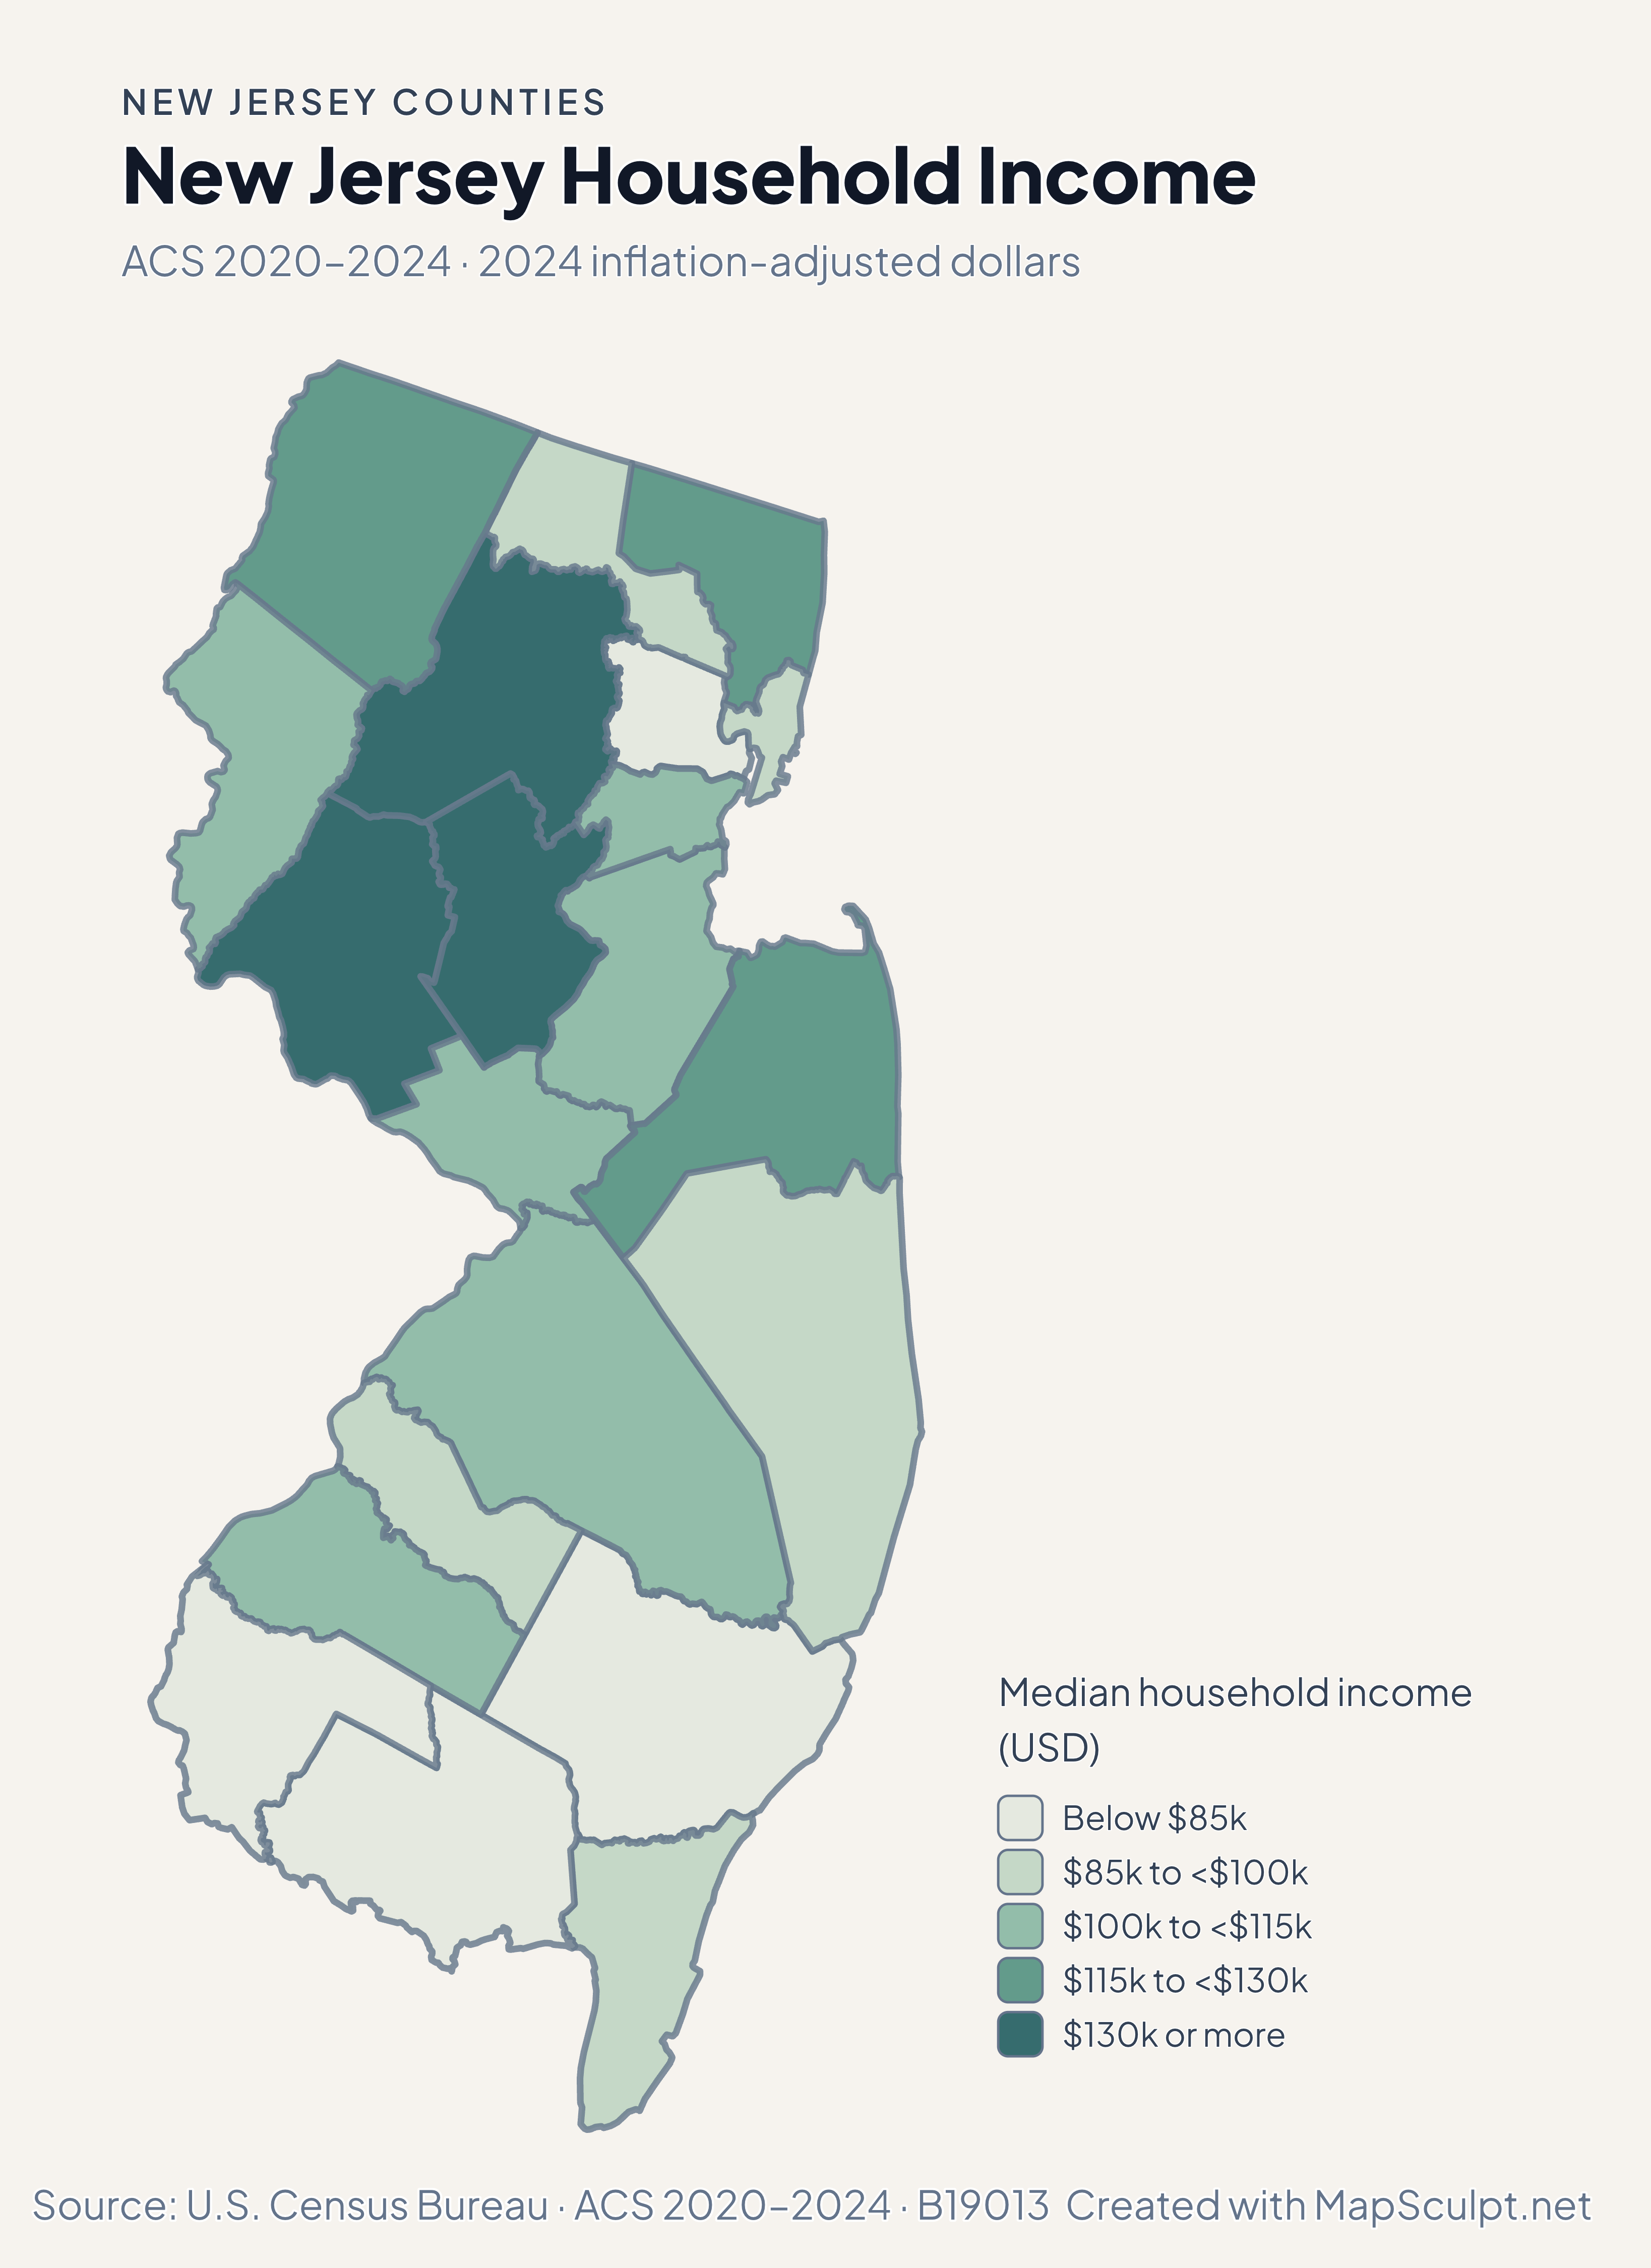
New Jersey Household Income

ACS 2020–2024 · 2024 inflation-adjusted dollars

New Jersey county median household income, with Hunterdon in the darkest green band and Cumberland in the lightest.

Median household income (USD)

  • Below $85k
  • $85k to <$100k
  • $100k to <$115k
  • $115k to <$130k
  • $130k or more
U.S. Census Bureau · ACS 2020–2024 · B19013Download complete PNG The ACS estimates median household income in inflation-adjusted 2024 dollars.

KNOW YOUR GEOGRAPHY

A compact state with distinct county geographies.

New Jersey’s counties follow the Hudson and Delaware river corridors and the Atlantic coast. The statewide view retains the coastal outline of the 2025 Census cartographic source.

City names can indicate a smaller geography. Newark is within Essex County and Jersey City is within Hudson County. For consistent comparisons, join county data using the statewide directory.

Browse all county GEOIDs ↗

2025 Census boundaries

OFFICIAL DATA

Income and renter costs across New Jersey.

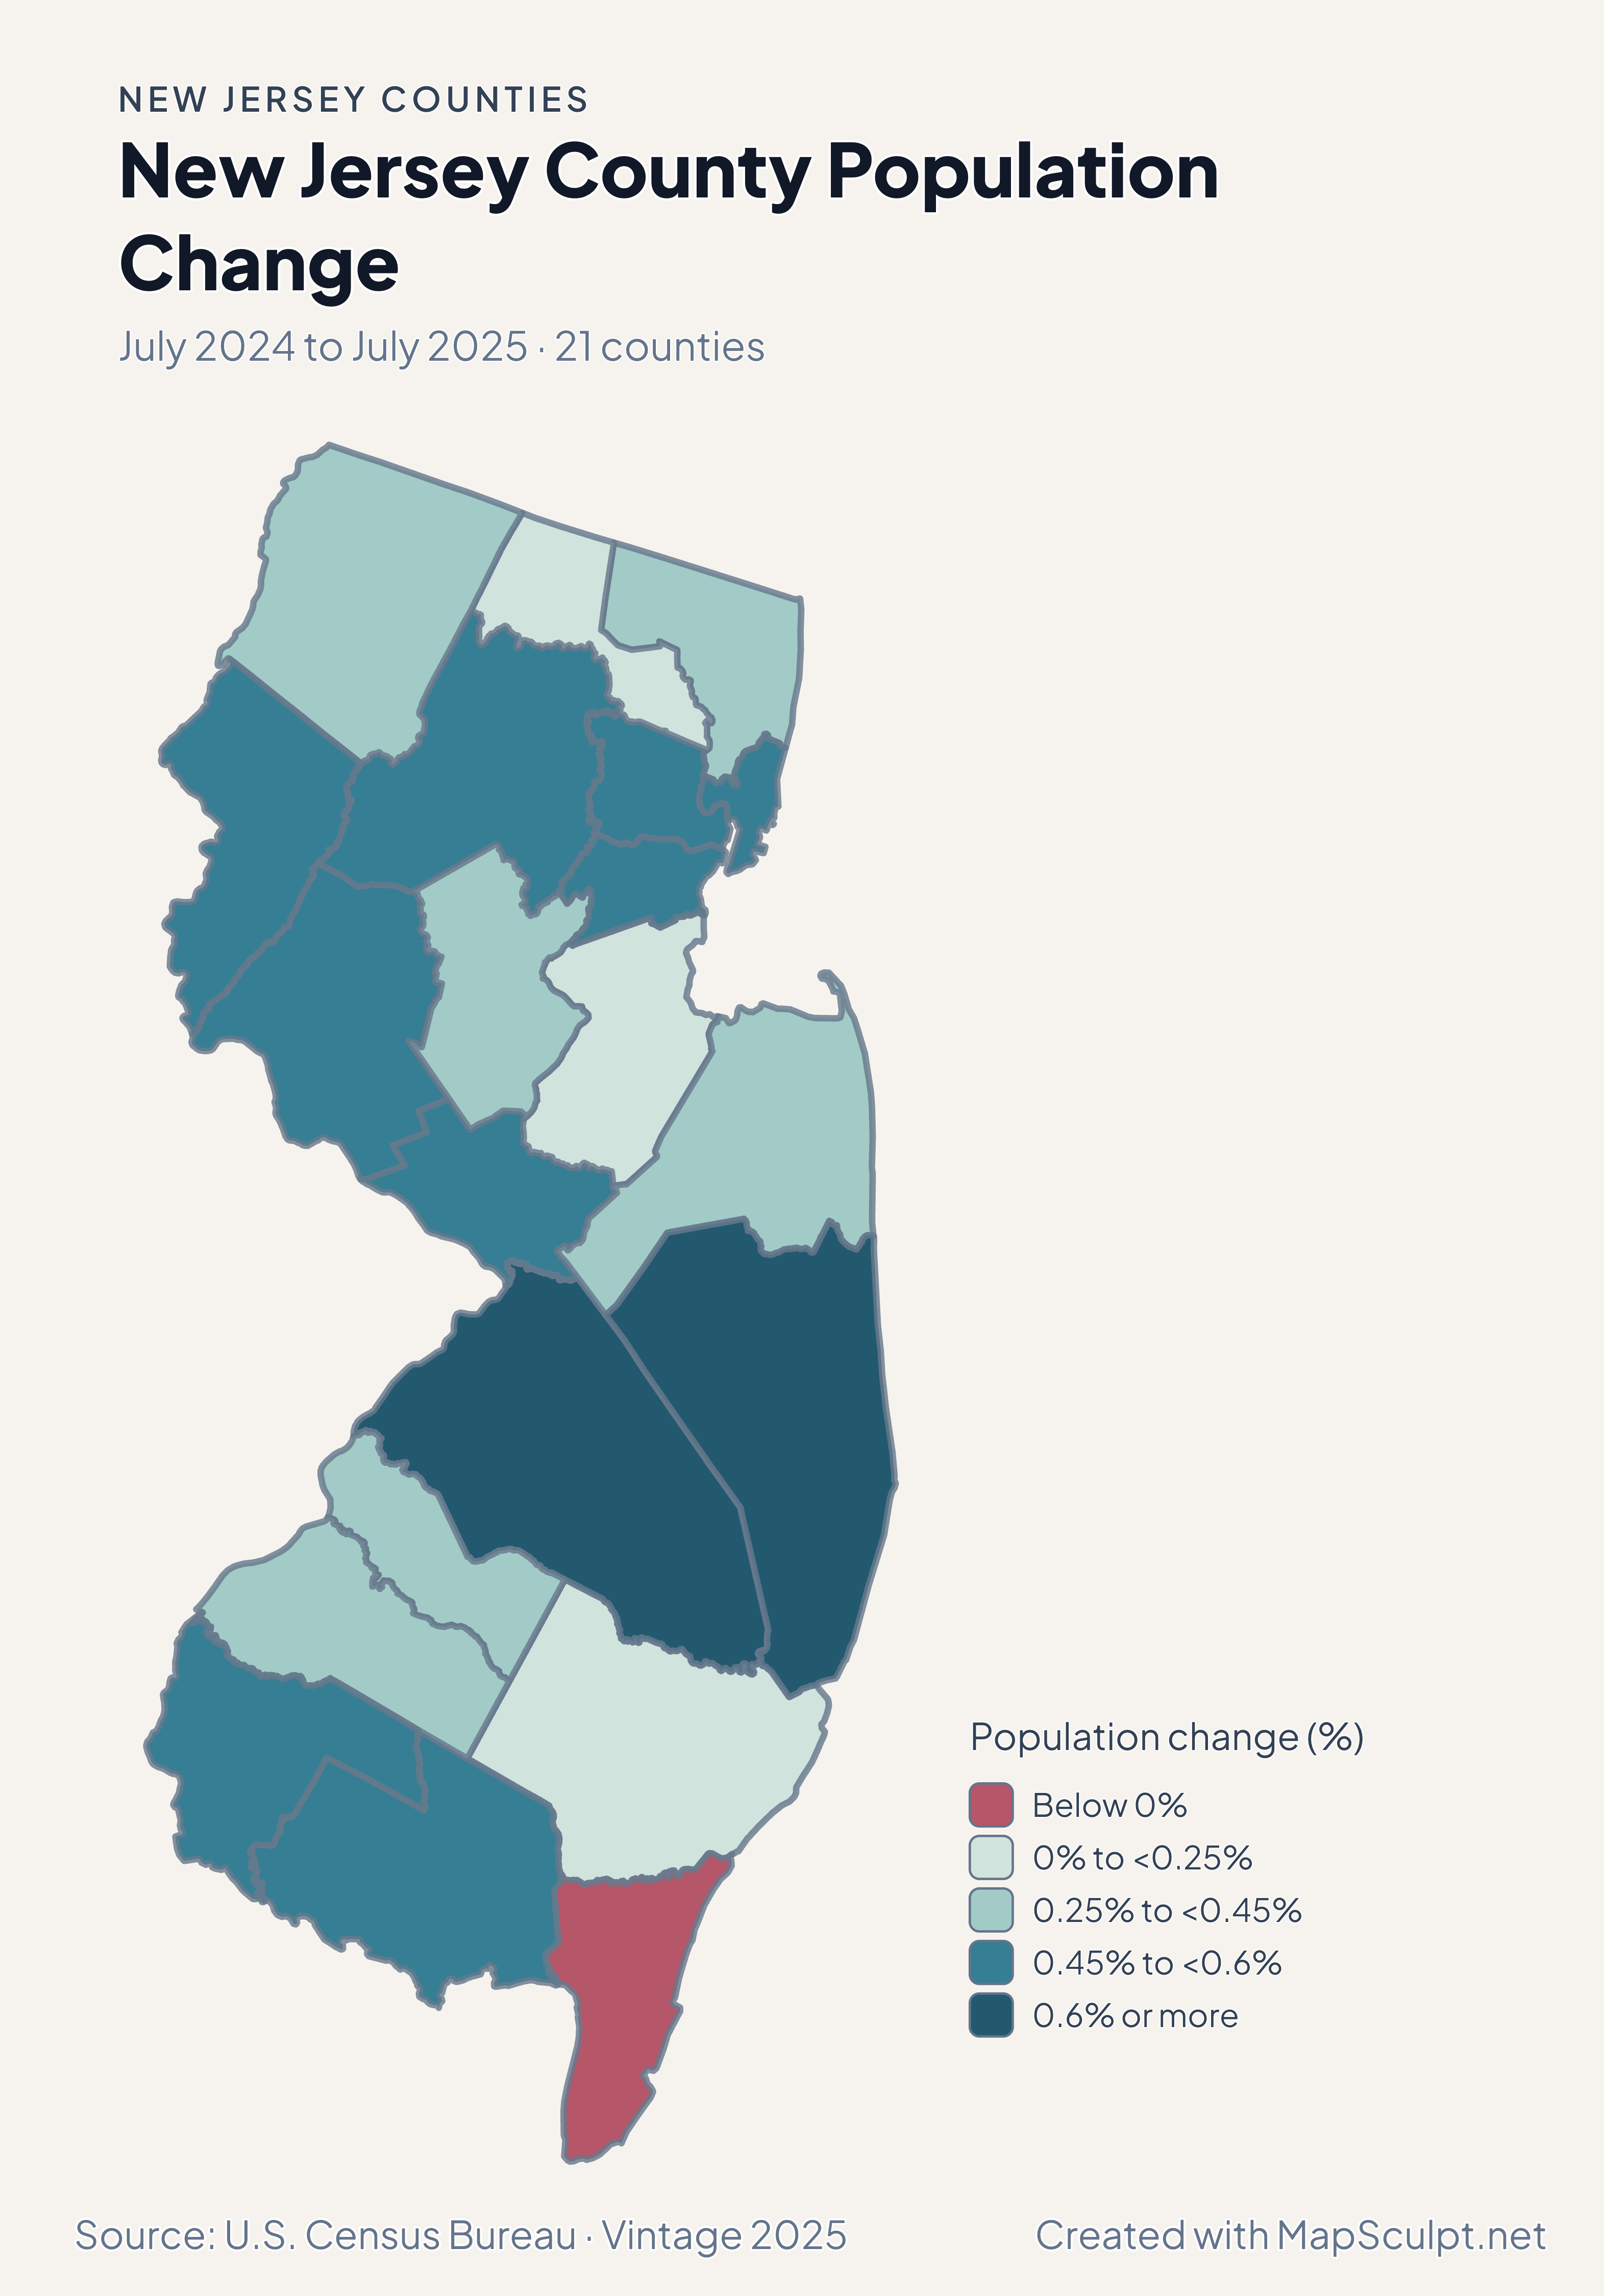
Compare July 2024–July 2025 population estimates with five-year ACS survey estimates for 2020–2024. Each map identifies its own period and units.

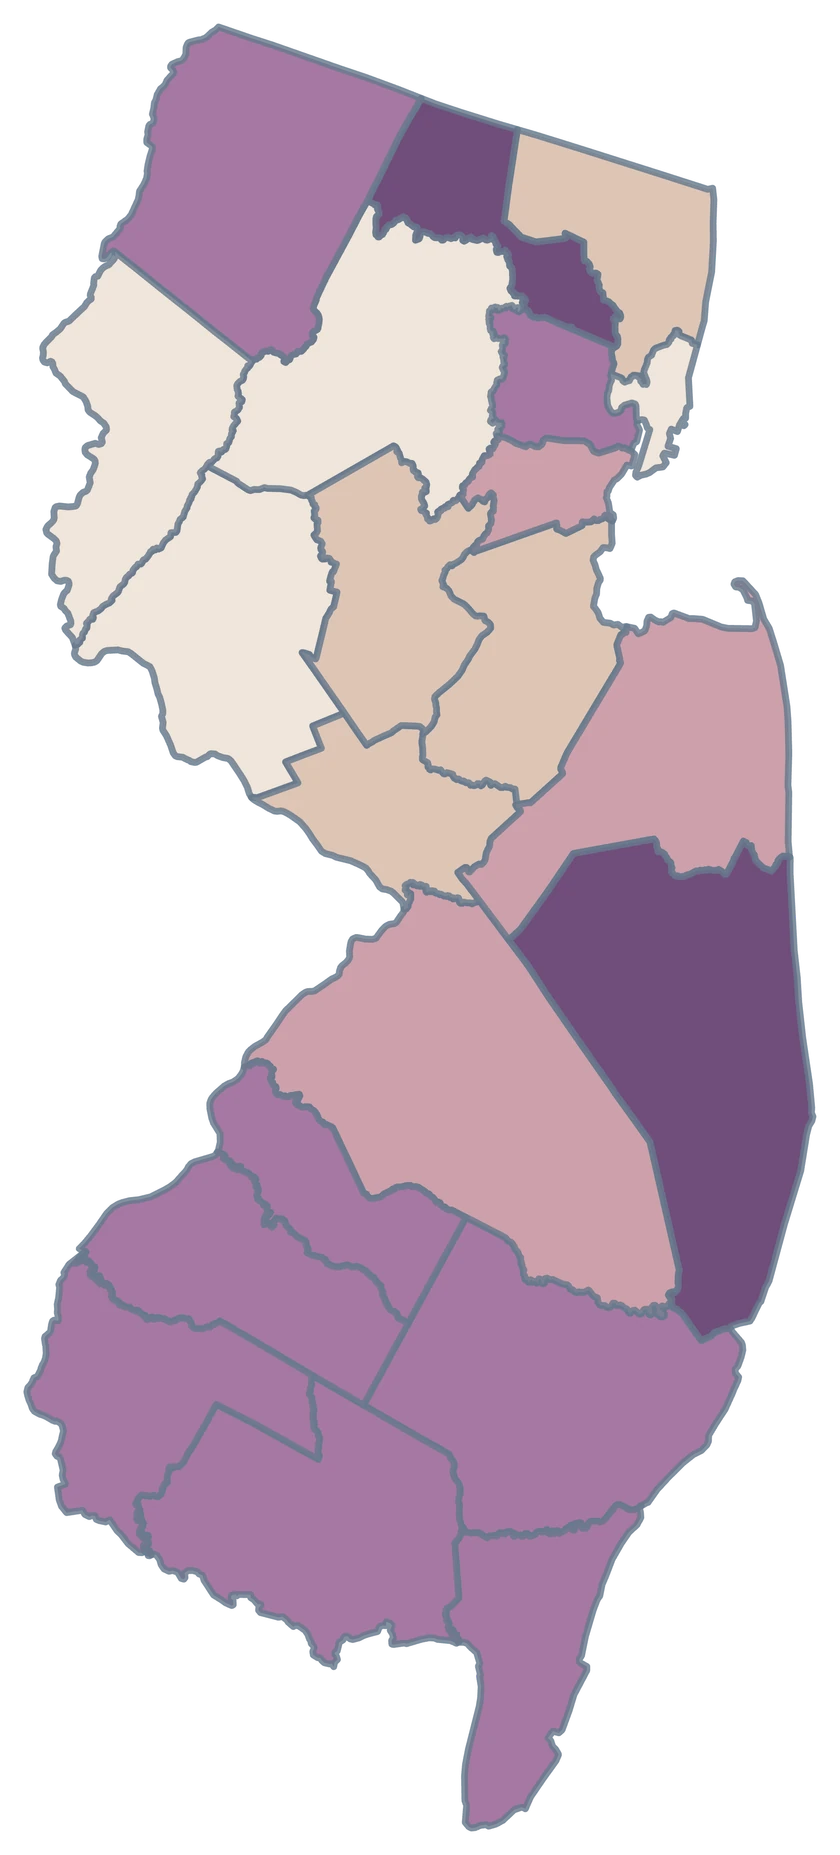
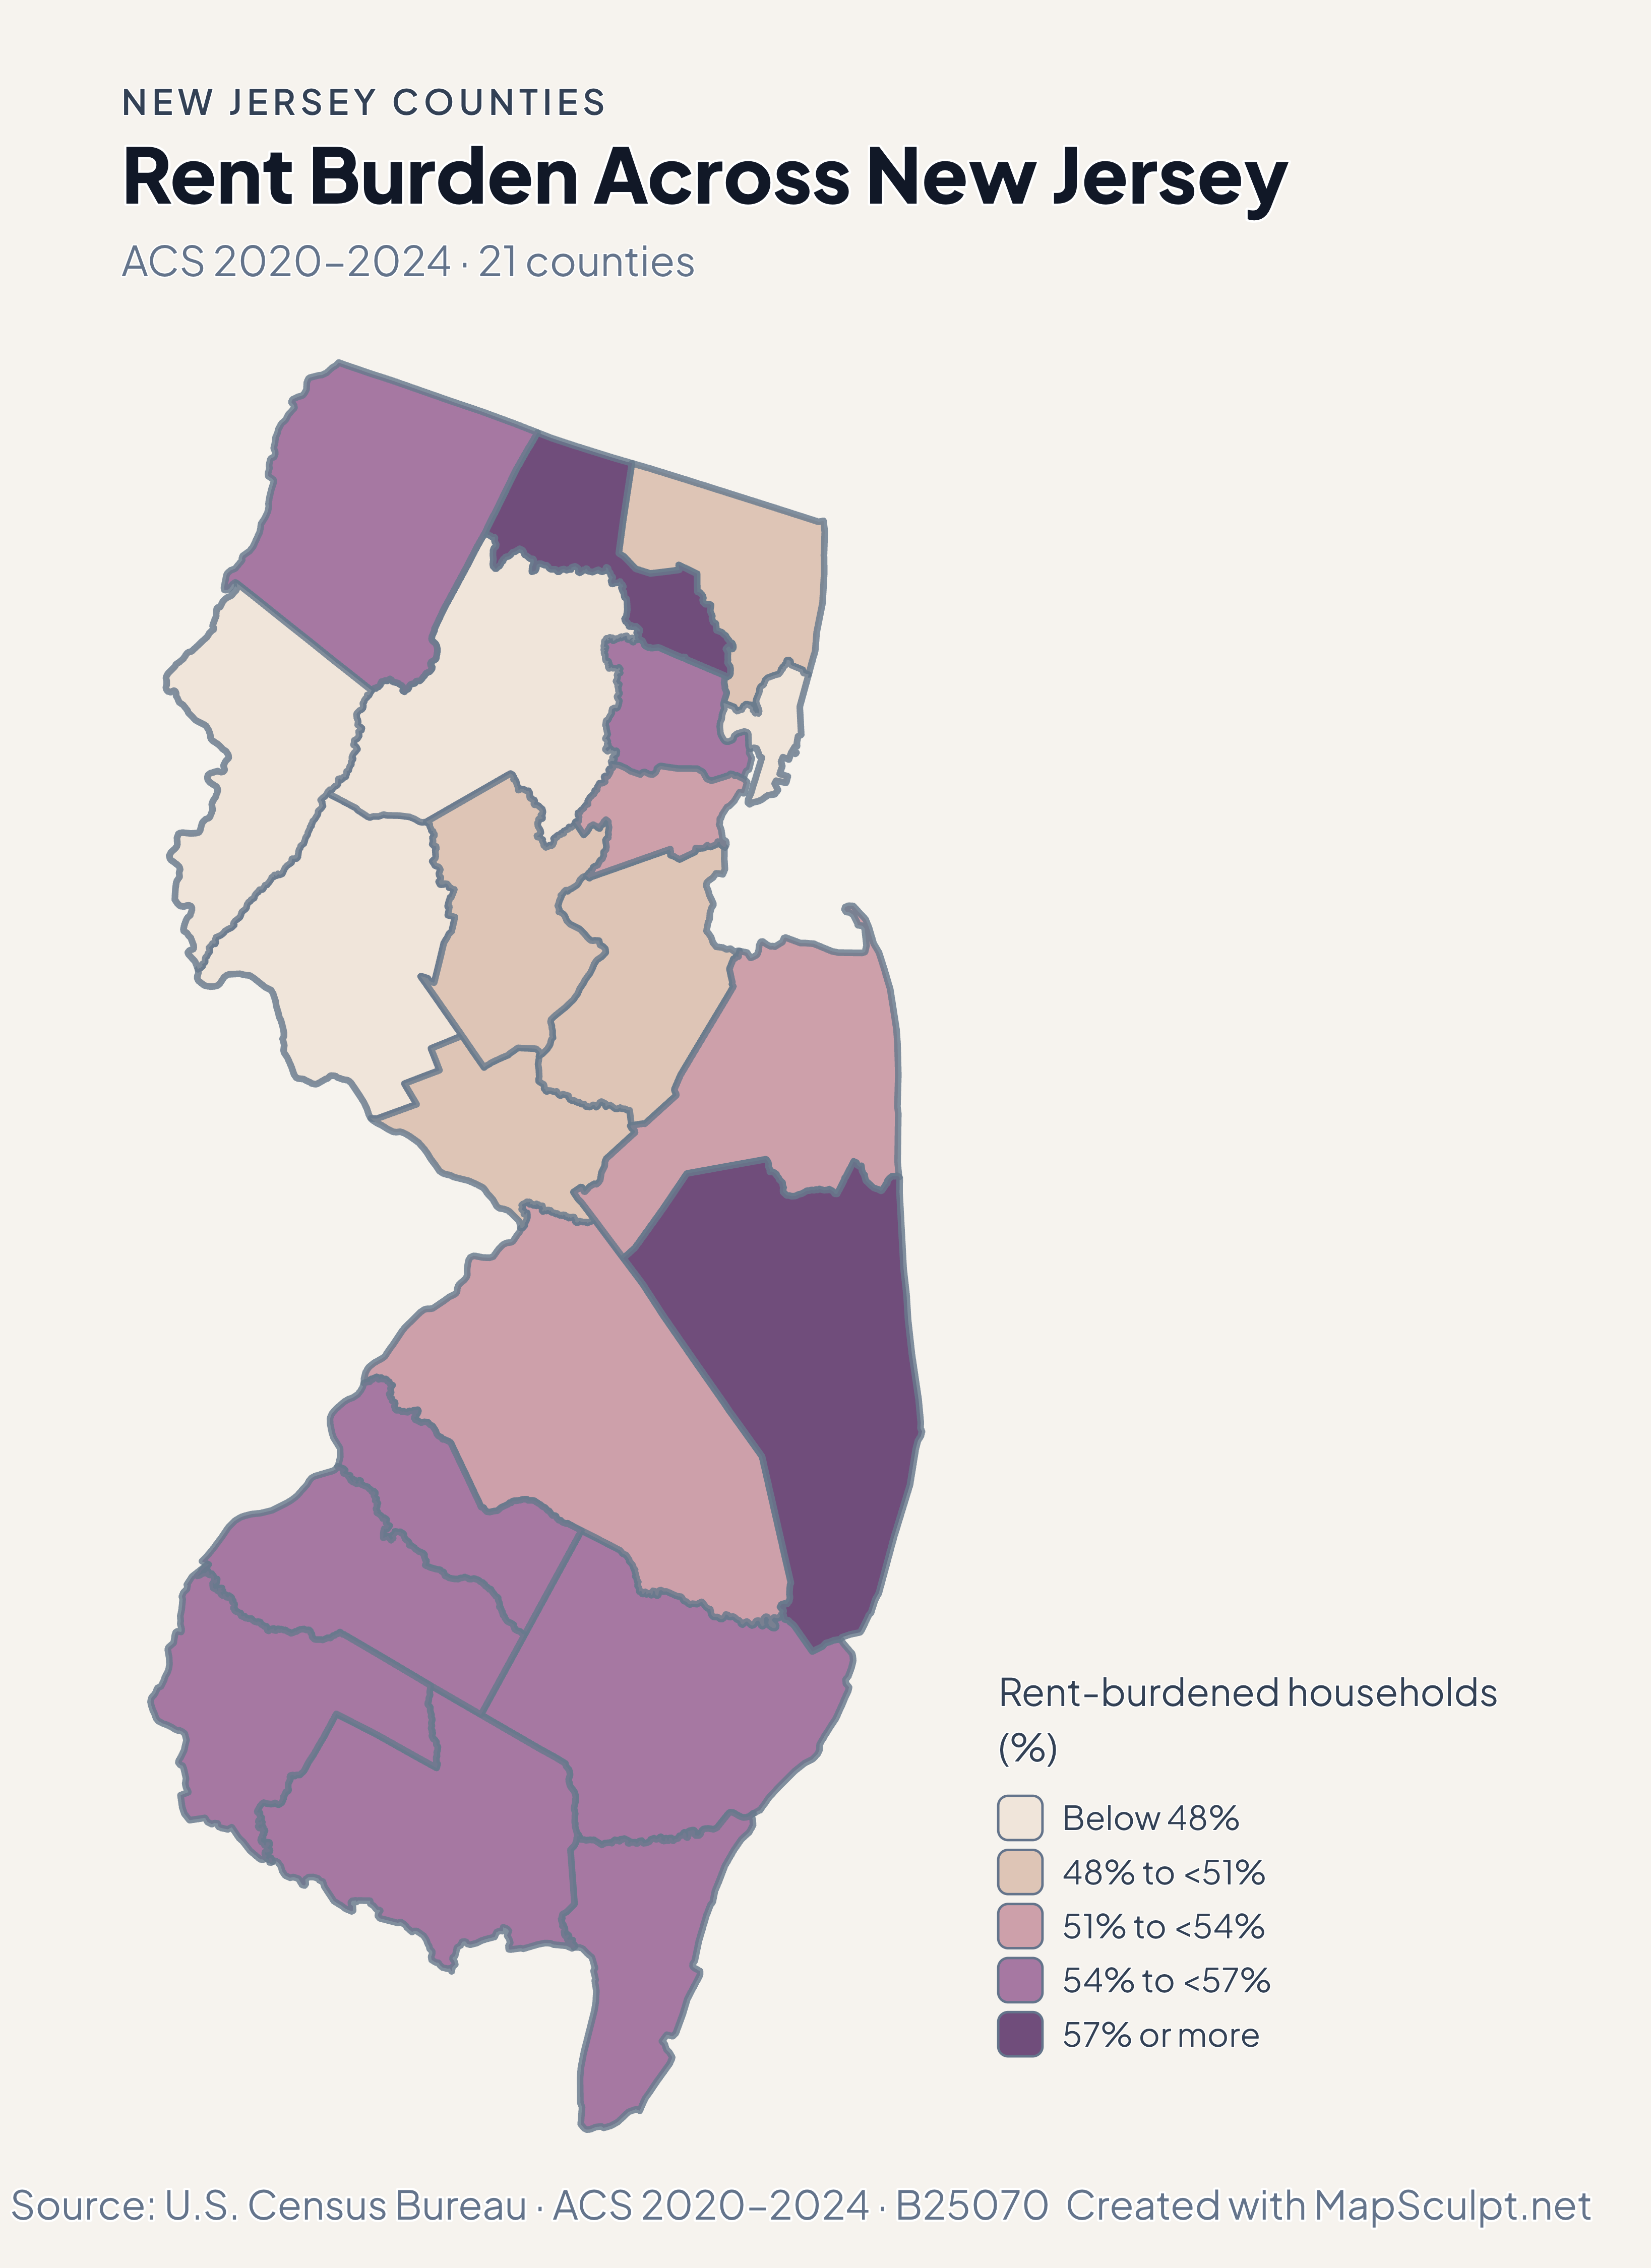
New Jersey county rent burden, with Ocean in a darker purple band than Hudson.

ACS 2020–2024 · 21 counties

Renter costs do not mirror the household income map.

Ocean’s estimated rent-burden share was 58.3%, while Hudson’s was 46.4%. The measure covers renter households with a computable gross-rent-to-income ratio and should be read with ACS uncertainty in mind.

Rent-burdened households (%)

  • Below 48%
  • 48% to <51%
  • 51% to <54%
  • 54% to <57%
  • 57% or more

U.S. Census Bureau · ACS 2020–2024 · B25070

Download complete PNG

Hunterdon’s median household income estimate was $141,715. Cumberland’s was $67,436. County medians combine many communities and do not describe individual earnings. See the Census estimates ↗

MAKE IT YOURS

From county data to a finished map.

  1. Open the New Jersey editor

    Start with all 21 selectable counties.

  2. Match your county records

    Use a five-digit GEOID such as 34003 for Bergen County. Review the match list before applying the data.

  3. Choose classes and colors

    Use bands that make the units and direction of change easy to read.

  4. Export with context

    Keep the source, period and legend visible in your full-resolution PNG.

TRY CSV IMPORT

Try six New Jersey records.

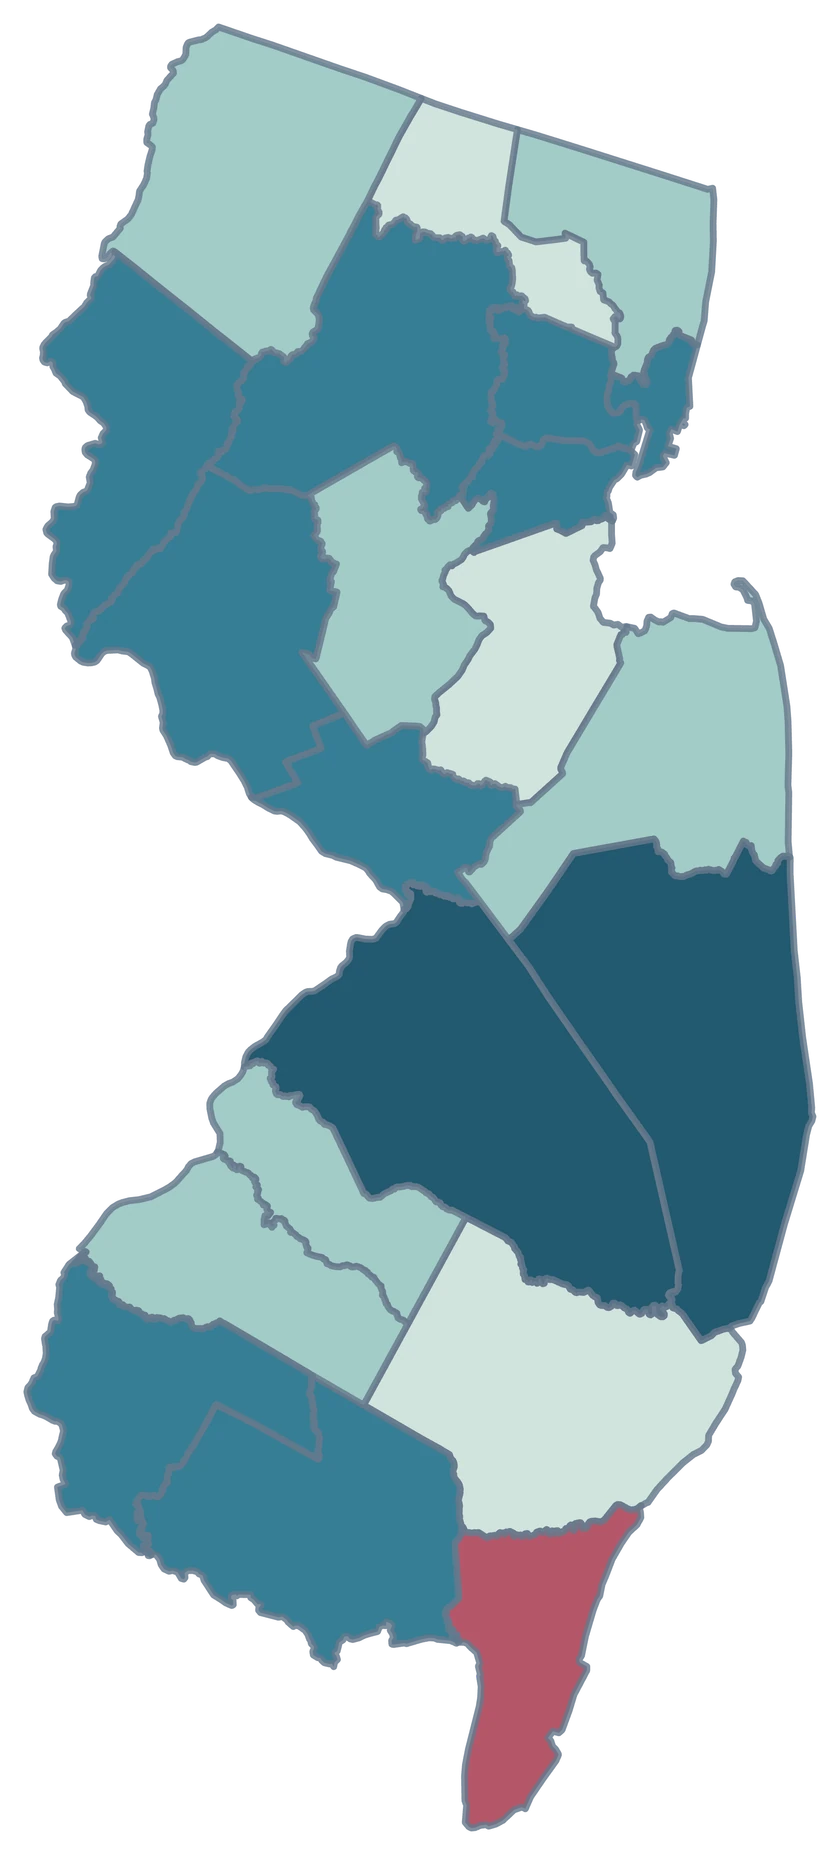
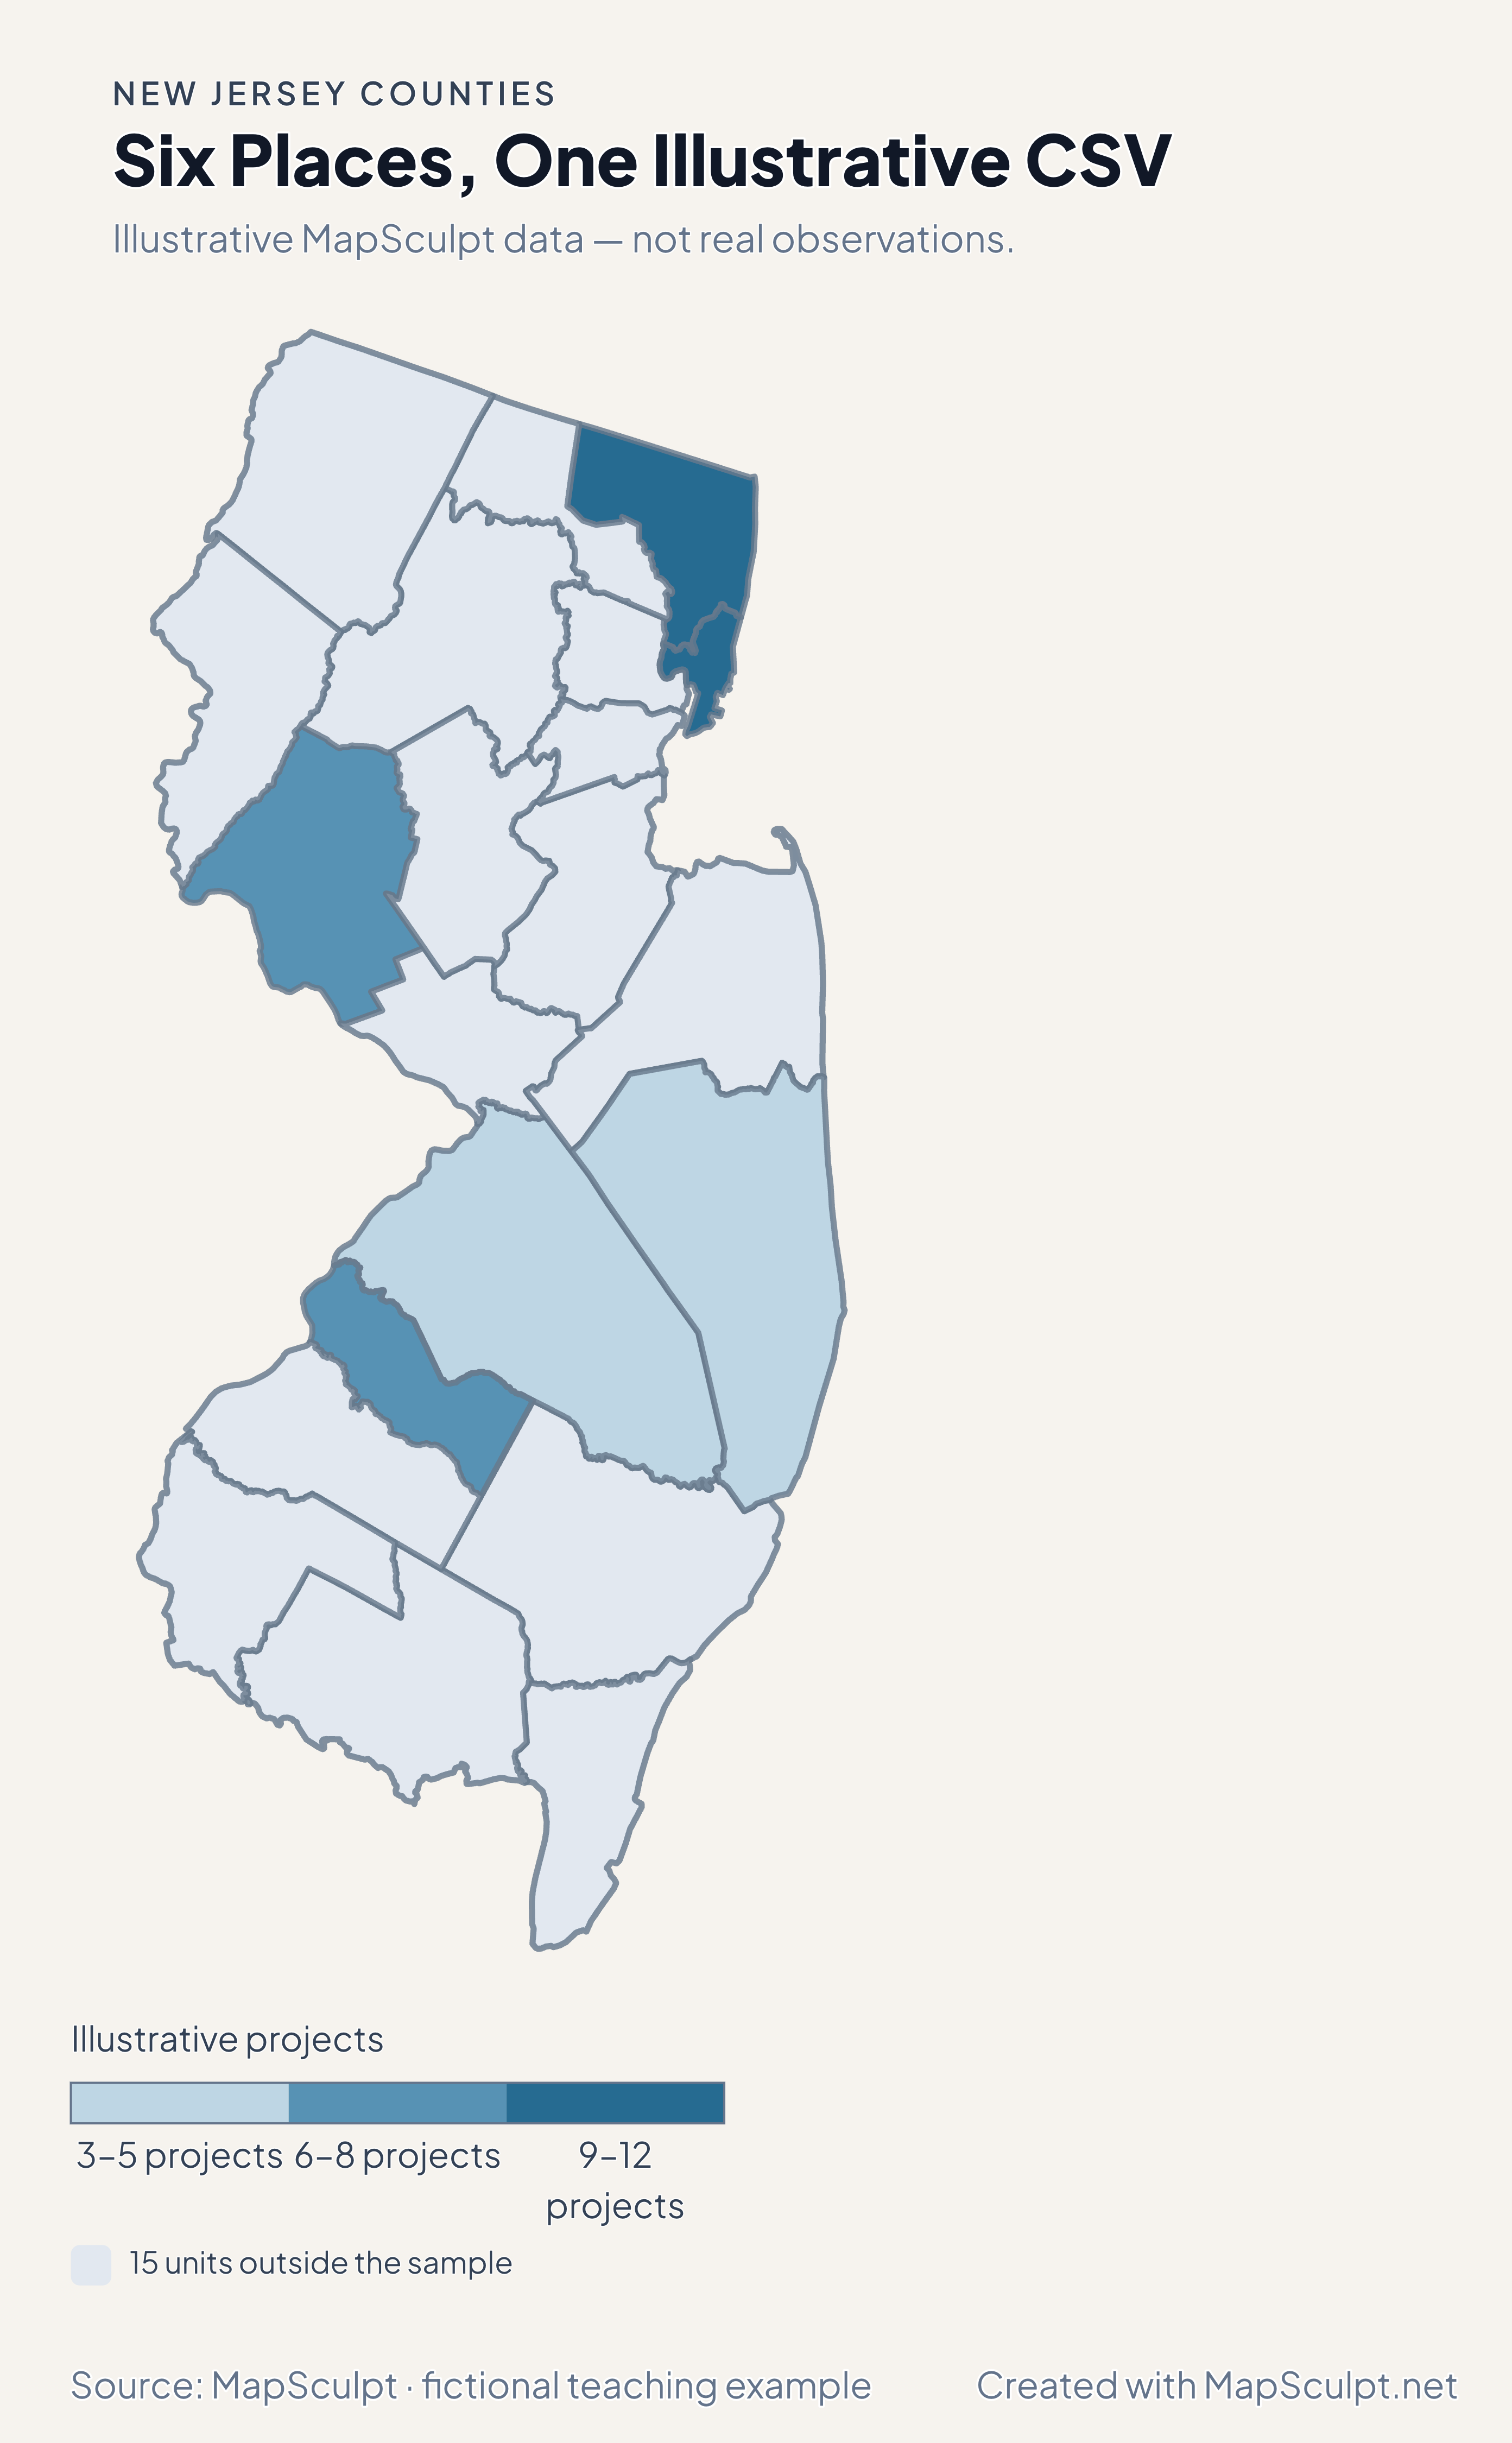
Import the fictional file, select IllustrativeProjects and use custom boundaries of 3, 6, 9 and 12. The remaining 15 units stay neutral.

Illustrative MapSculpt data — not real observations.
CountyGEOIDProjects
Bergen County3400312
Hudson County340179
Hunterdon County340197
Burlington County340053
Camden County340078
Ocean County340295

Keep IDs as text. The sample uses 34003 for Bergen County and 34017 for Hudson County.

Download illustrative CSV ↓

Six Places, One Illustrative CSV

Illustrative MapSculpt data — not real observations.

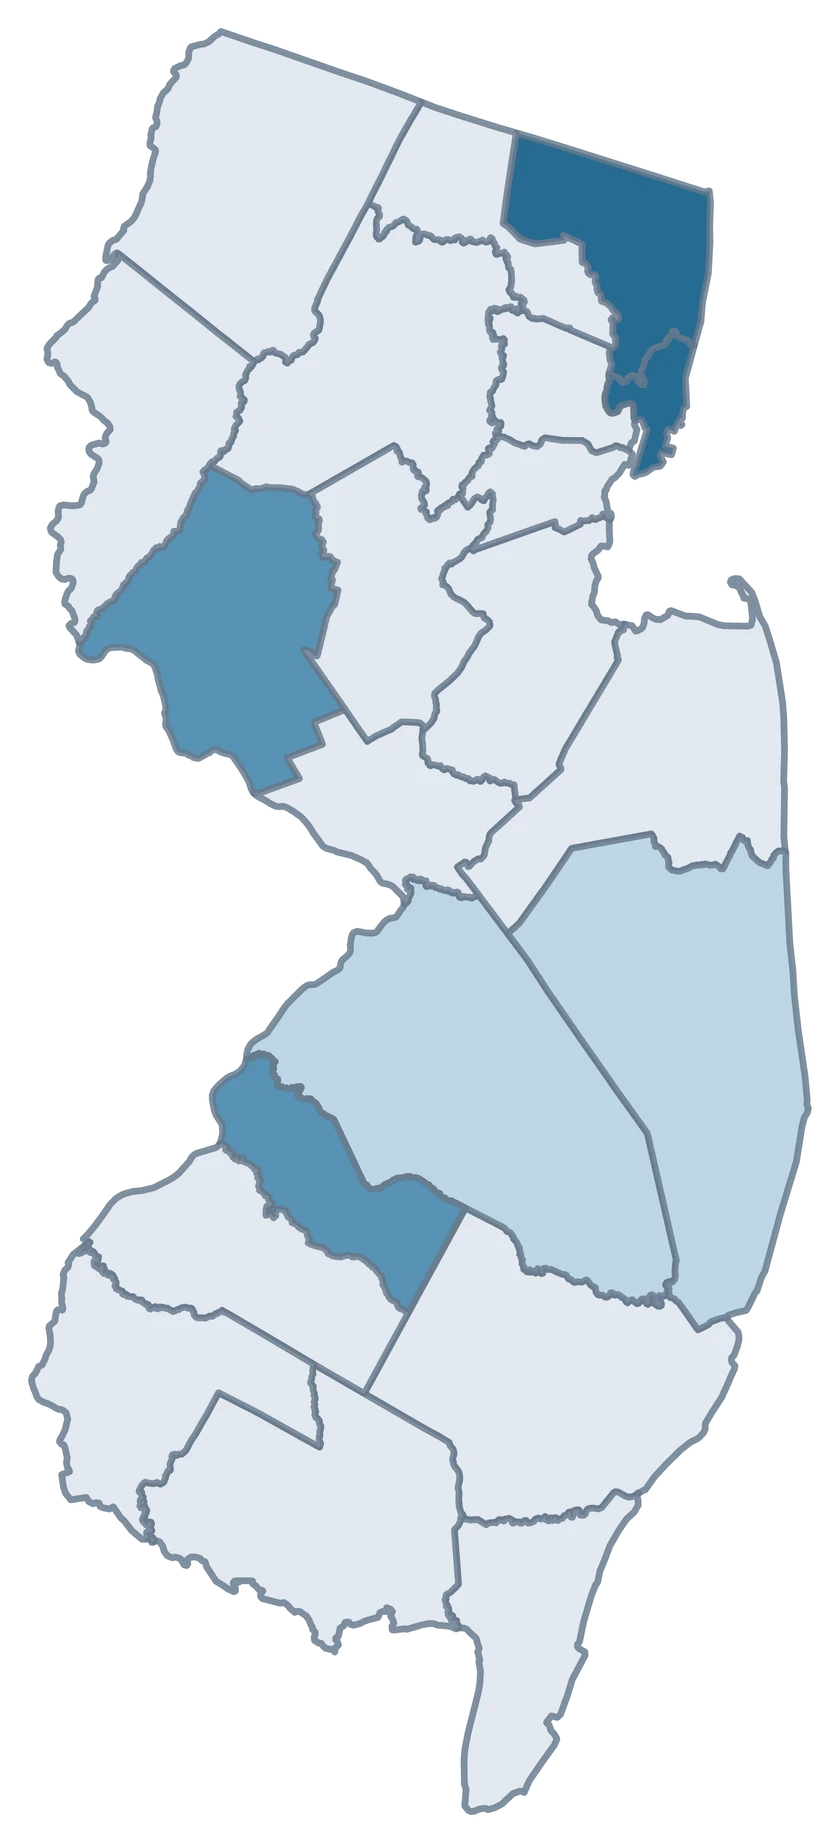
New Jersey fictional project map with six sampled county-level units and 15 neutral units.

Illustrative projects

  • 3–5 projects
  • 6–8 projects
  • 9–12 projects
  • 15 units outside the sample
Download complete PNG

CSV → Match 6 counties → Style → Export PNG Create a New Jersey map

COUNTY REFERENCE

All 21 New Jersey counties and GEOIDs.

Official county names and five-digit Census GEOIDs. Search by name or code.

  1. Atlantic CountyGEOID 34001
  2. Bergen CountyGEOID 34003
  3. Burlington CountyGEOID 34005
  4. Camden CountyGEOID 34007
  5. Cape May CountyGEOID 34009
  6. Cumberland CountyGEOID 34011
  7. Essex CountyGEOID 34013
  8. Gloucester CountyGEOID 34015
  9. Hudson CountyGEOID 34017
  10. Hunterdon CountyGEOID 34019
  11. Mercer CountyGEOID 34021
  12. Middlesex CountyGEOID 34023
  13. Monmouth CountyGEOID 34025
  14. Morris CountyGEOID 34027
  15. Ocean CountyGEOID 34029
  16. Passaic CountyGEOID 34031
  17. Salem CountyGEOID 34033
  18. Somerset CountyGEOID 34035
  19. Sussex CountyGEOID 34037
  20. Union CountyGEOID 34039
  21. Warren CountyGEOID 34041

U.S. Census Bureau · 2025 Cartographic Boundary Files

COMMON QUESTIONS

New Jersey county map questions.

Can I color Jersey City separately from Hudson County?

This editor selects Hudson County as a whole. Jersey City is useful as a label or contextual reference, but city-only observations need city geography.

How do I map counties on both sides of the Delaware River?

Use the national county editor for one map that spans New Jersey and Pennsylvania, and join the values using their full five-digit GEOIDs.

Where do I find the county for Newark?

Use Essex County, GEOID 34013, for estimates that cover the whole county. Newark city observations have a different boundary.

Can I compare the Jersey Shore with inland counties?

Yes. Join observations for the same measure and period to the individual coastal and inland counties you want to compare.

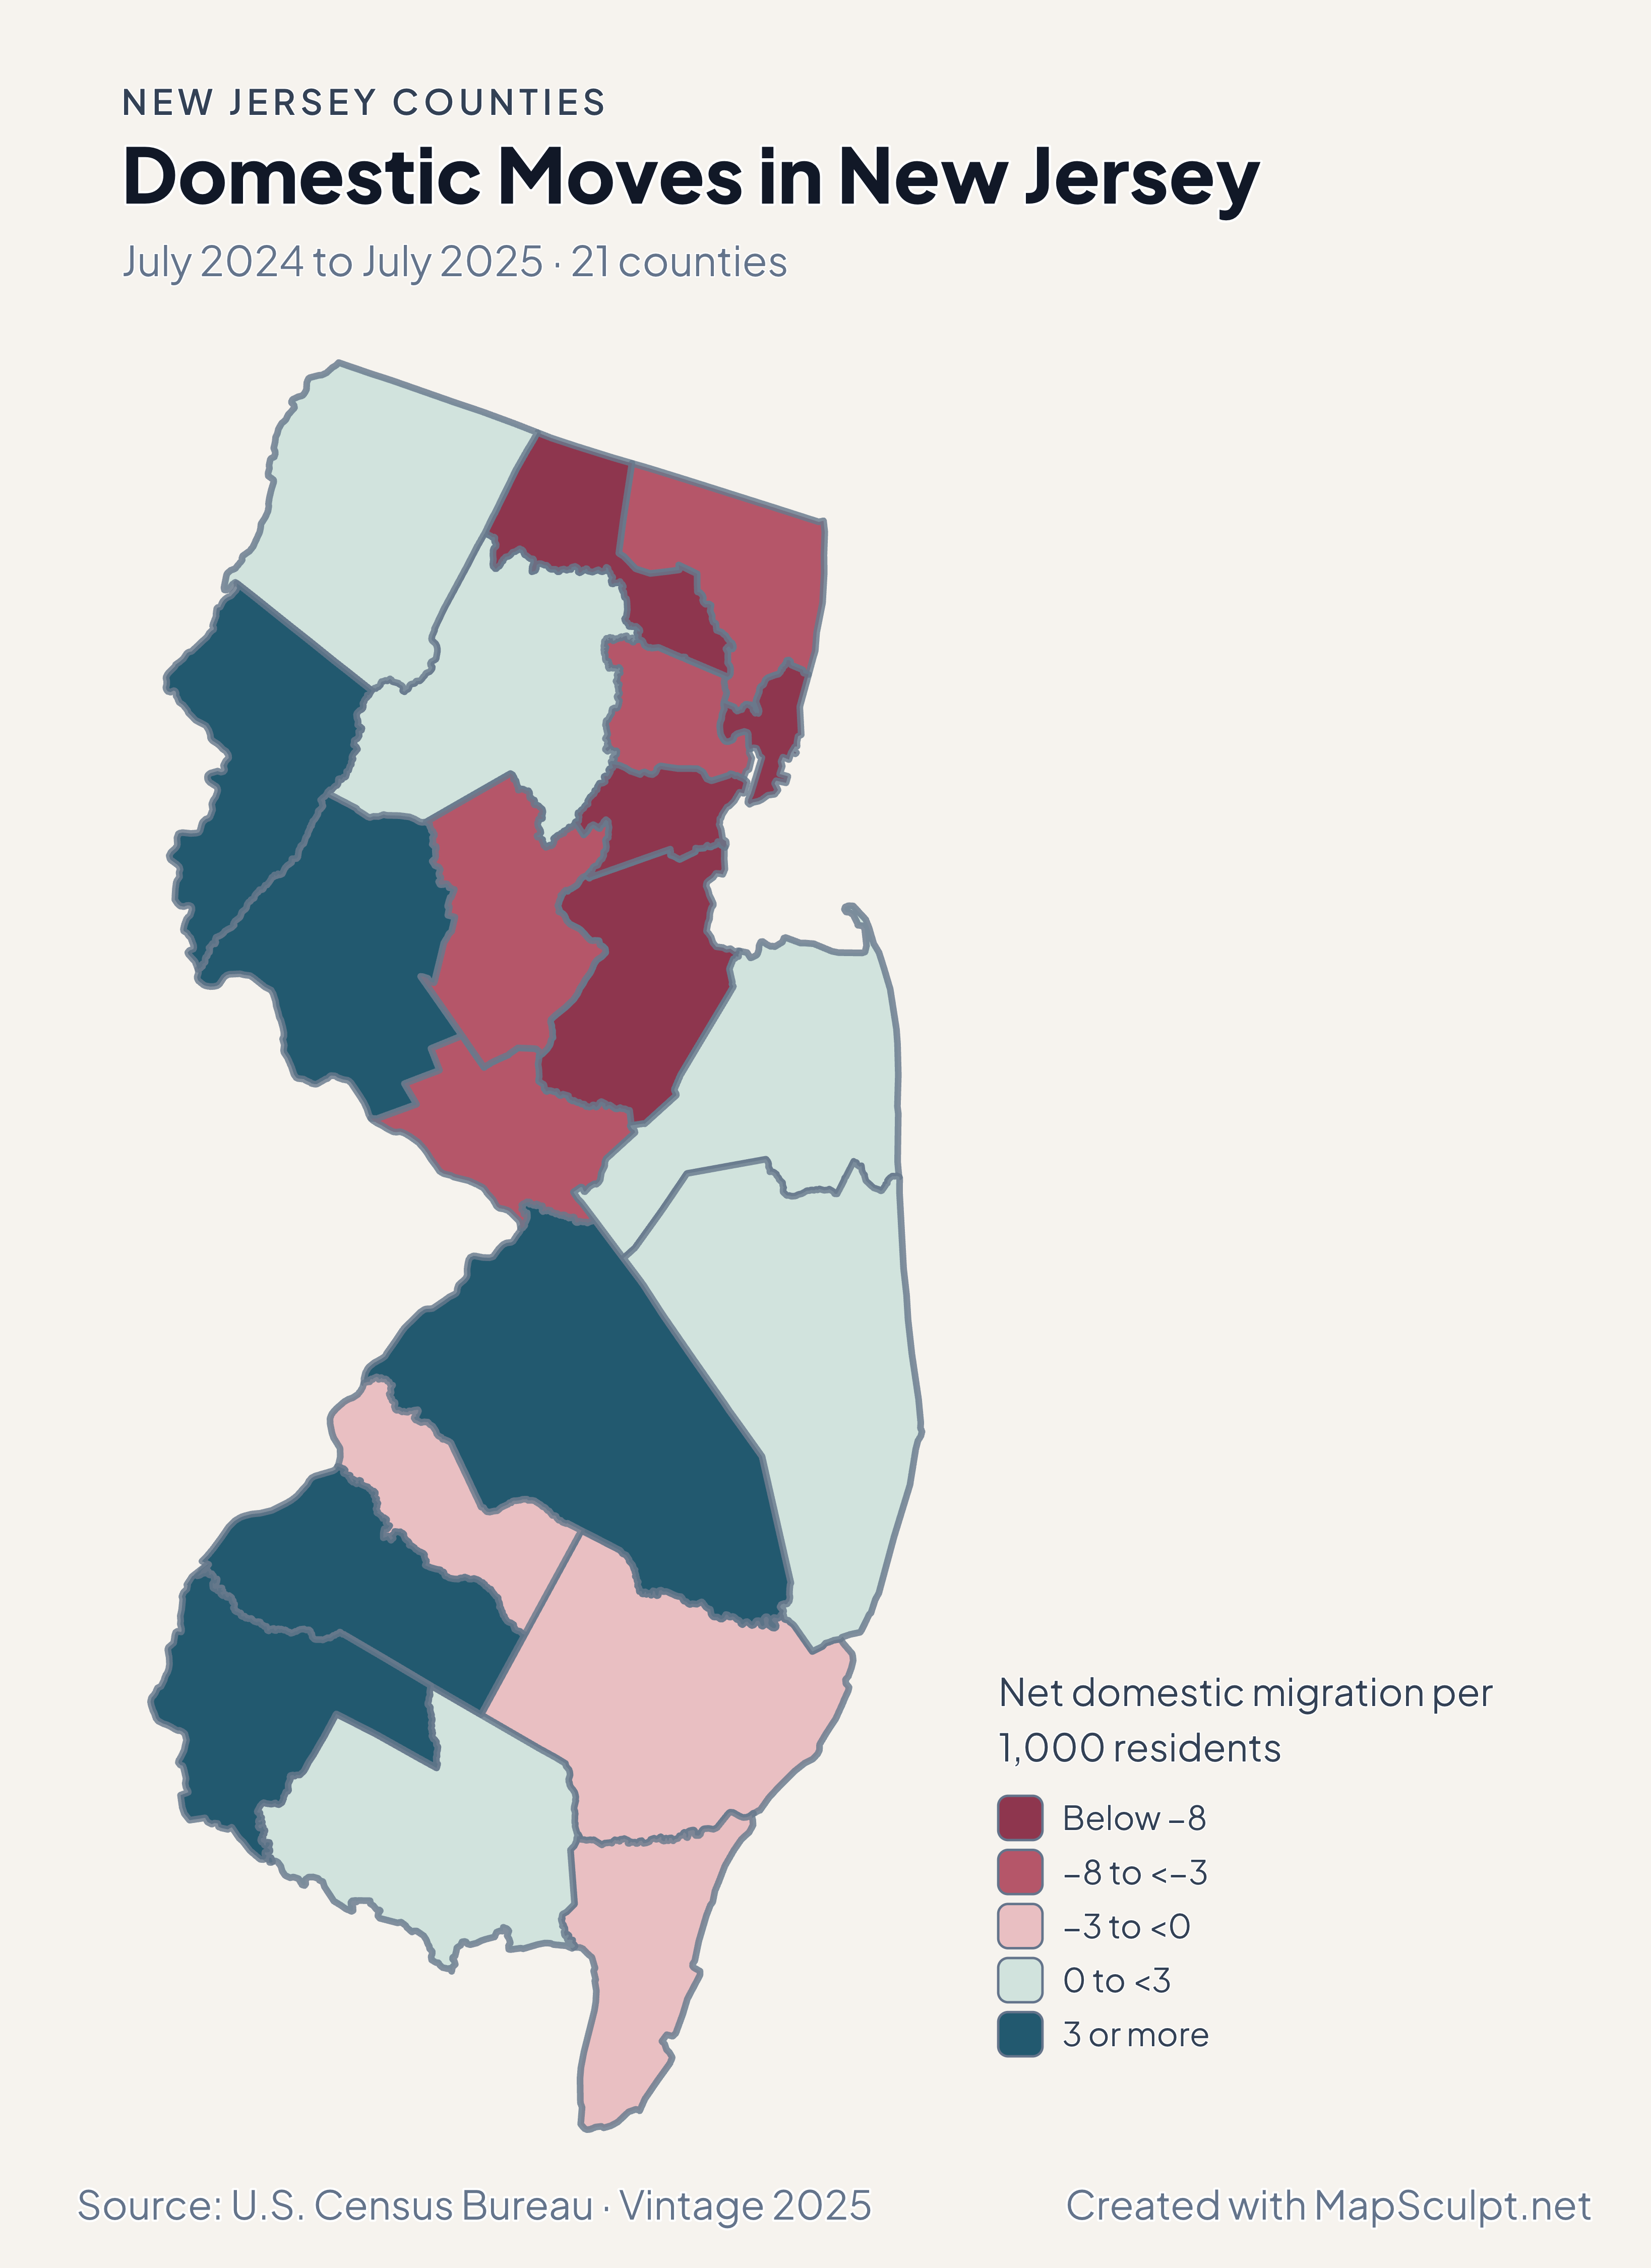
Why can Hudson grow while losing domestic movers?

Domestic migration measures net moves within the US. Total population can also change through international migration, births, deaths and adjustments.

What does New Jersey’s rent-burden map exclude?

It excludes renter households whose gross rent as a percentage of income could not be computed. The source is the 2020–2024 ACS.

YOUR NEXT MAP STARTS HERE

Put your New Jersey data on the map.

Choose a comparison for New Jersey, join your observations by Census GEOID and export a map with the period and source included.

Create a New Jersey map