Standard Map
Flexible layout
For reports, presentations and general map exports.


NORDIC REGIONS / CUSTOM MAPS
Create a custom map of Denmark, Finland, Iceland, Norway and Sweden. Color individual regions, import CSV data, add a title and legend, and download a high-resolution PNG.Color Nordic regions, add a legend or import CSV data. Download your map as a PNG.
Create My Nordic Map68 regions · Free editor · No signup
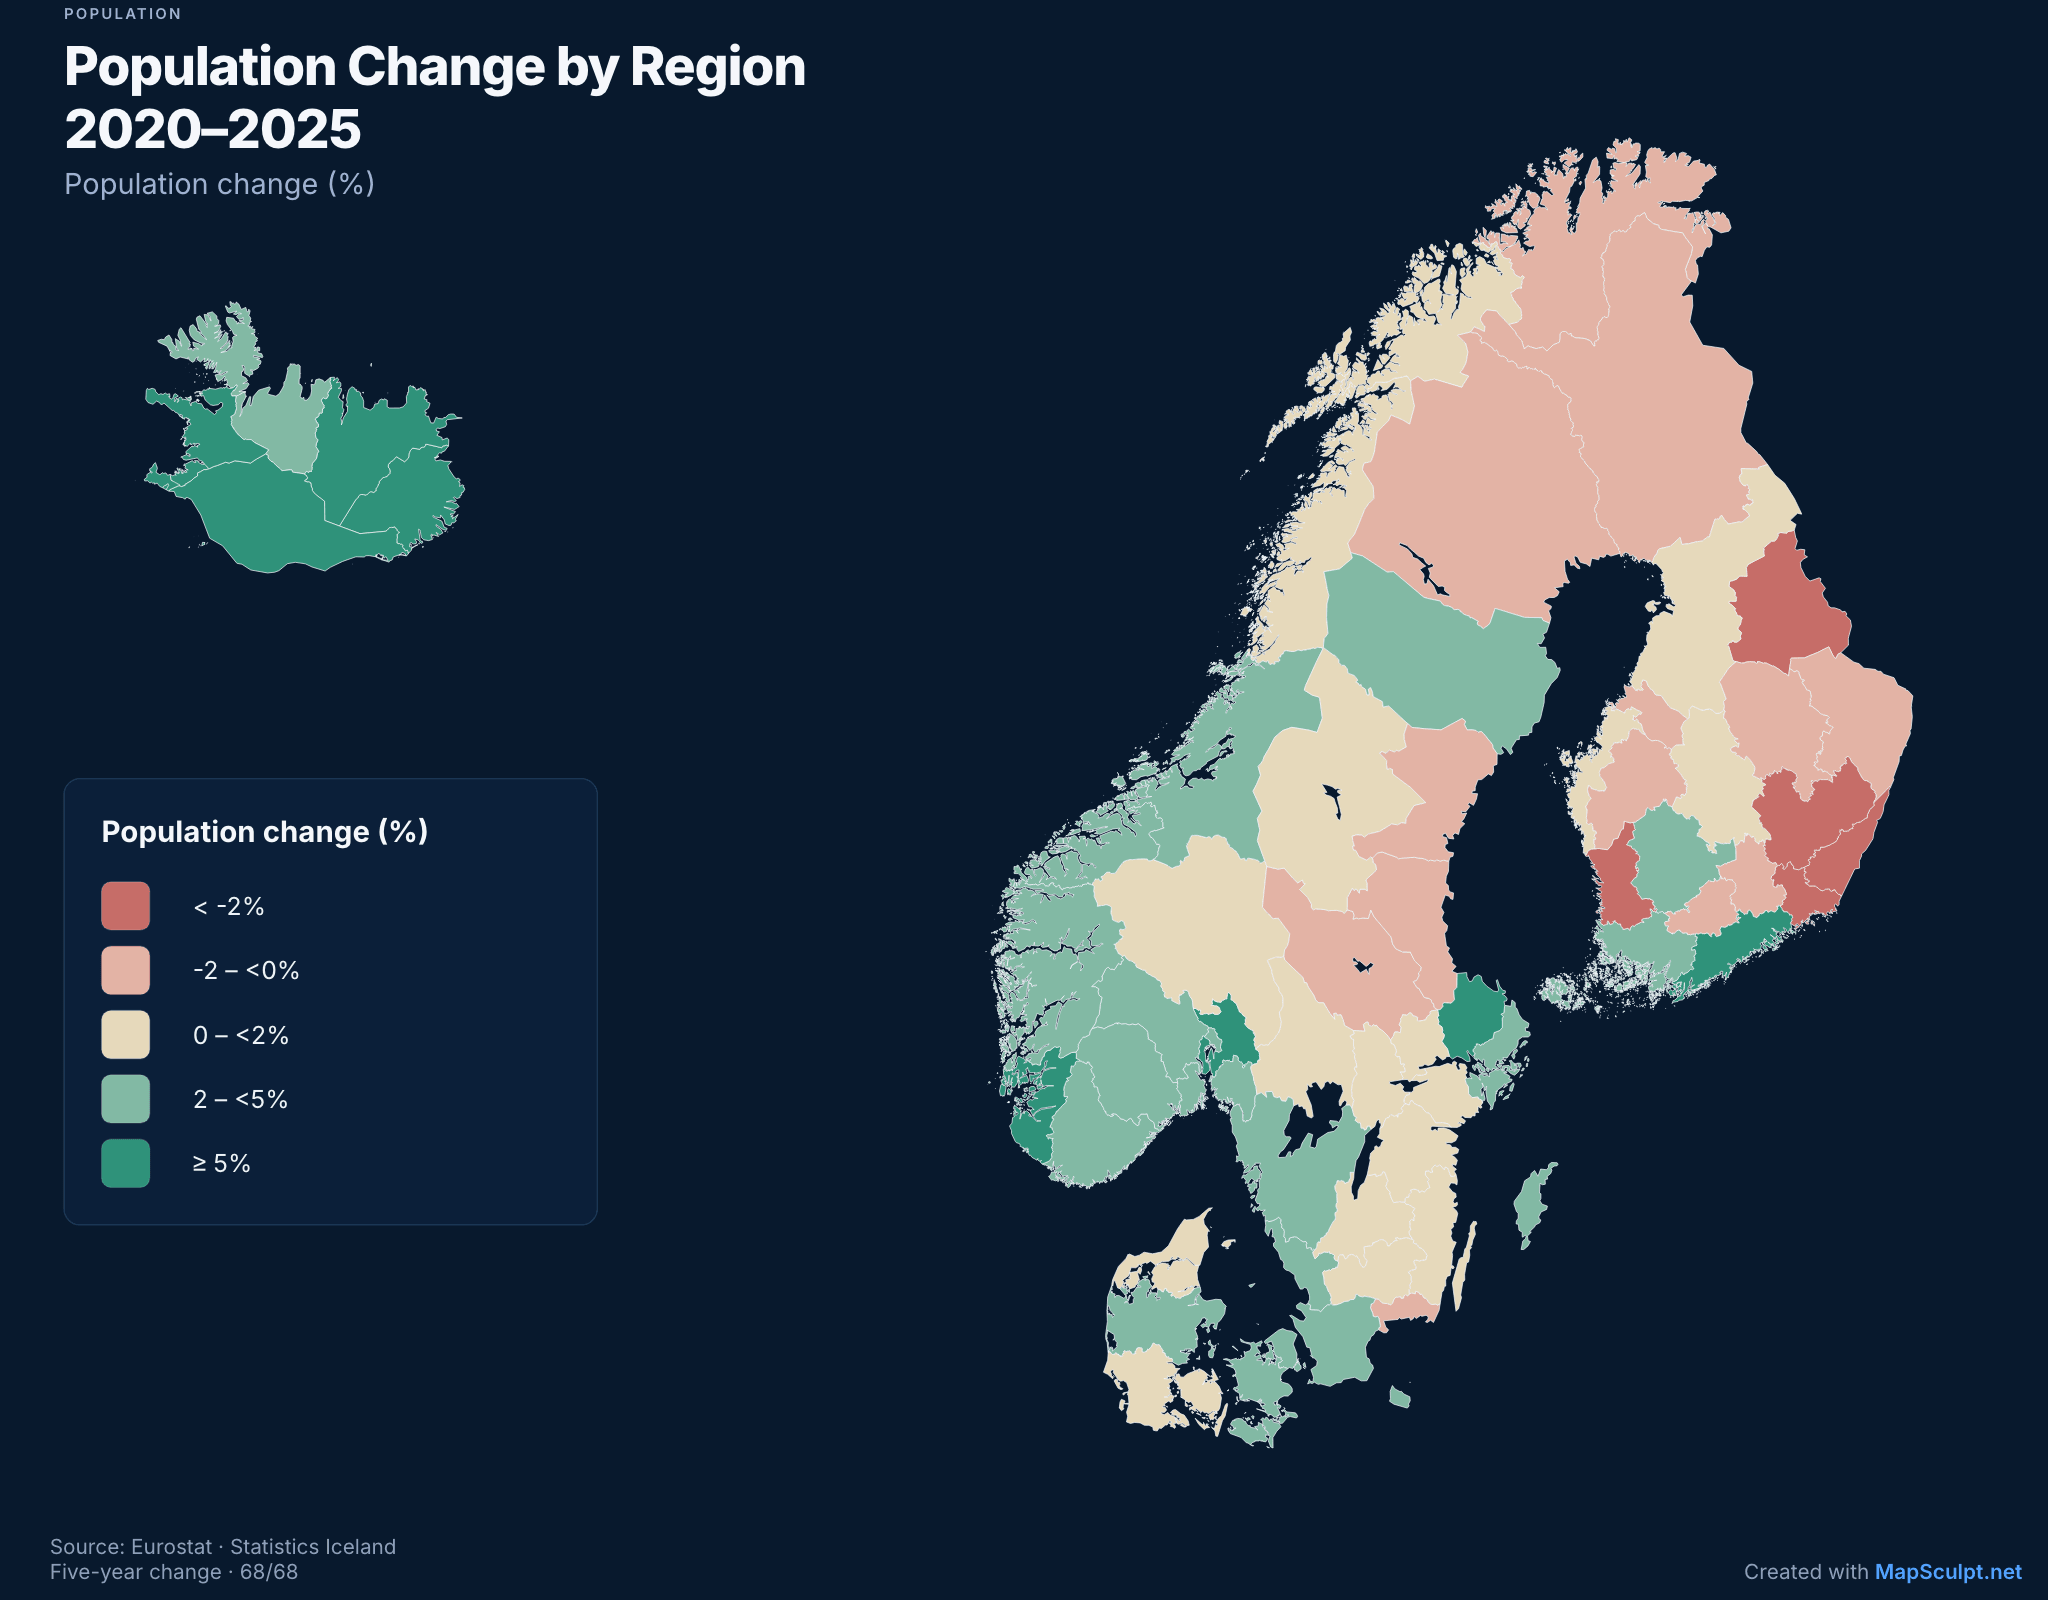
Population Change by Region (2020–2025)
Eurostat demo_r_pjanaggr3 · Statistics Iceland MAN03250 · 2020–2025
EXPORT FORMATS
Choose a layout for reports, social posts or vertical content. Keep the same map and change its format.
Flexible layout
For reports, presentations and general map exports.
3:4 · 1080 × 1440
A portrait layout with space for a title, legend and source.
9:16 · 1080 × 1920
A vertical layout for stories and video-sized content.
NORDIC GEOGRAPHY
Select regional areas in Denmark, Finland, Iceland, Norway and Sweden.
15 counties
21 counties
19 regions · Åland included
5 regions
8 regions
These are different administrative and statistical divisions. Greenland and the Faroe Islands are not part of this template.
MAP EXAMPLES
Explore population change, age profiles and regional populations using official statistics.
POPULATION / OFFICIAL DATA
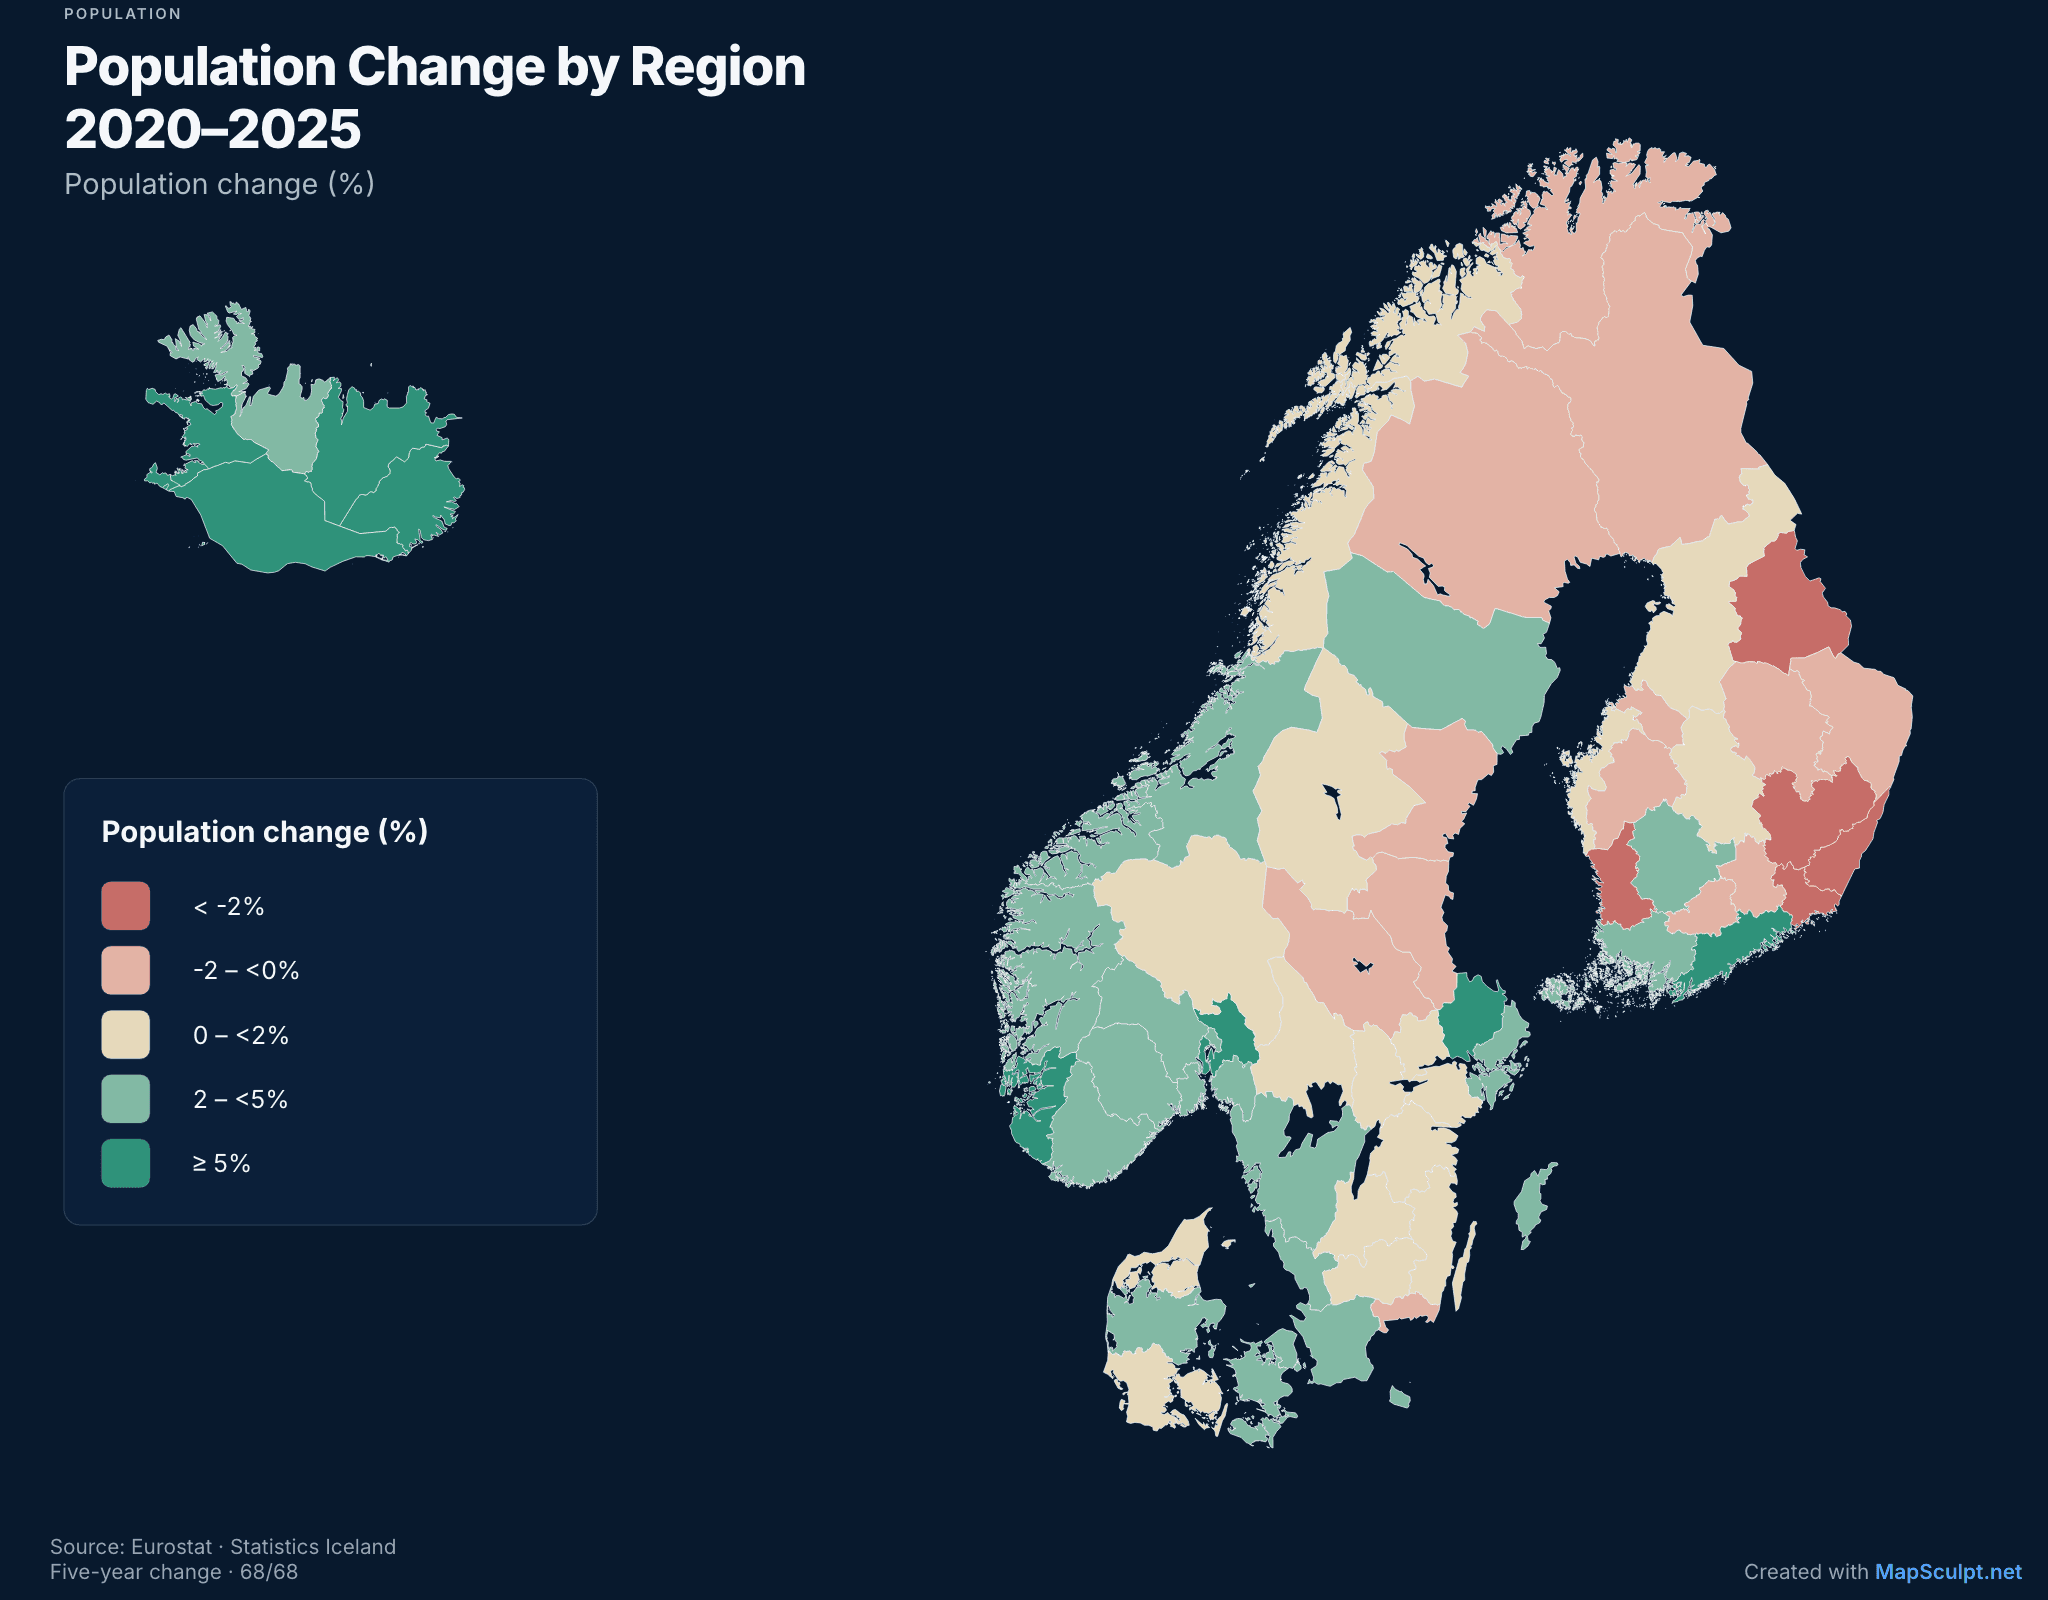
Five-year population change between 1 January 2020 and 1 January 2025. Iceland uses its revised national series.
AGE PROFILE / OFFICIAL DATA
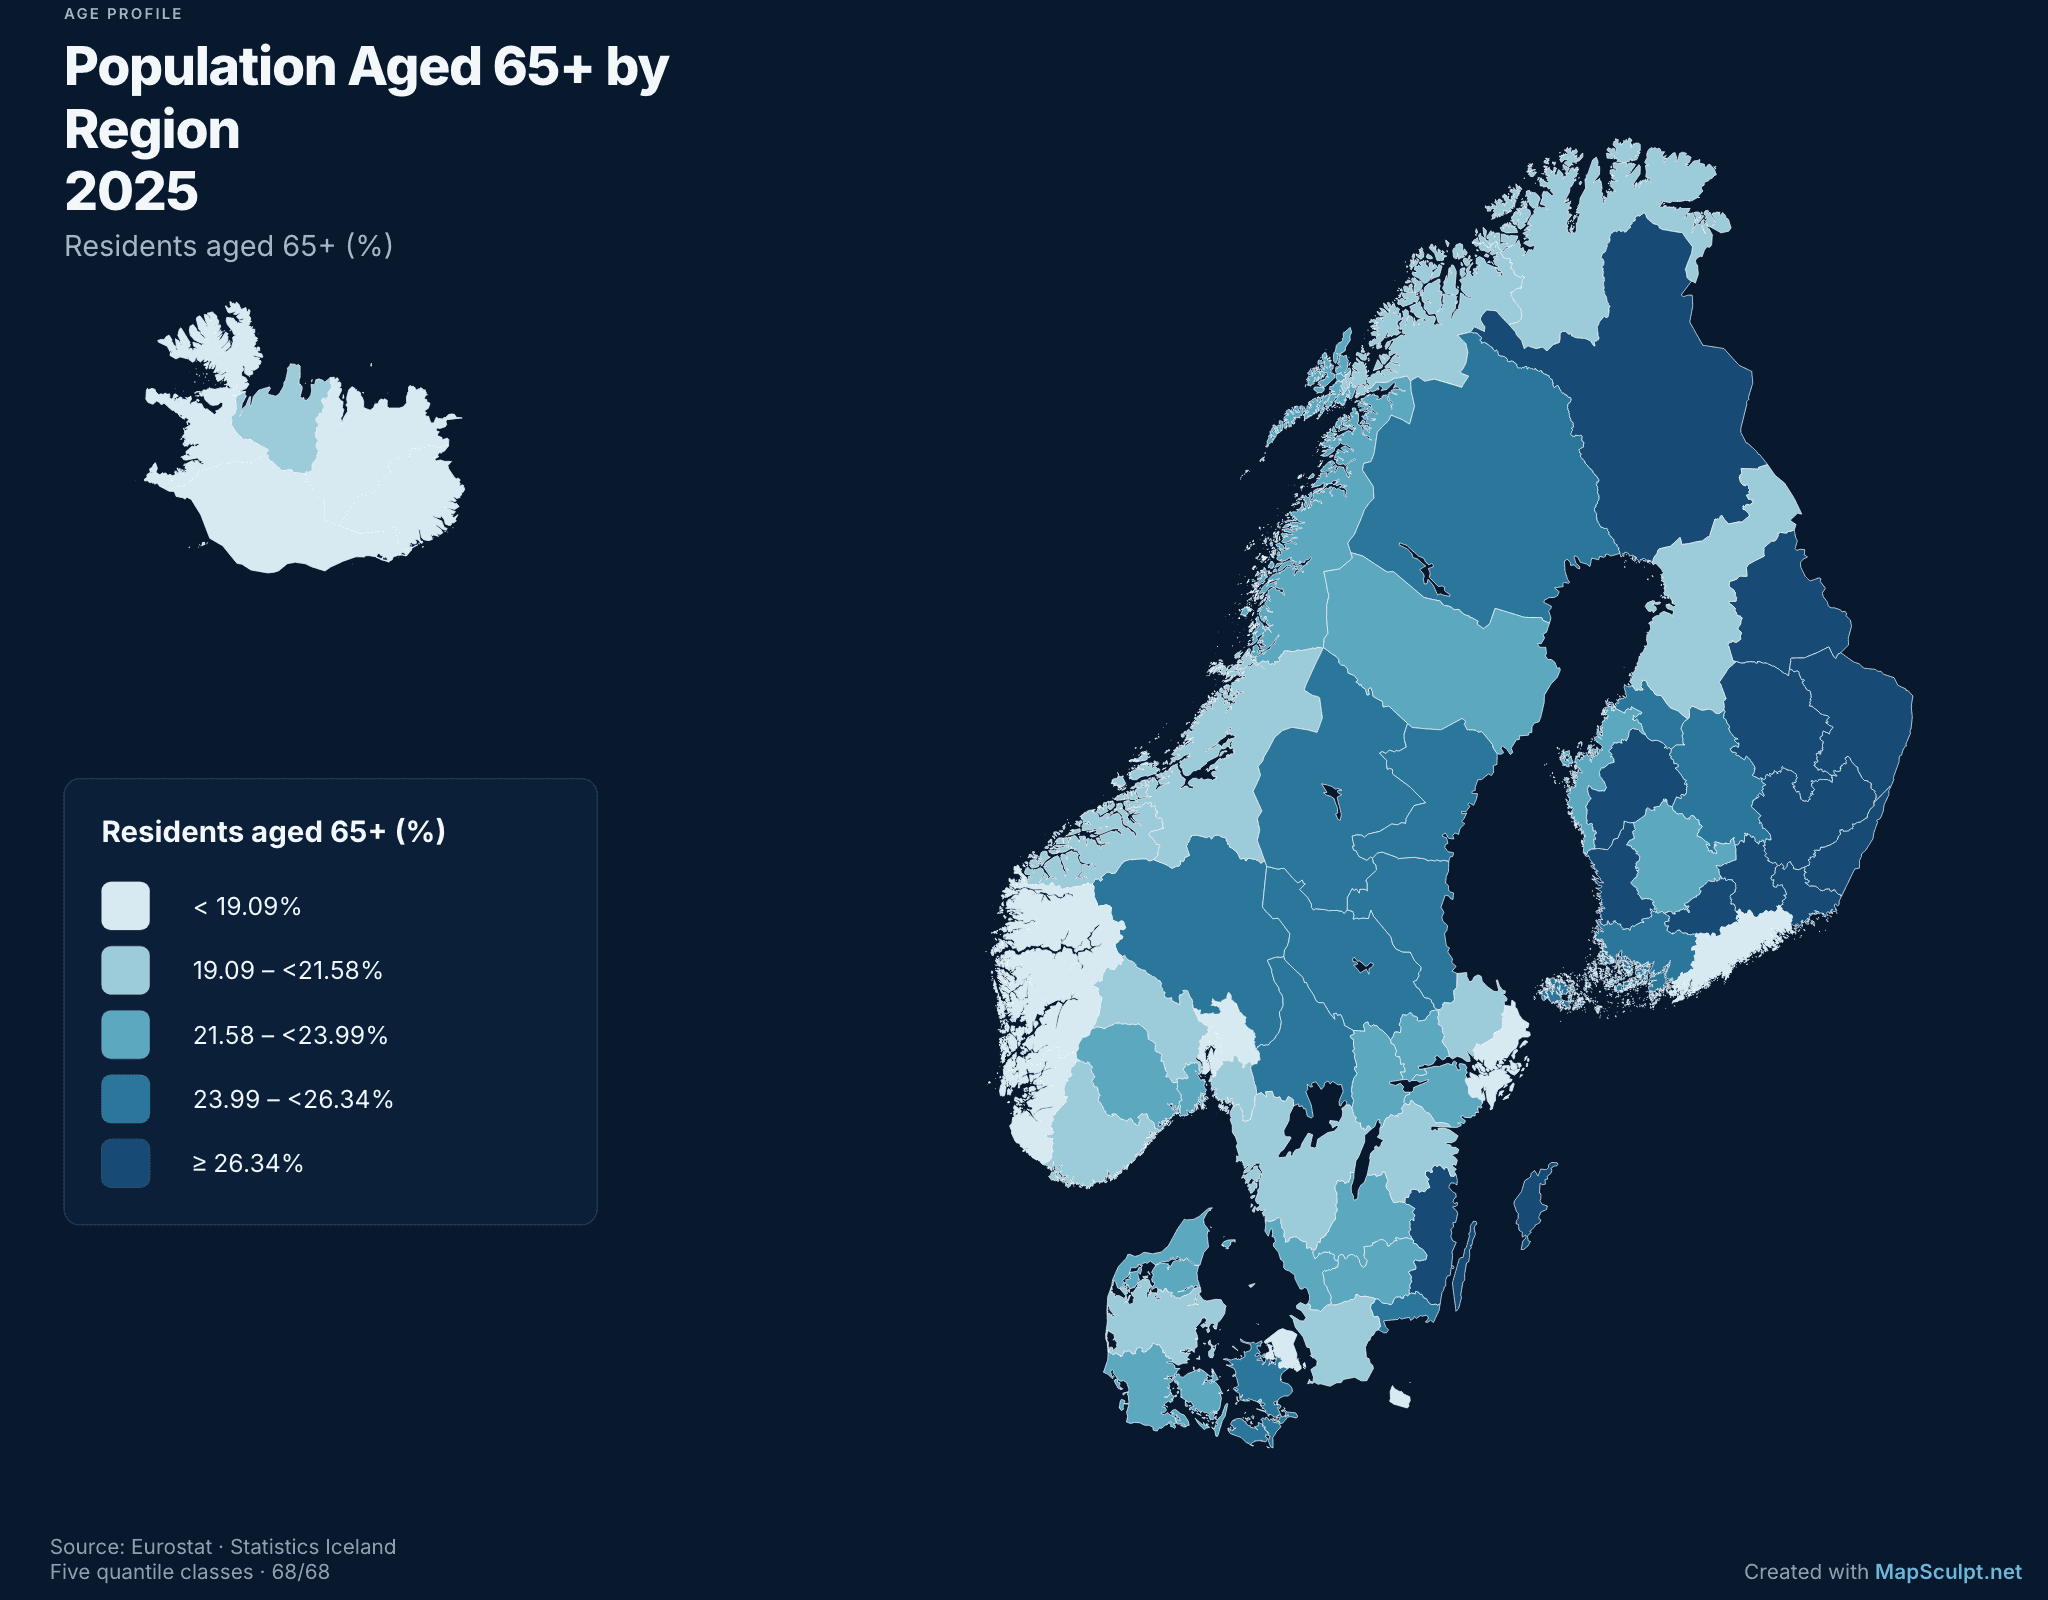
Share of residents aged 65 or over on 1 January 2025, across all 68 Nordic areas.
RESIDENTS / OFFICIAL DATA
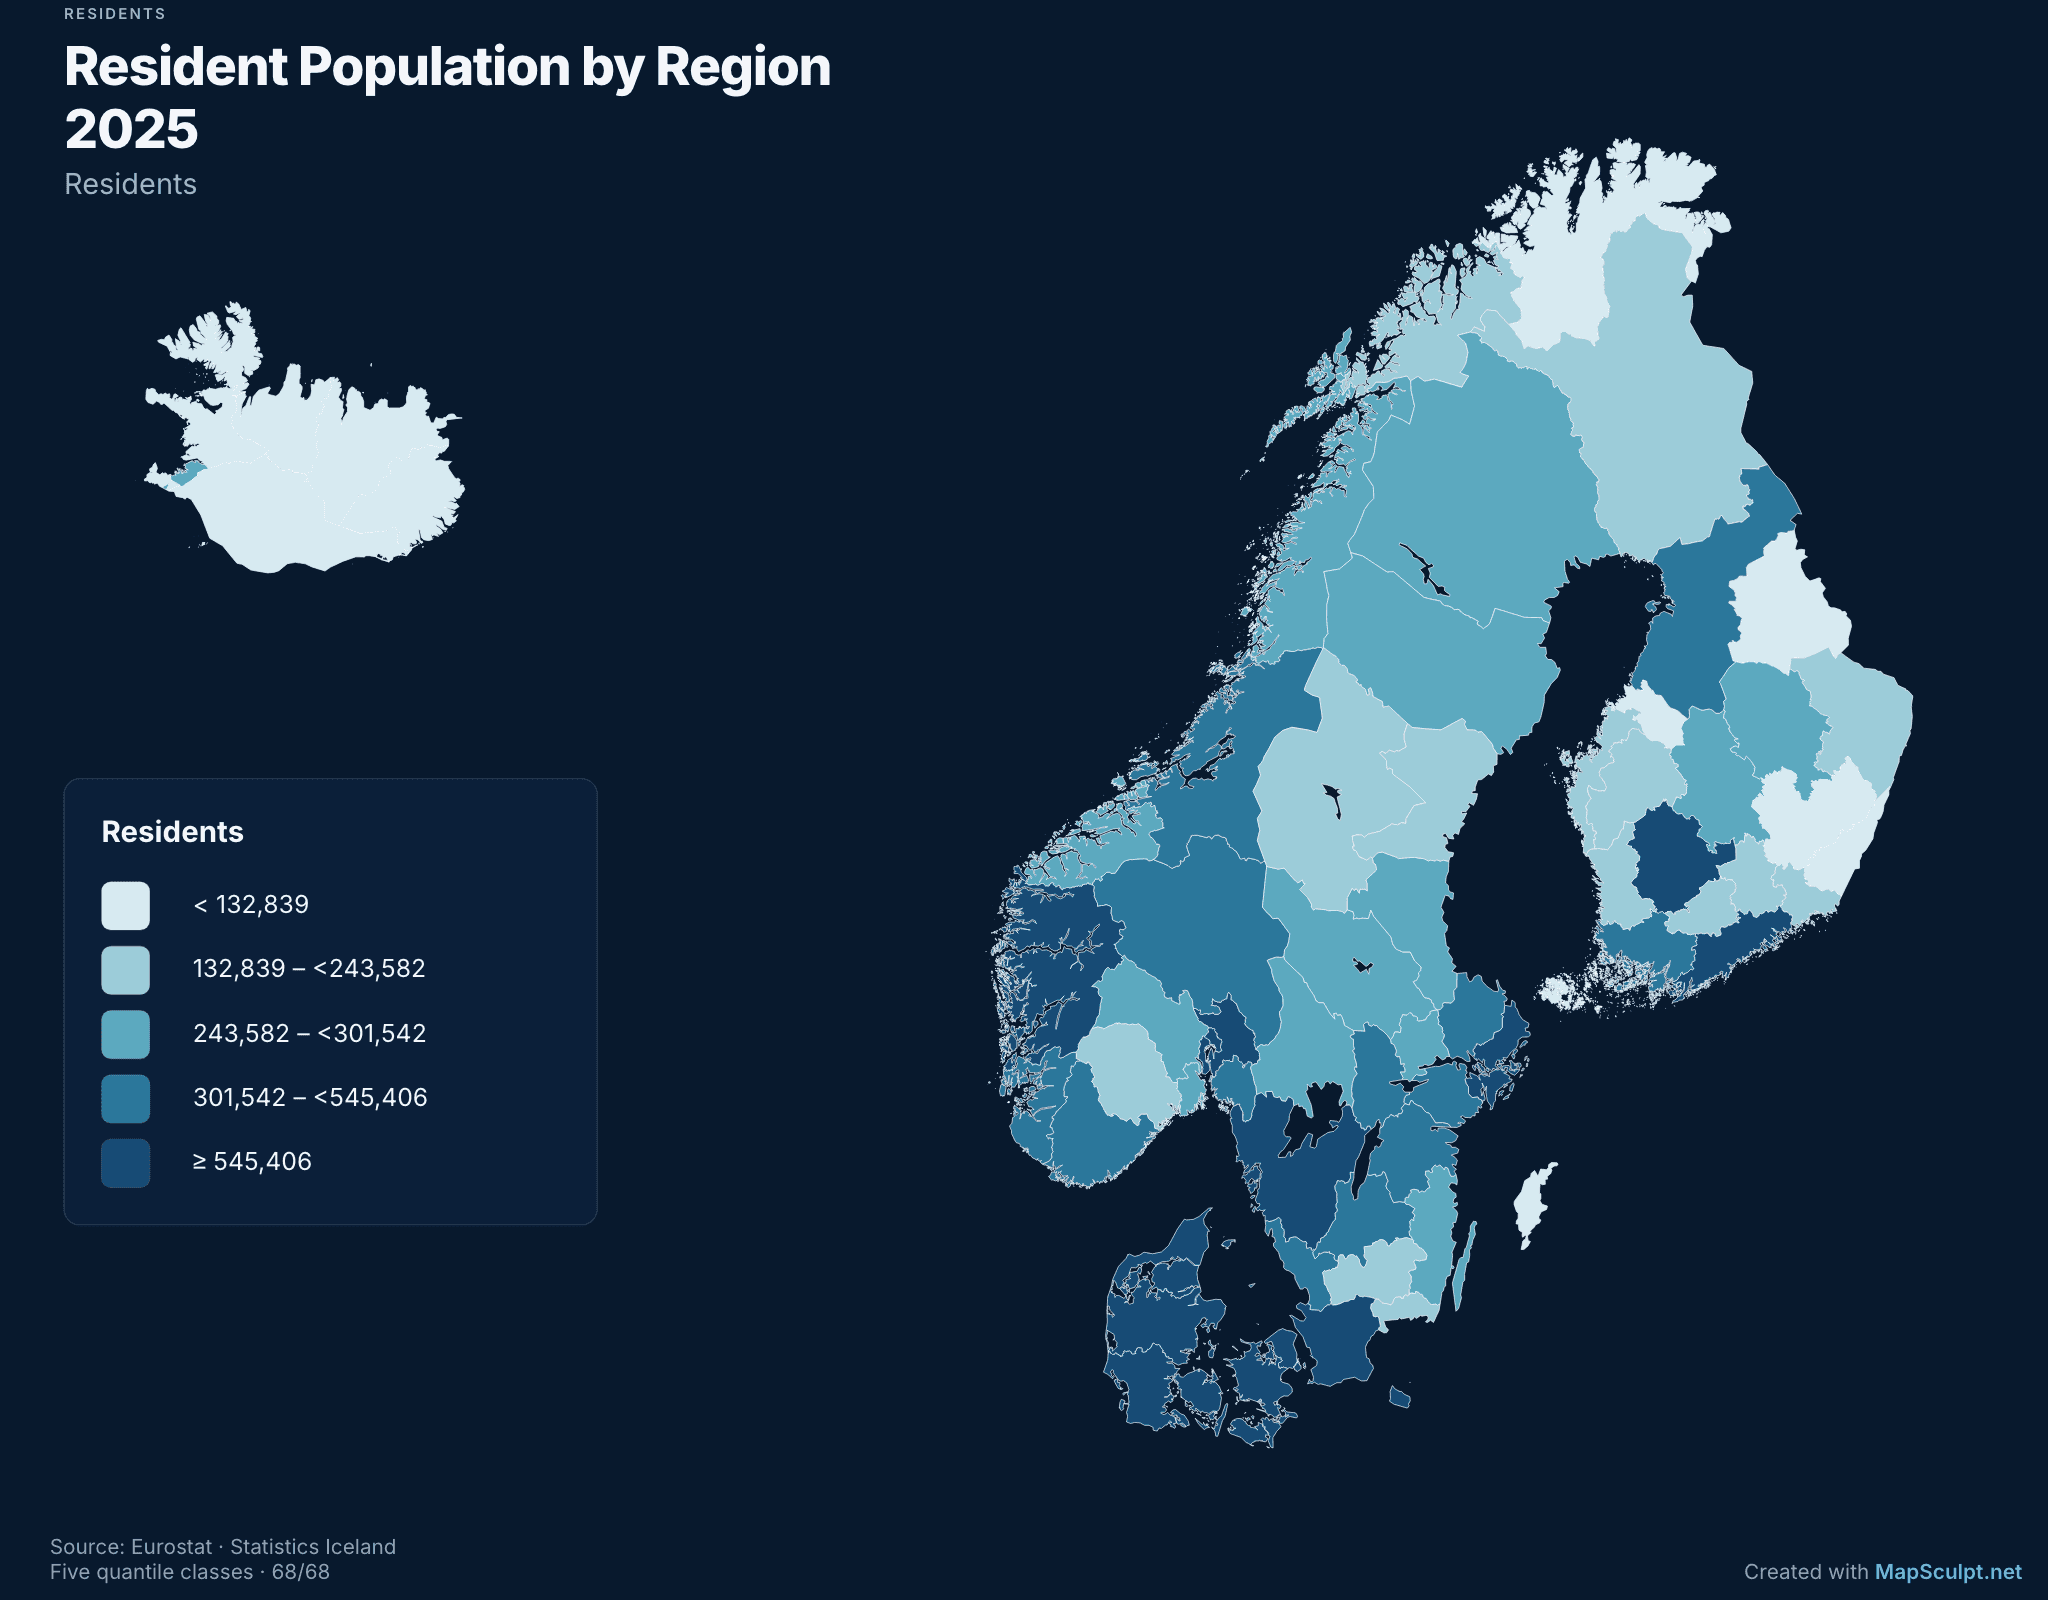
Total resident population on 1 January 2025. Compare the size of all 68 Nordic areas.
HOW IT WORKS
Open the Nordic template, customize the regions and export a PNG.
Start with the Nordic Regions template.
Choose colors manually or import regional CSV data.Color areas or import a regional CSV.
Add a title, labels, a legend and data source where appropriate.Add a title, labels and legend.
Choose a format and download a high-resolution PNG.Choose a format and download a PNG.
CSV DATA IMPORT
Import regional data, review geographic matches and color regions by value or category.Import regional IDs from CSV and review the matches.
SAMPLE CSV
RegionCode,Value
FI-01,42
NO-03,65
SE-AB,83
DK-84,51
IS-1,74
Illustrative values · Confirm matches in the importer
Choropleth Map MakerMATCH REGIONAL IDS
Only matched areas receive imported values.
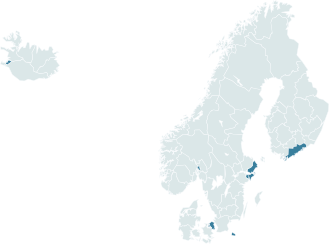
Five sample region IDs · Review matches
MAP EDITOR FEATURES
Assign colors to individual supported regions.Assign colors to individual regions.
Match regional values or categories from your spreadsheet.Import regional data from CSV.
Choose colors for numerical ranges or groups.Choose a palette for your data.
Add a title, labels and legend to your map.Add a title, labels and legend.
Adjust backgrounds, borders and layout.Change borders, background and layout.
Download your map in the layout you need.Export any supported PNG layout.
COMMON QUESTIONS
Open the Nordic Regions editor, color individual regions, add a title and legend, and export a PNG.
Yes. You can create and download custom Nordic maps using the free online editor.
Denmark, Finland, Iceland, Norway and Sweden.
The template contains 68 selectable areas: 15 in Norway, 21 in Sweden, 19 in Finland, five in Denmark and eight in Iceland.
Yes. Select a supported region and assign its color or category.
Yes. Import supported geographic identifiers and values, review matches and choose numerical ranges or categories.
Yes. Choose Standard, Social Portrait (3:4) or Story & Video (9:16). These layouts support PNG exports.
No. The template covers subdivisions of Denmark, Finland, Iceland, Norway and Sweden, excluding Greenland and the Faroe Islands.
Yes. Check the rules of communities such as r/MapPorn and r/dataisbeautiful before posting. Include sources and reference years for statistical maps, and add [OC] when required for original content.
START MAPPING
Color regions, add your own data and export a PNG in your chosen format.
Create My Nordic Map