Counties within one state
Use a dedicated state editor to work with its counties or county equivalents. This is the best fit for a report or dataset covering a single state.
Find your state

UNITED STATES / COUNTY MAP DIRECTORY
Choose a state to color its counties individually or import CSV data for a numerical or categorical map. Add your own title and legend, then download a high-resolution PNG.
CHOOSE A GEOGRAPHY
Start with the geographic unit you want to color or match to your data.
MAPS MADE WITH MAPSCULPT
Each example uses published Census data and the original MapSculpt editorial export. The state guides explain the measures and offer more examples.
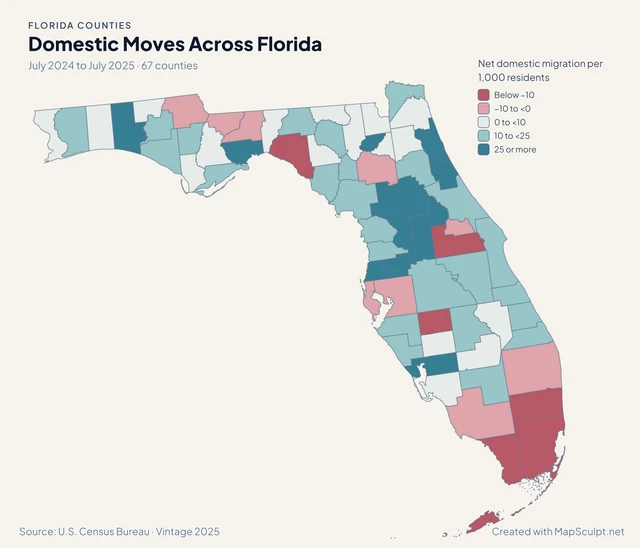
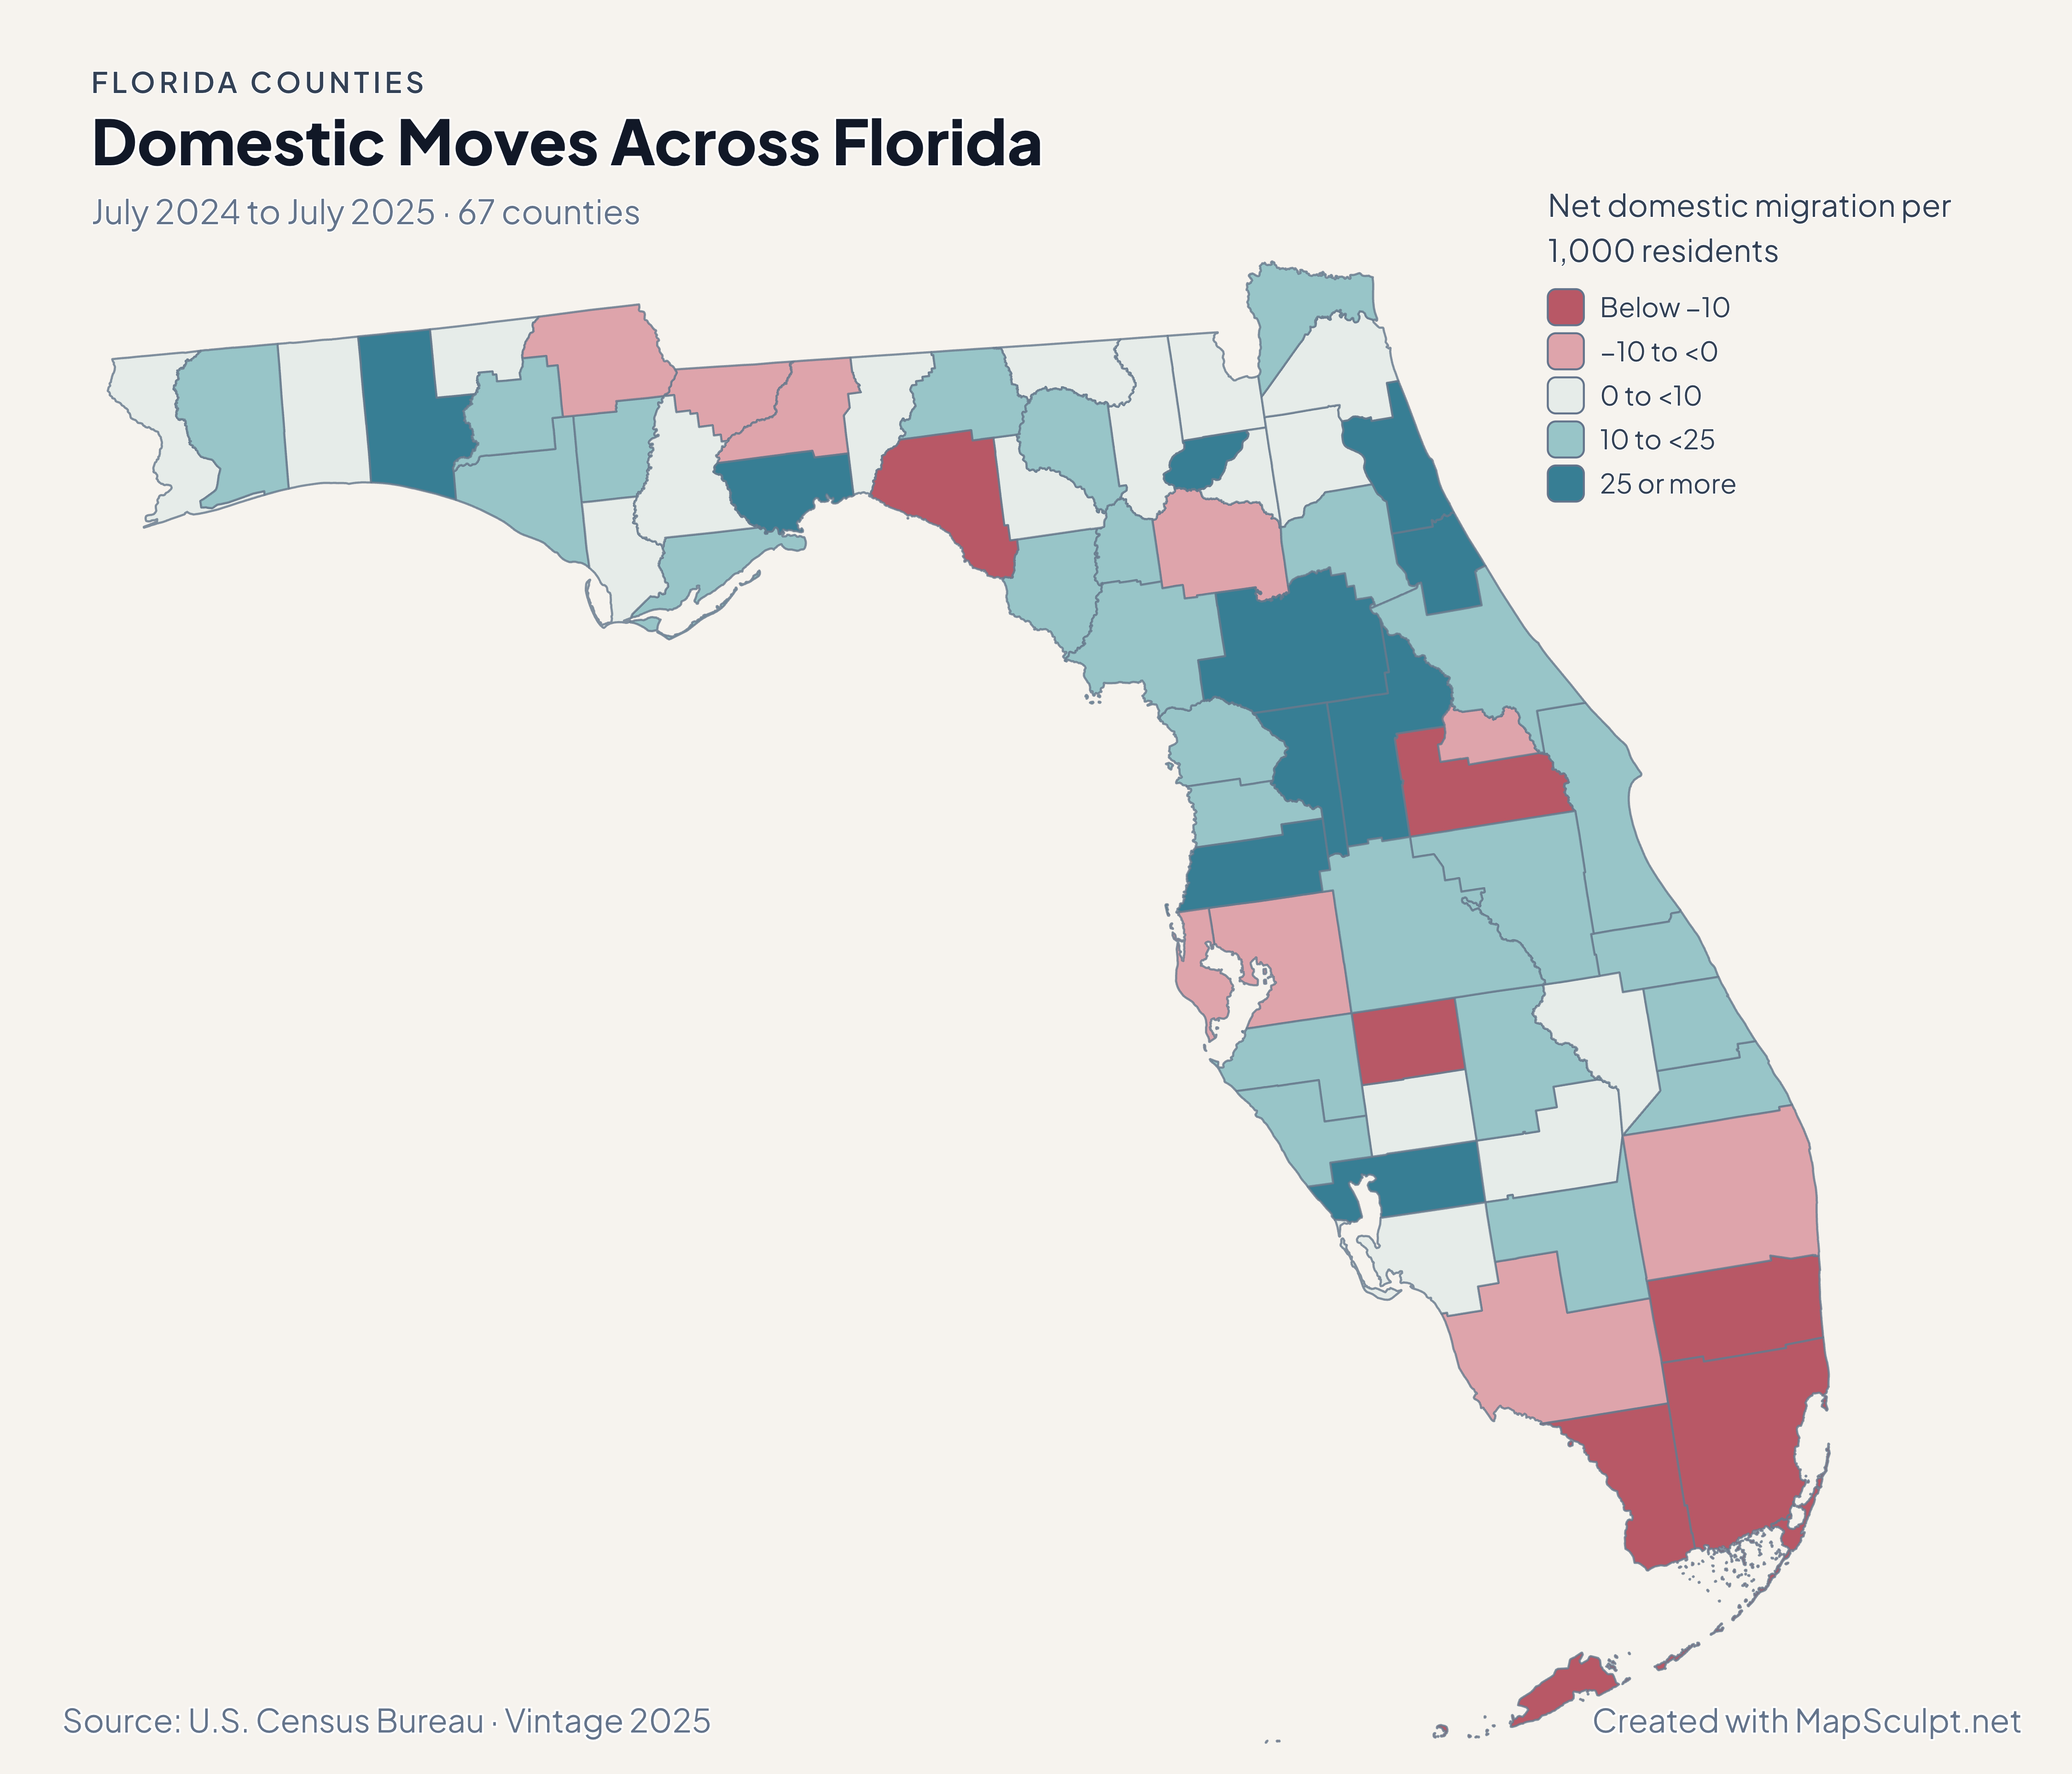
July 2024 to July 2025
Compare net moves within the United States across Florida counties. Expressing the estimates per 1,000 residents makes counties of different sizes easier to compare.
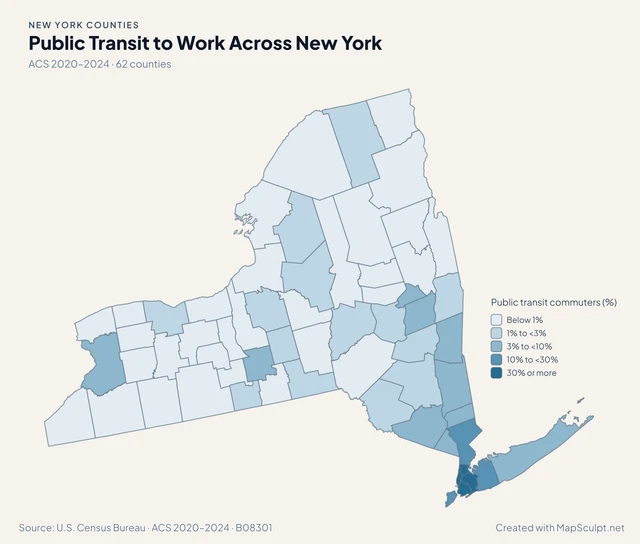
ACS 2020–2024
Compare the share of workers who commuted by public transit. The denominator excludes people who worked from home, so the map describes travel among commuters.
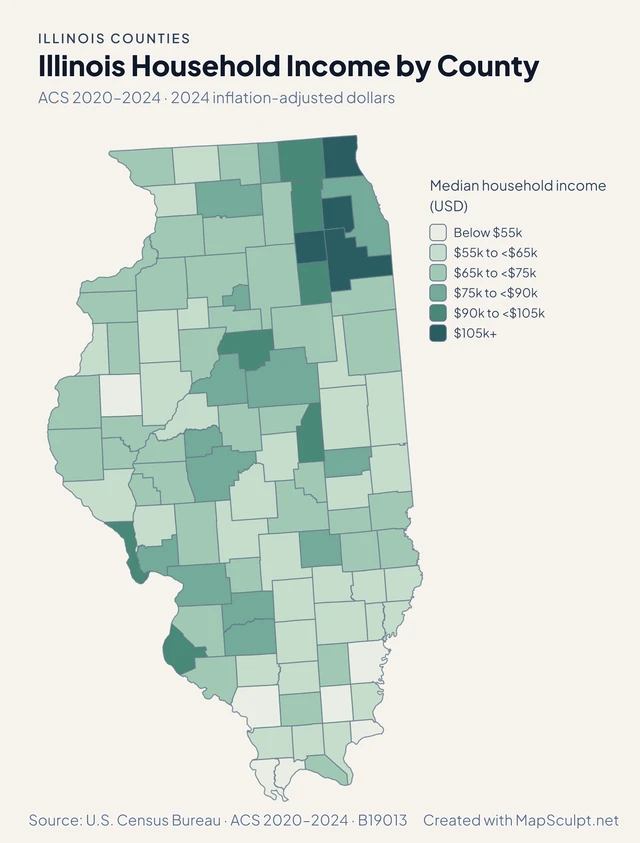
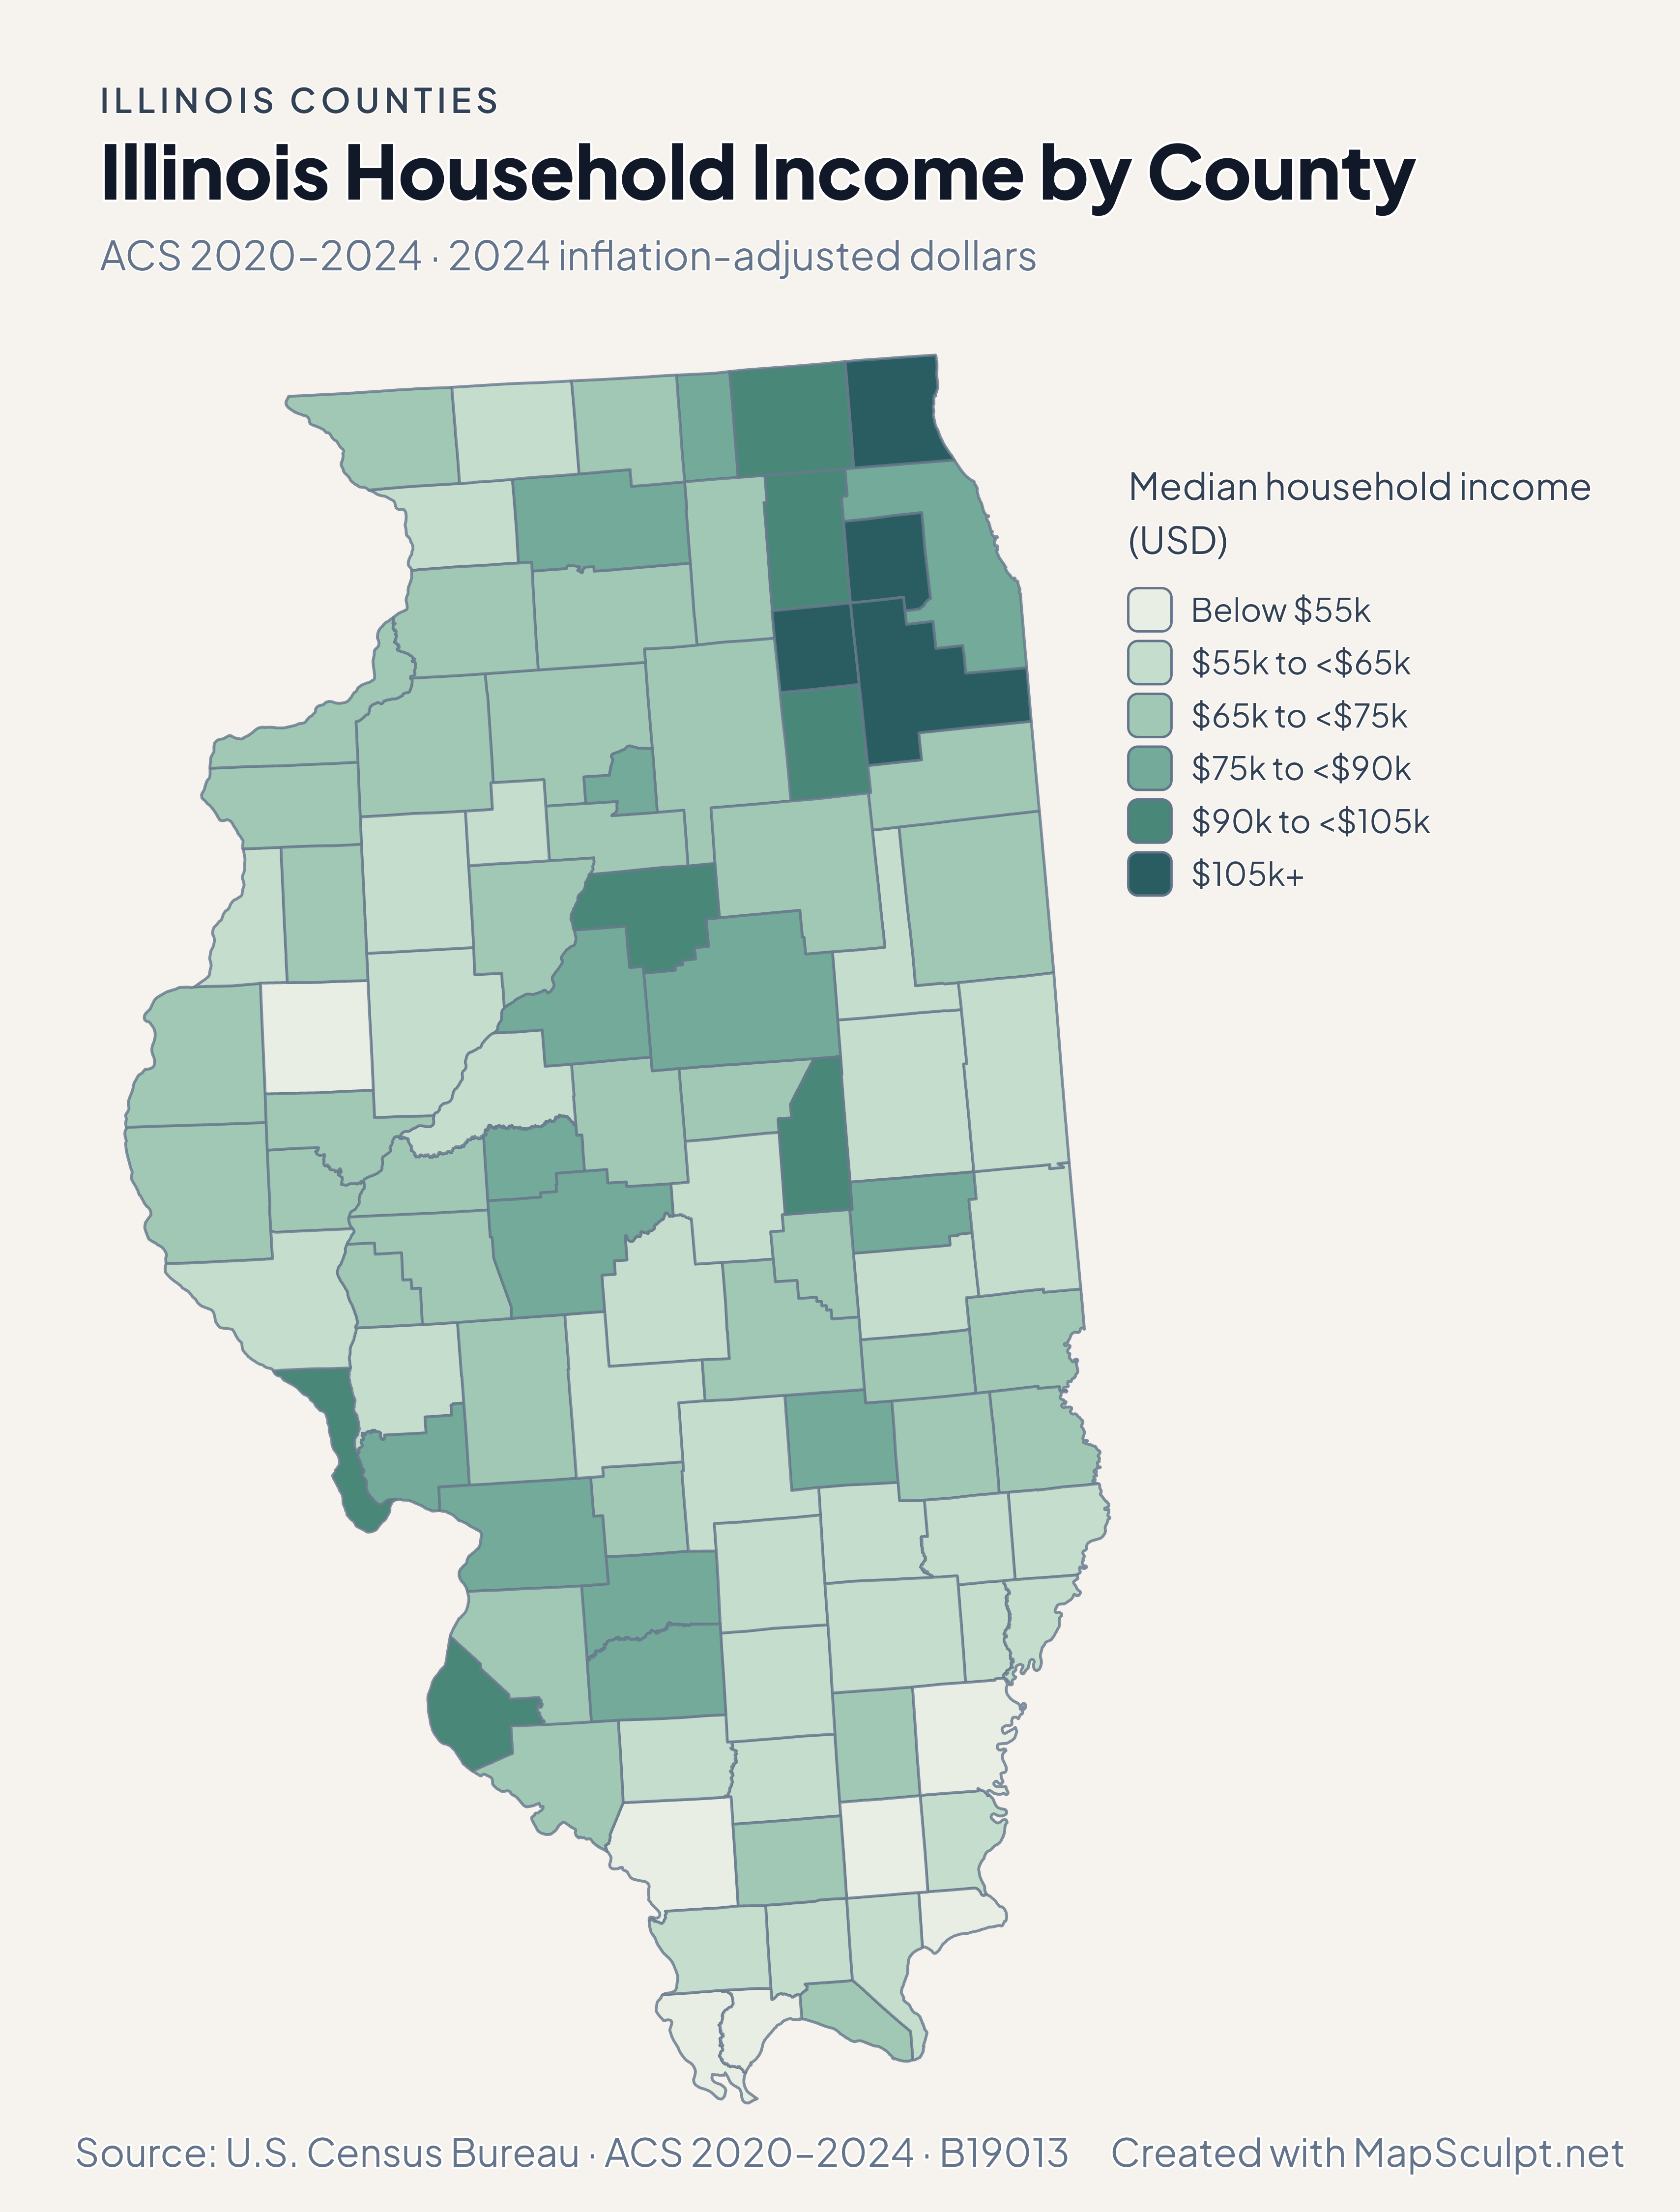
ACS 2020–2024
Compare household income estimates across Illinois counties using common dollar bands. The estimates are expressed in inflation-adjusted 2024 dollars.
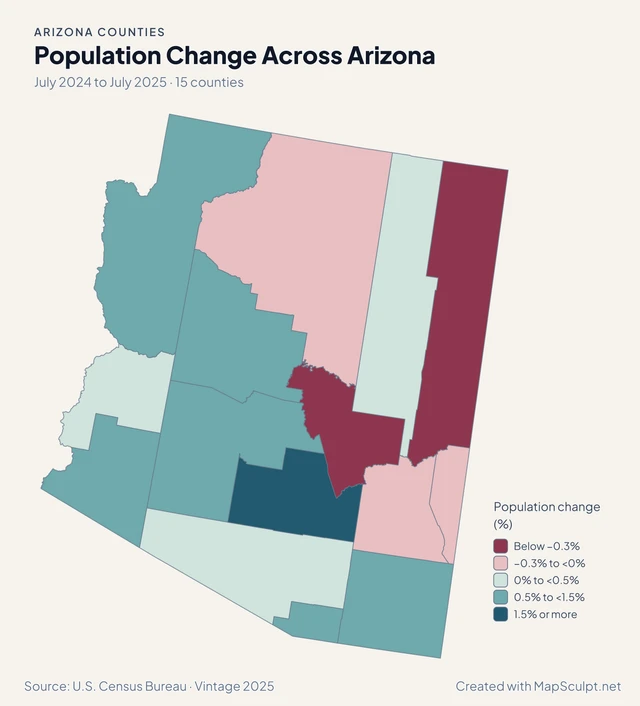
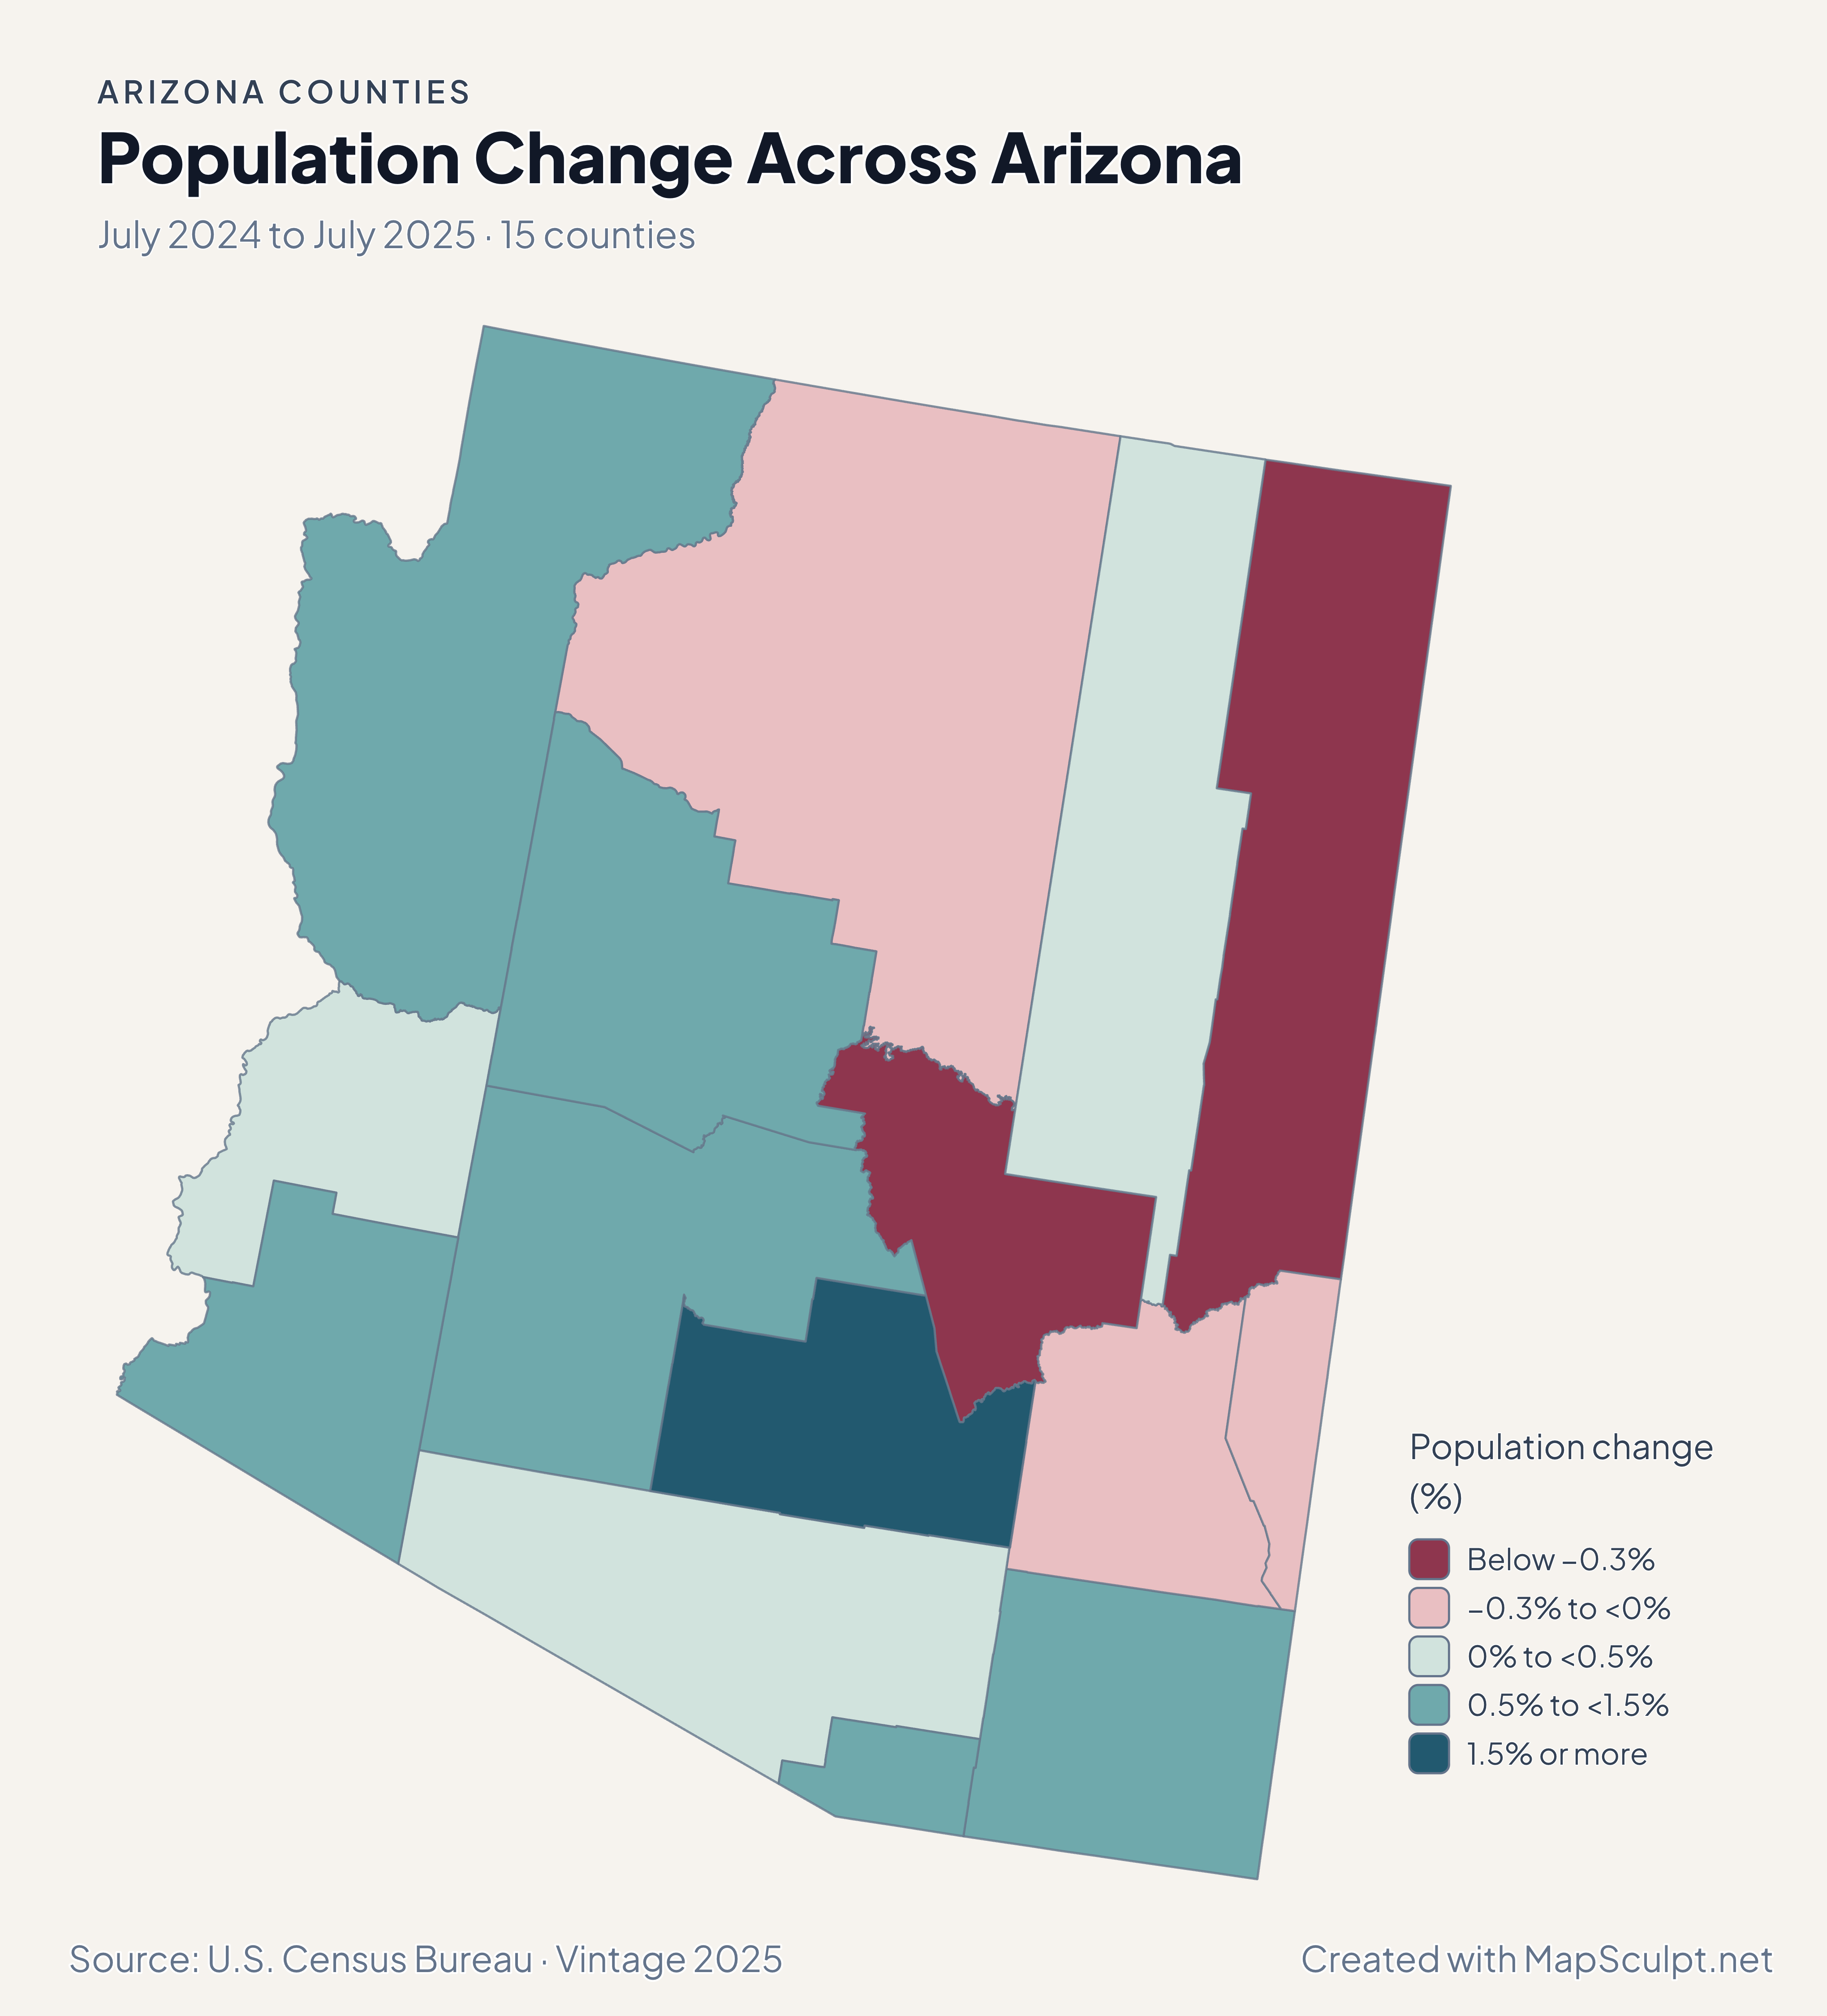
July 2024 to July 2025
See where county populations grew or declined over the same year. Percentage change shows the direction and scale relative to each county’s starting population.
EXPLORE STATE COUNTY MAPS
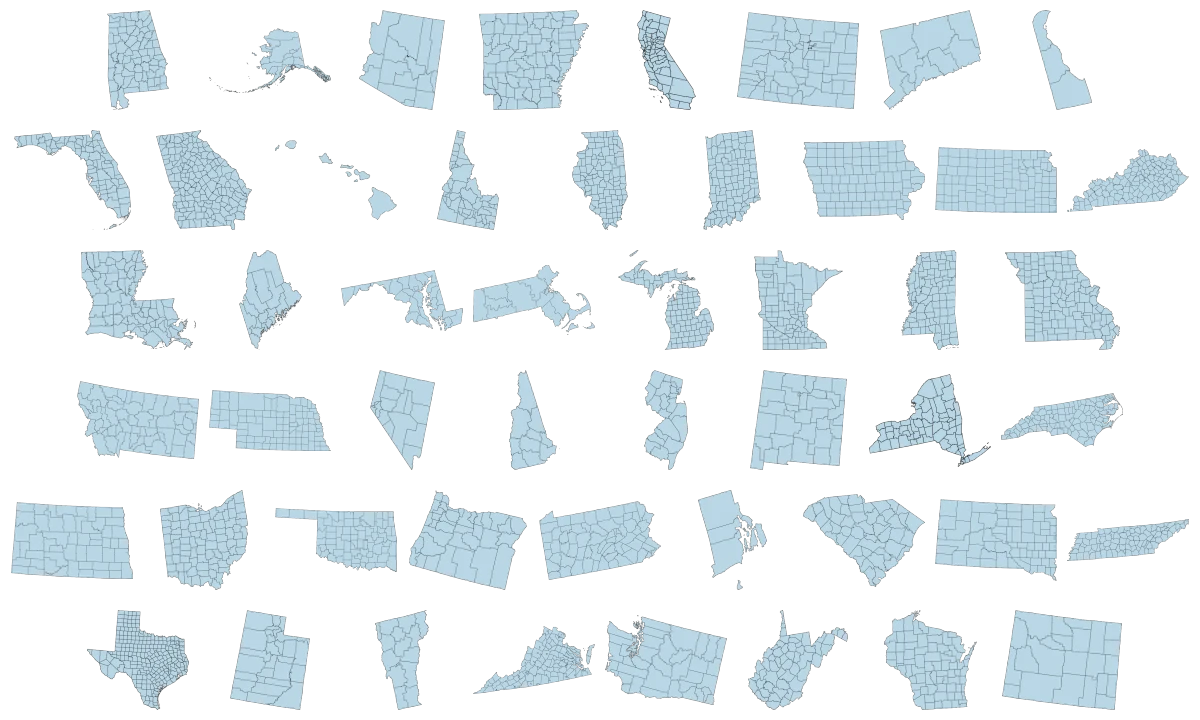
Explore county map editors for all 50 U.S. states. Choose a state to color counties individually, import data, and export your own map.
95 maps / 8 collections
Countries, regions and counties. Ready for your ideas.
States
Regions
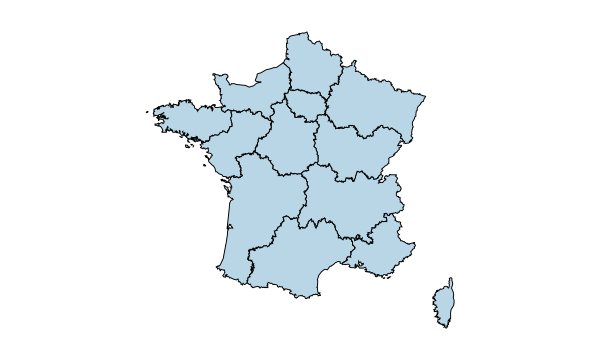
Regions
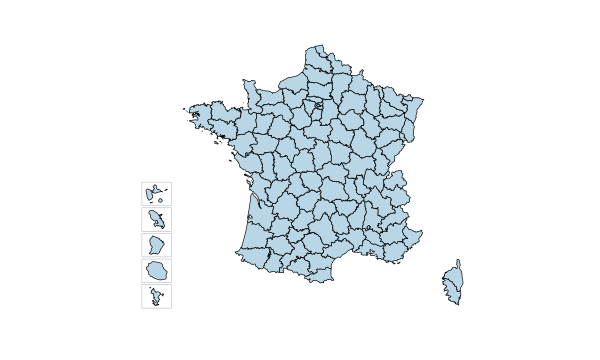
Departments
Regions
Autonomous communities
Regions
Voivodeships
Counties & Bucharest
Provinces
Provinces & Brussels
Districts & autonomous regions
Regions
Counties
Counties & Budapest
States
Cantons
Provinces
Regions
Regions
Counties
Counties
Counties
Counties
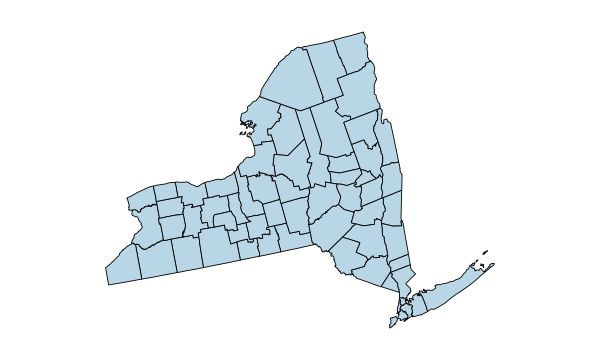
Counties
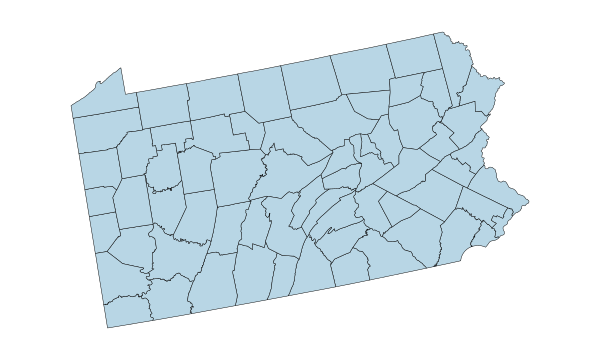
Counties
Counties
Counties
Counties
Counties
Counties
Counties
Counties
Counties
Counties
Counties
Counties
Counties
Counties
Counties
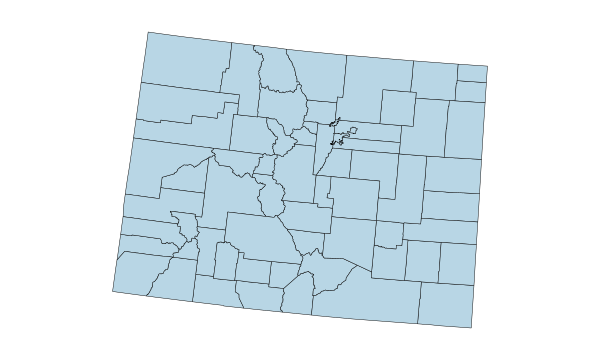
Counties
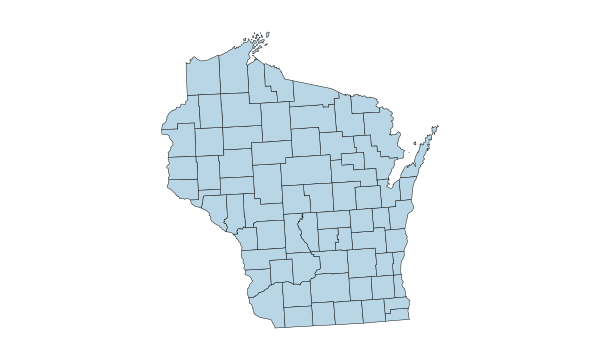
Counties
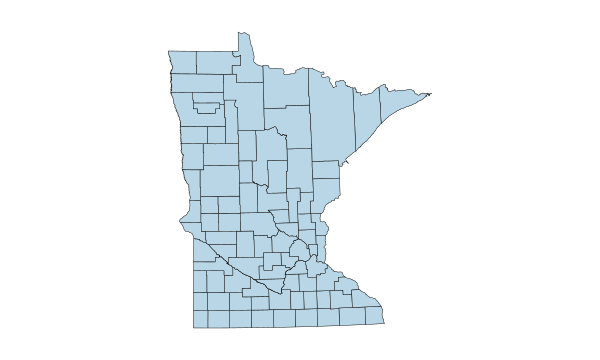
Counties
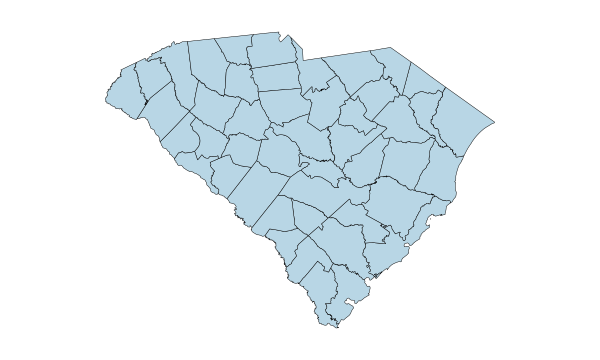
Counties
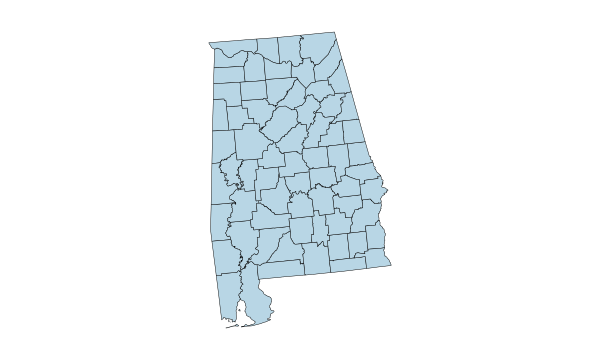
Counties
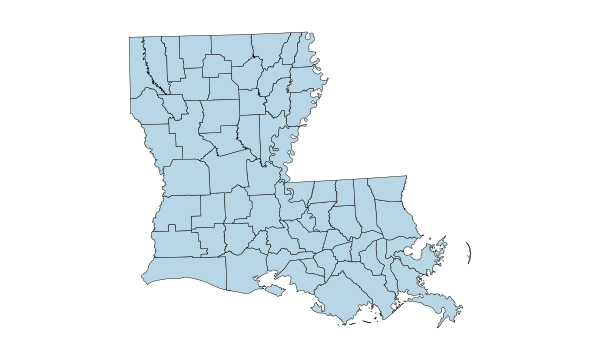
Parishes
Counties
Counties
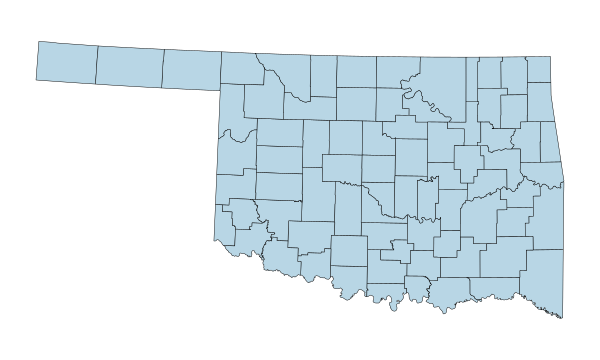
Counties
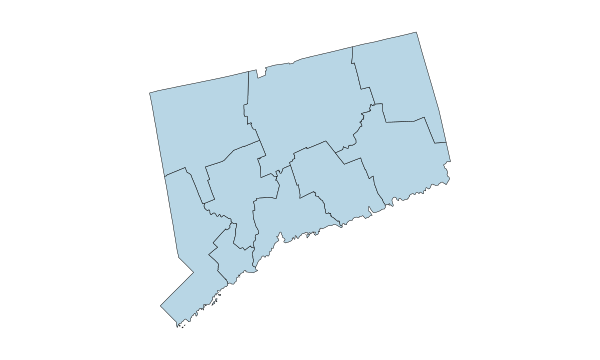
Planning regions
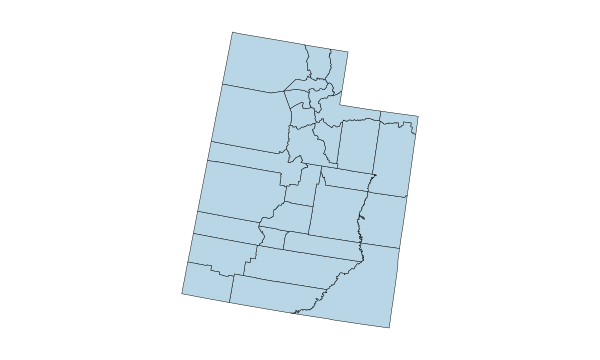
Counties
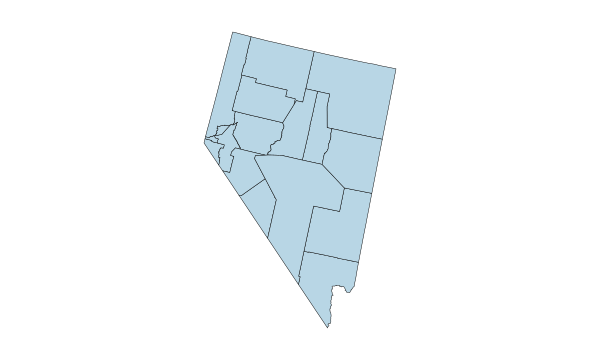
Counties & Carson City
Counties
Counties
Counties
Counties
Counties
Counties
Counties
Counties
Counties
Counties
Counties
Counties
Counties
Counties
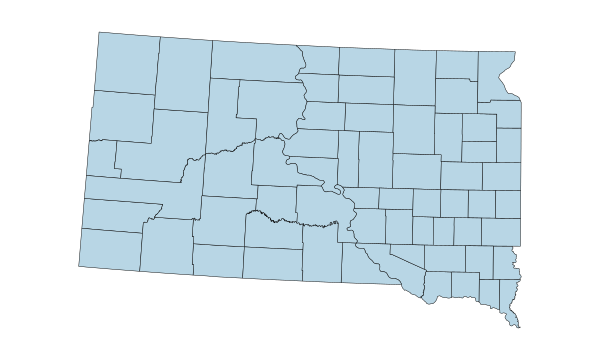
Counties
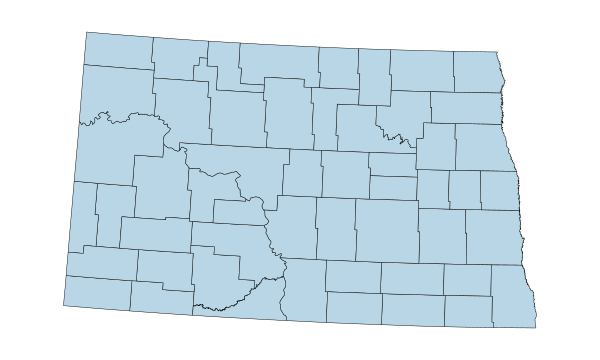
Counties
Boroughs & census areas
Counties
Counties
1–50 of 50 state maps
STATE GUIDE DIRECTORY
Find the geographic coverage, examples, and data tips for any state. You can also go straight to its editor.
67 counties
30 boroughs, municipalities and census areas
15 counties
75 counties
58 counties
64 counties
9 planning regions
3 counties
67 counties
159 counties
5 counties
44 counties
102 counties
92 counties
99 counties
105 counties
120 counties
64 parishes
16 counties
23 counties + independent Baltimore city (24 units)
14 counties
83 counties
87 counties
82 counties
114 counties + 1 independent city (115 units)
56 counties
93 counties
16 counties + Carson City (17 units)
10 counties
21 counties
33 counties
62 counties
100 counties
53 counties
88 counties
77 counties
36 counties
67 counties
5 counties
46 counties
66 counties
95 counties
254 counties
29 counties
14 counties
95 counties + 38 independent cities (133 units)
39 counties
55 counties
72 counties
23 counties
HOW IT WORKS
Open the county editor for your state from the catalogue.
Assign colors manually or import a CSV. Many county editors support numerical values and categories. Review how your rows match before applying them.
Edit the title and legend, choose a visual style, and credit your data source.
Preview the layout and download a high-resolution PNG for your report, slide deck, or website.
COUNTY GEOGRAPHY & CSV
The Census treats certain areas as county equivalents, including Connecticut’s planning regions and Louisiana’s parishes. For a CSV join, use official five-digit Census GEOIDs that match the map’s boundaries. Keep them as text so a code like 01001 retains its leading zero.
Yes. Every state has a standalone editor. The directory also links to a guide with the geographic coverage and examples for each state.
Yes. Open a state’s county editor, select a color, and apply it to the counties or county equivalents you want to show.
Save the data as a CSV and include a column of five-digit Census GEOIDs. Keep leading zeroes, choose the correct region and value columns, and check any unmatched rows before applying the import.
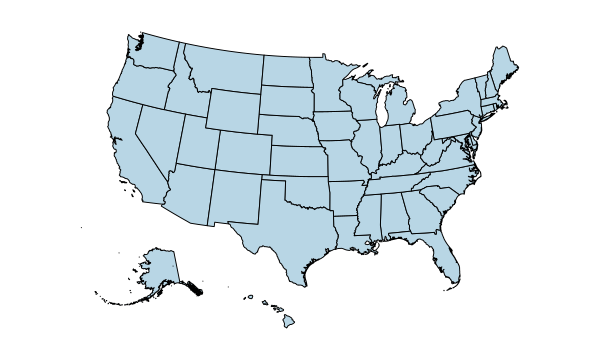
A state map treats each state as one area. A county map breaks the geography into counties and county equivalents, so individual areas within a state can have their own values or colors.
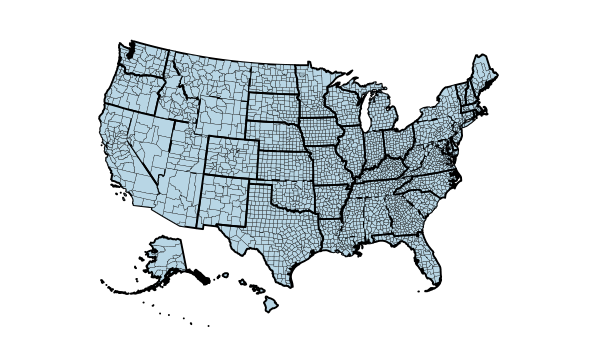
Use the nationwide U.S. Counties editor to map counties from multiple states on a single canvas. The standalone state editors are designed for one state at a time.
Yes. All 50 state county editors are available in Spanish. When a detailed guide has not yet been published in Spanish, the directory identifies its English version.
Yes. Export a high-resolution PNG and insert it into your slides or document. Check the title and legend at the size your audience will see.
START WITH YOUR STATE