Skip to content
MapSculpt

GEOGRAPHIC MAP MAKER / IDAHO

Idaho
Counties Map Maker

Compare population growth around Boise, in the northern panhandle and across eastern Idaho. All 44 counties are available for coloring, data joins and PNG export.

Free online editor · No sign-up required

44counties
individually editable

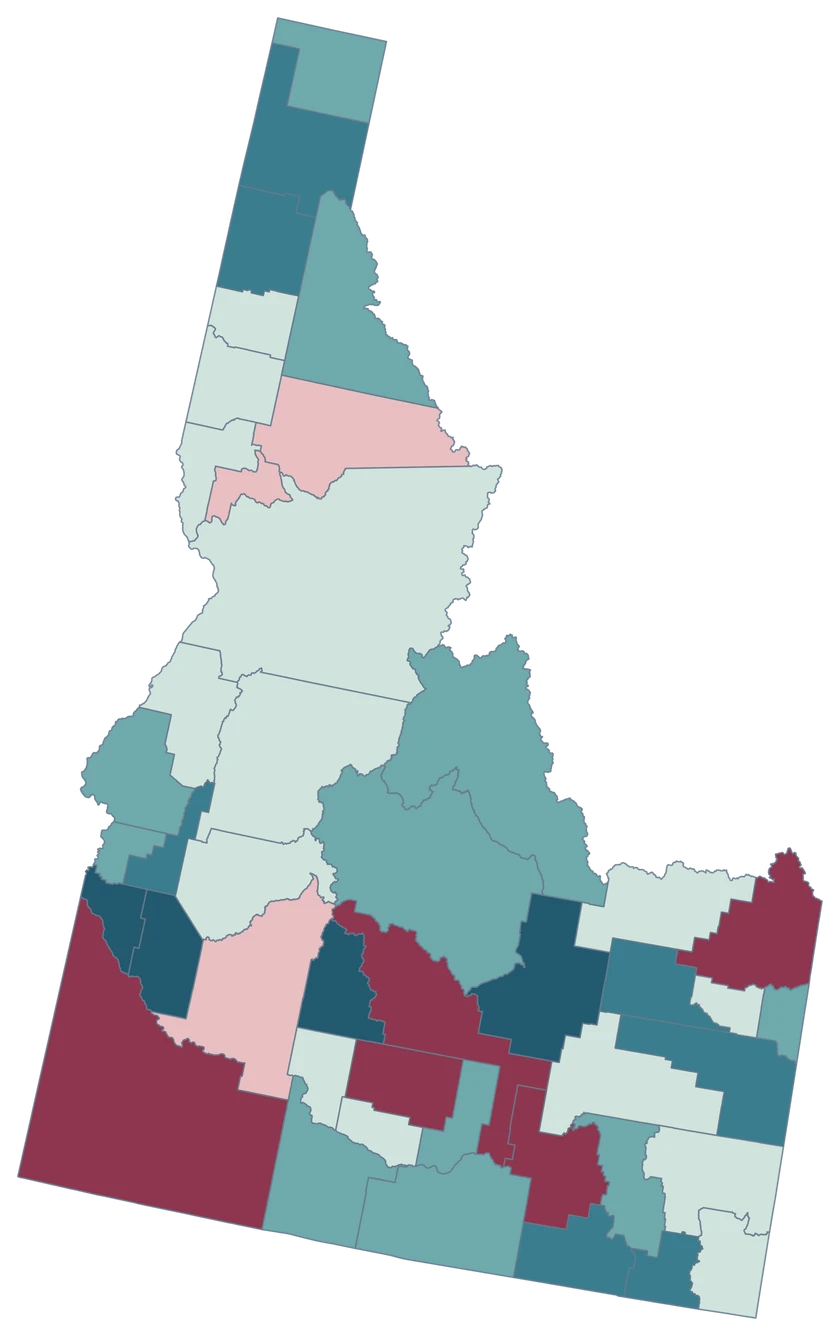
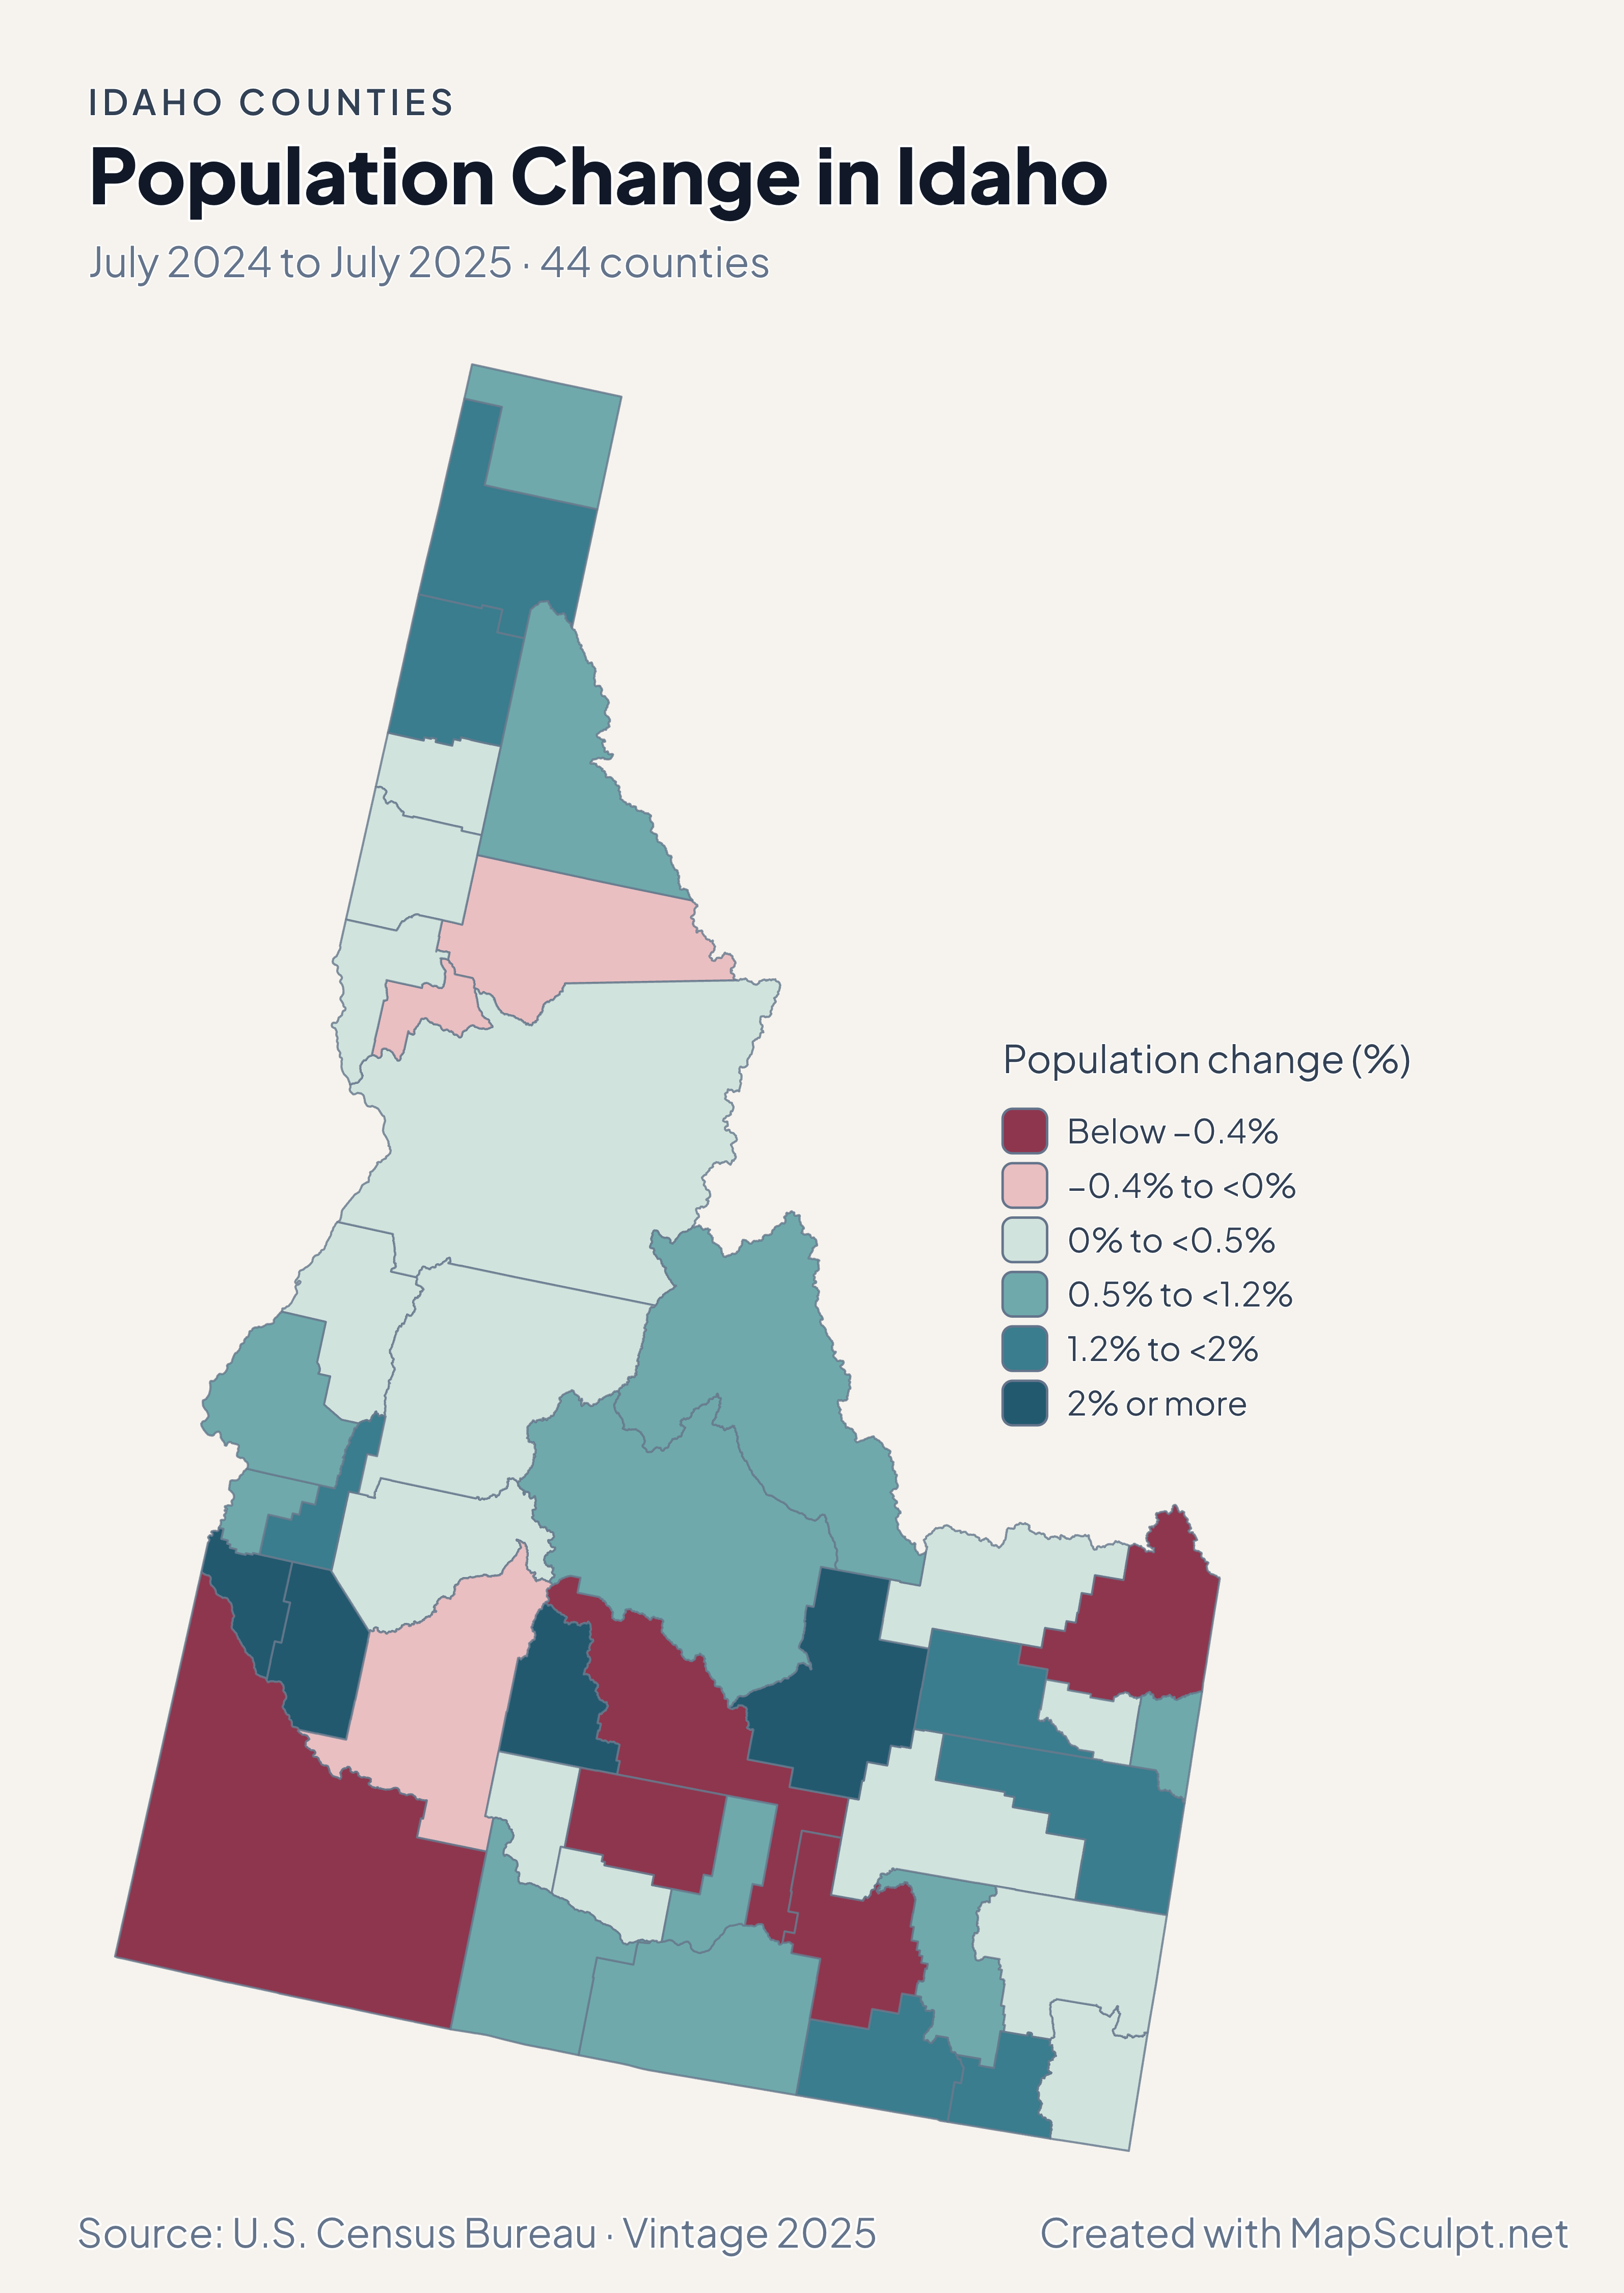
Population Change in Idaho

July 2024 to July 2025 · 44 counties

Idaho county choropleth of population change, including Canyon, Ada, Kootenai, Bonneville.

Population change (%)

  • Below −0.4%
  • −0.4% to <0%
  • 0% to <0.5%
  • 0.5% to <1.2%
  • 1.2% to <2%
  • 2% or more
U.S. Census Bureau · Vintage 2025Download complete PNG Percentage change uses July 2024 population as its starting point.

KNOW YOUR GEOGRAPHY

The northern panhandle and the Snake River Plain

Idaho’s outline includes its narrow northern panhandle, with Boundary, Bonner and Kootenai independently selectable. The same map extends south to the Snake River Plain.

City records cover a different layer. Ada and Canyon are county-level choices for the Boise area, and Bonneville can be mapped separately in the east.

Browse all county GEOIDs ↗

2025 Census boundaries

OFFICIAL DATA

Population and housing from the panhandle to the south

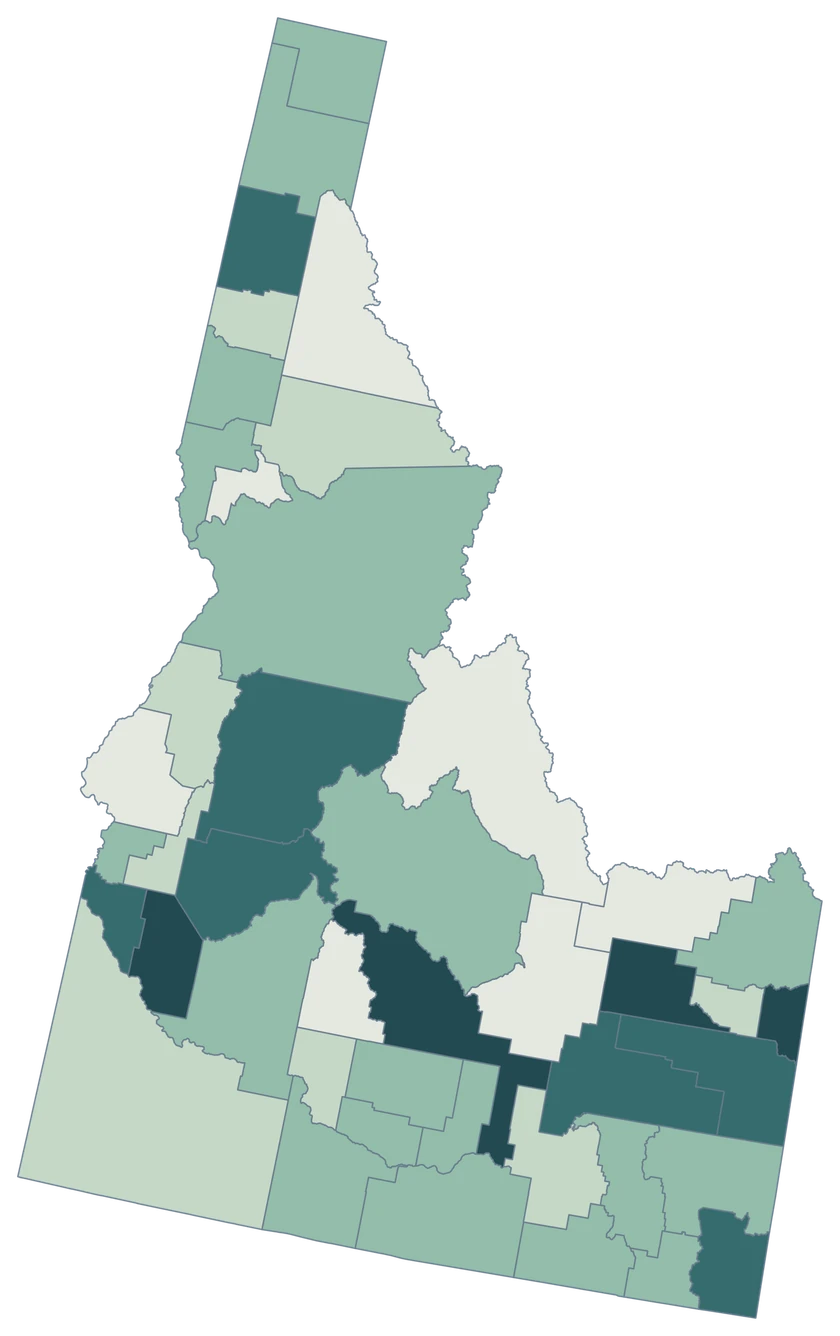
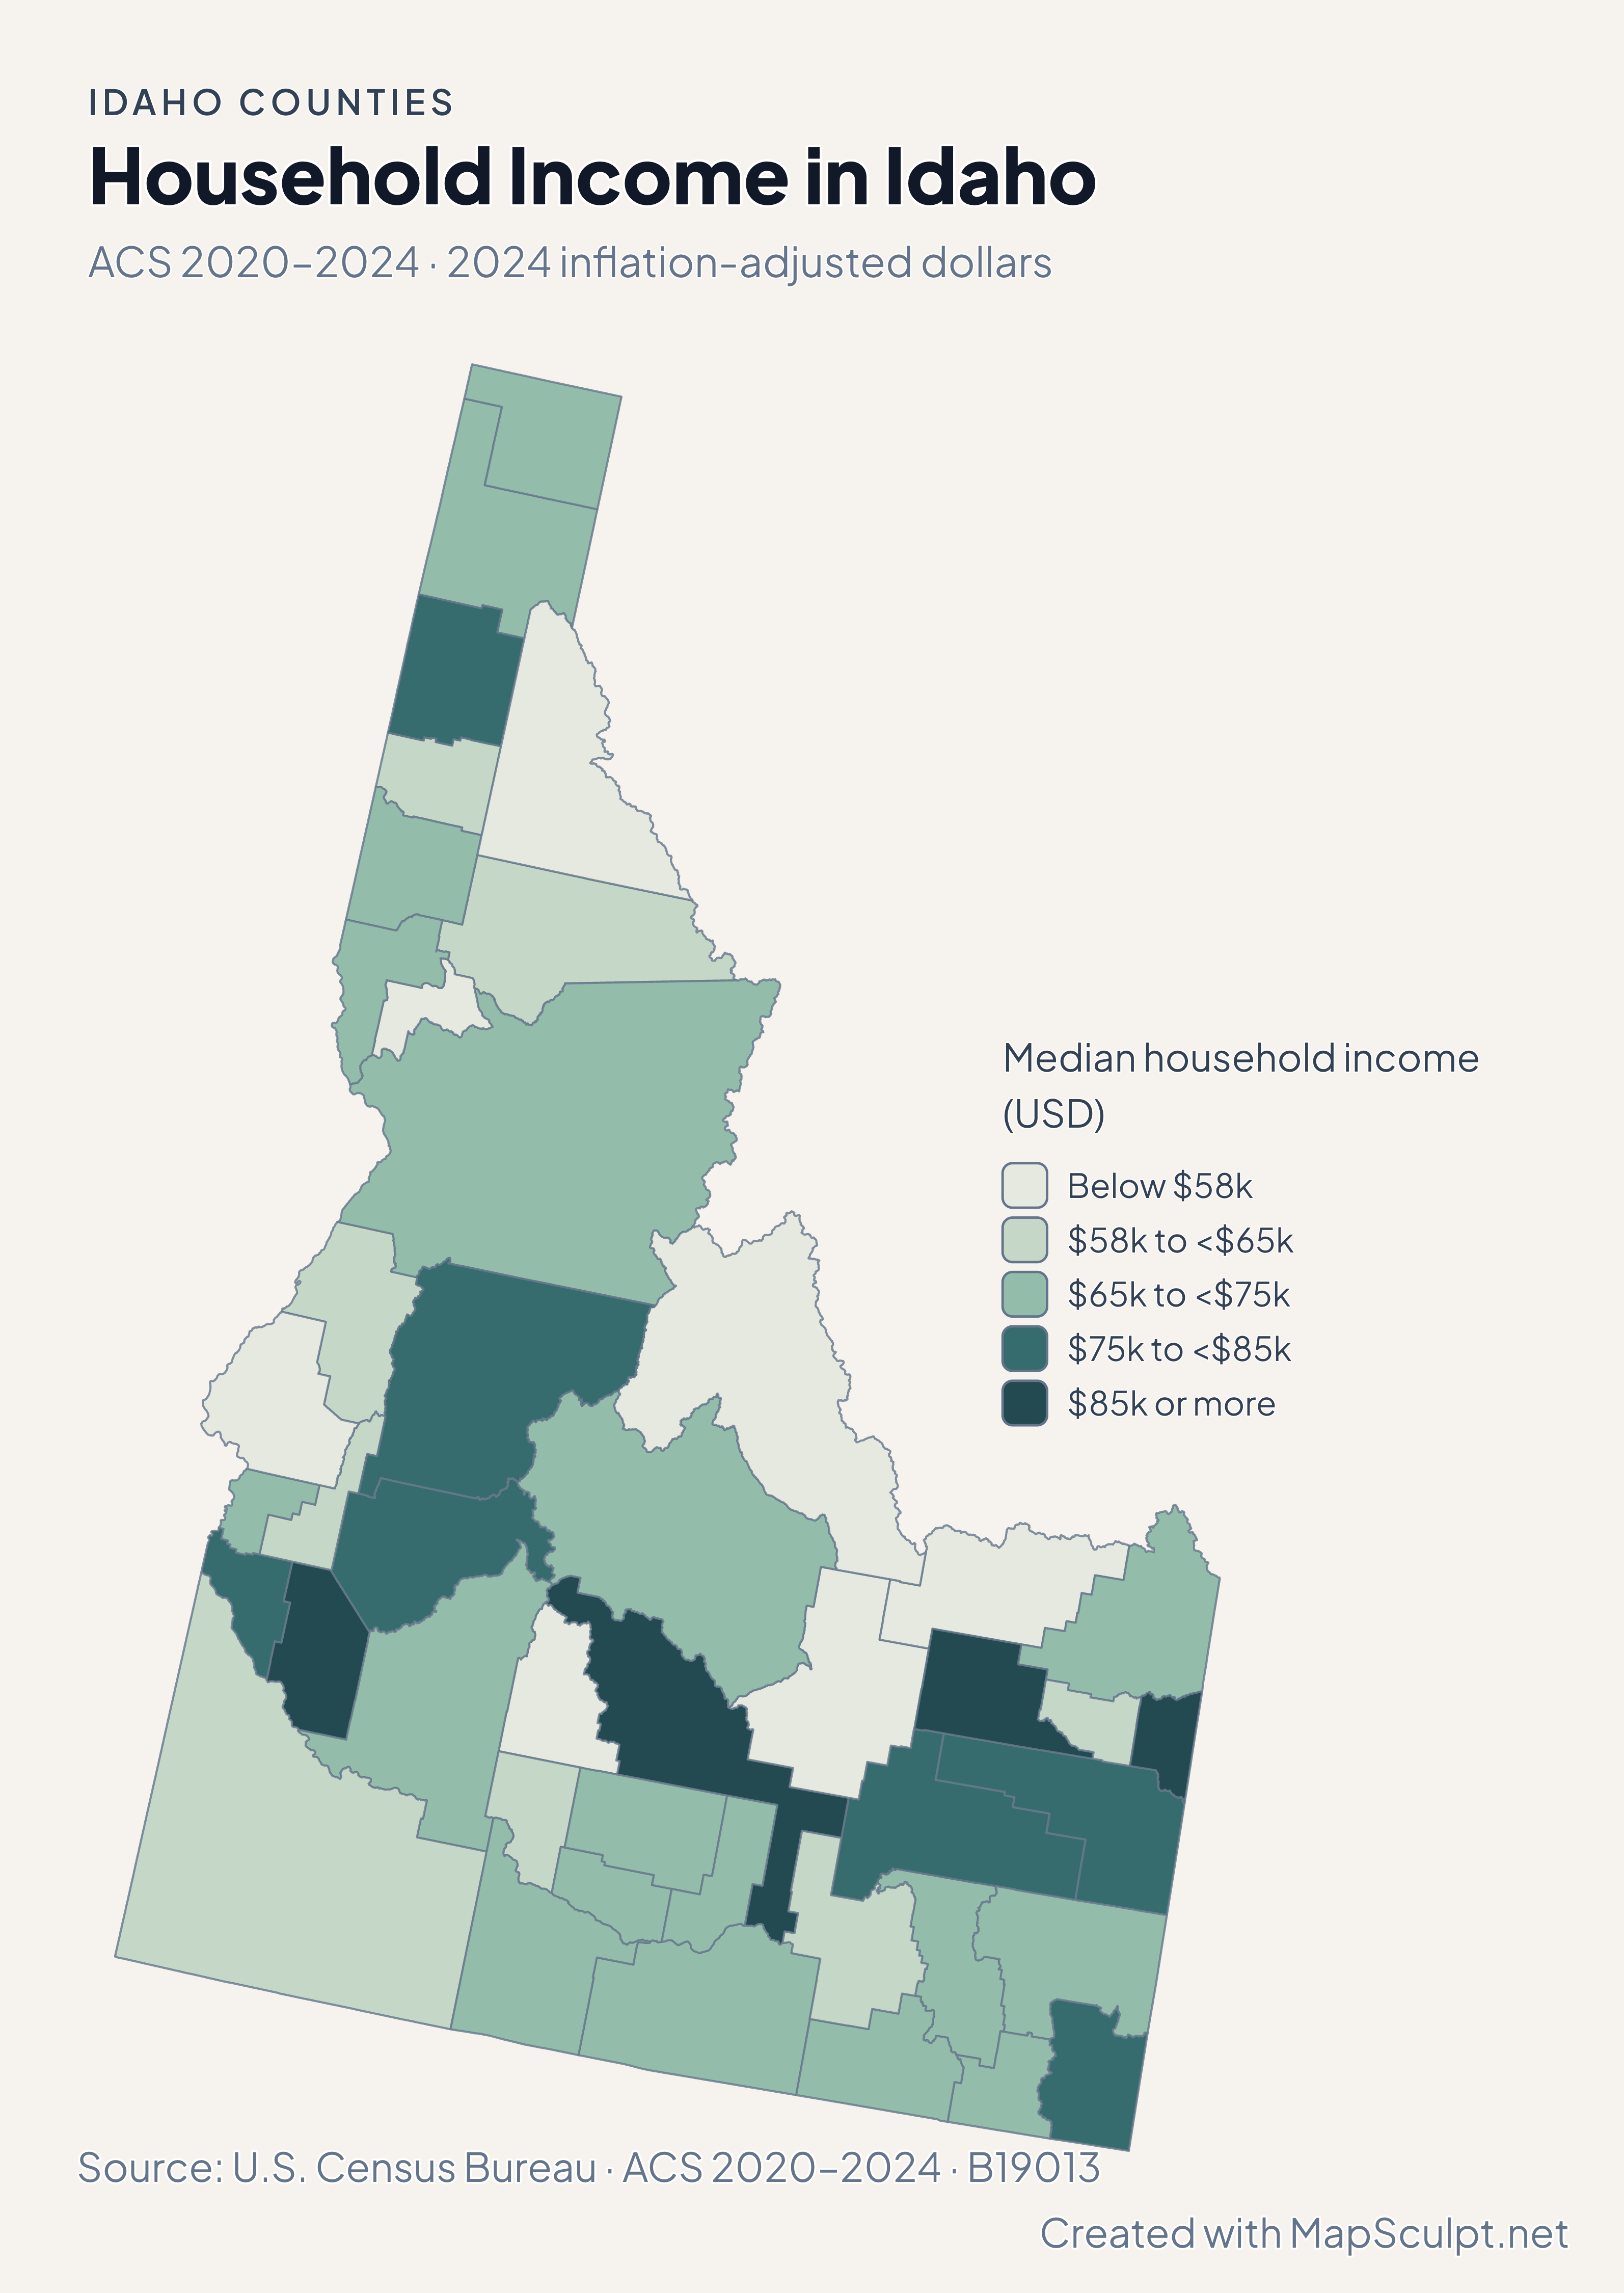
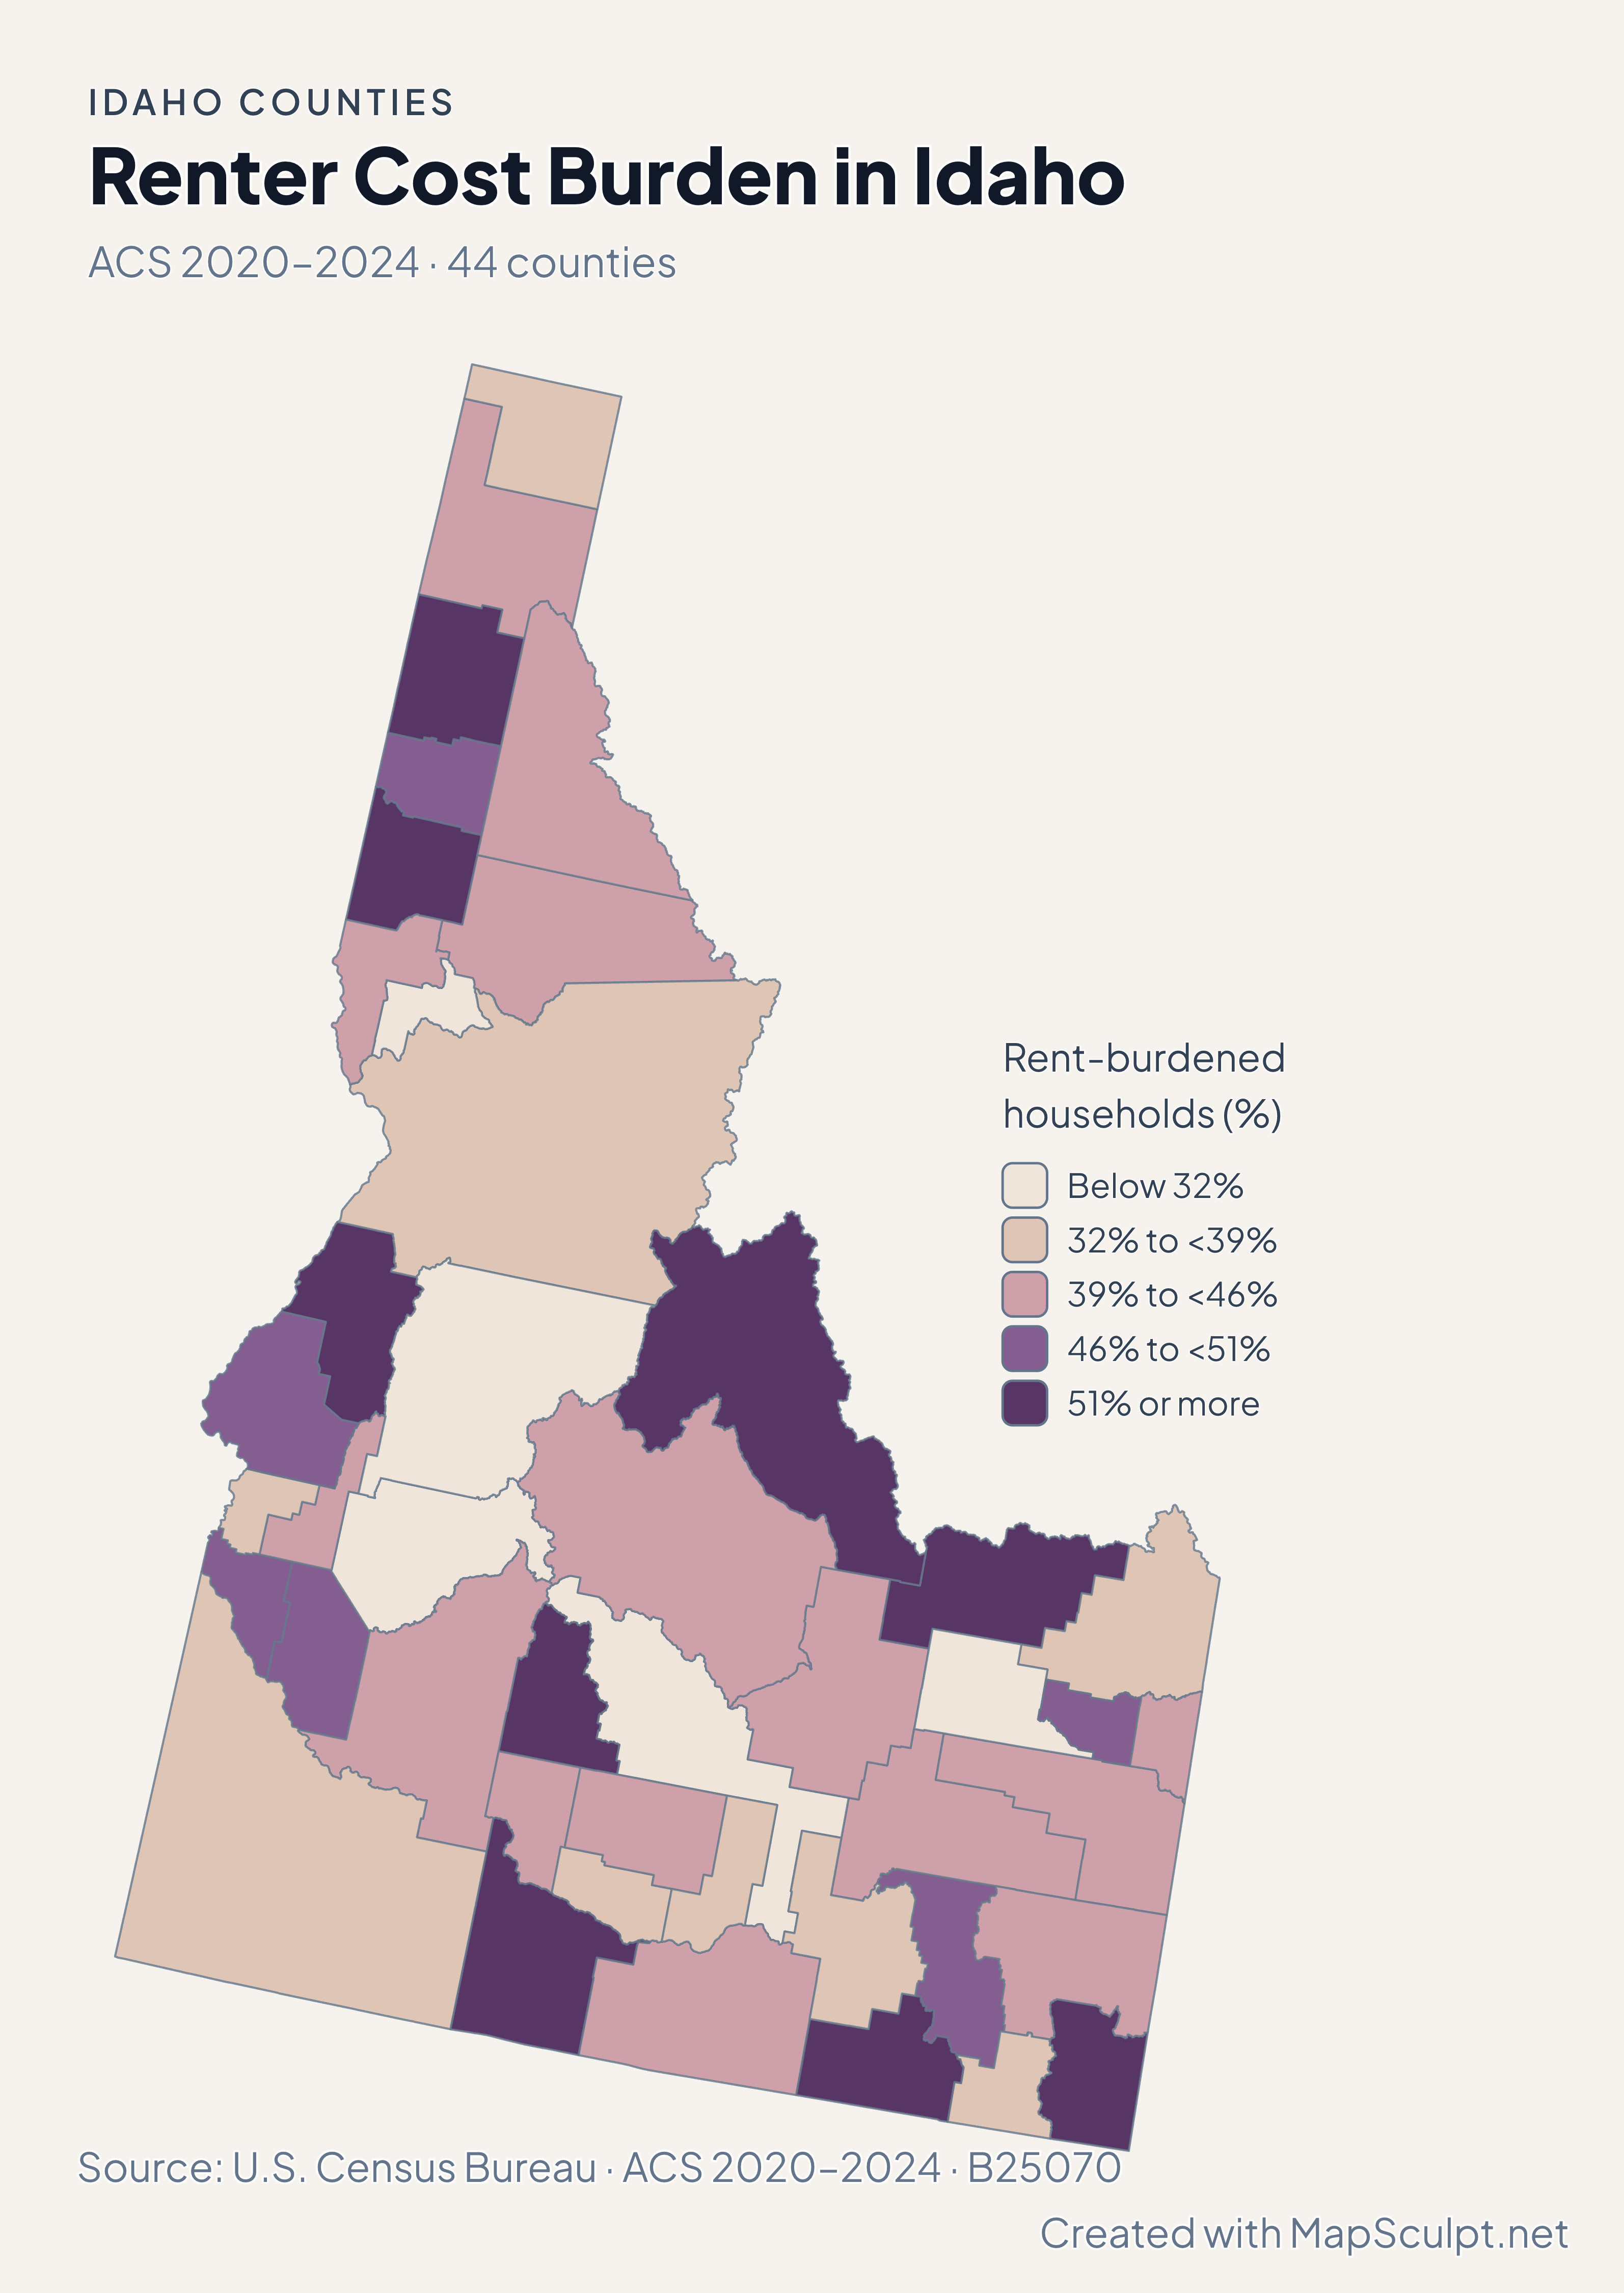
Population and net domestic moves compare July 2024 and July 2025. Household income and renter costs use the 2020–2024 American Community Survey.

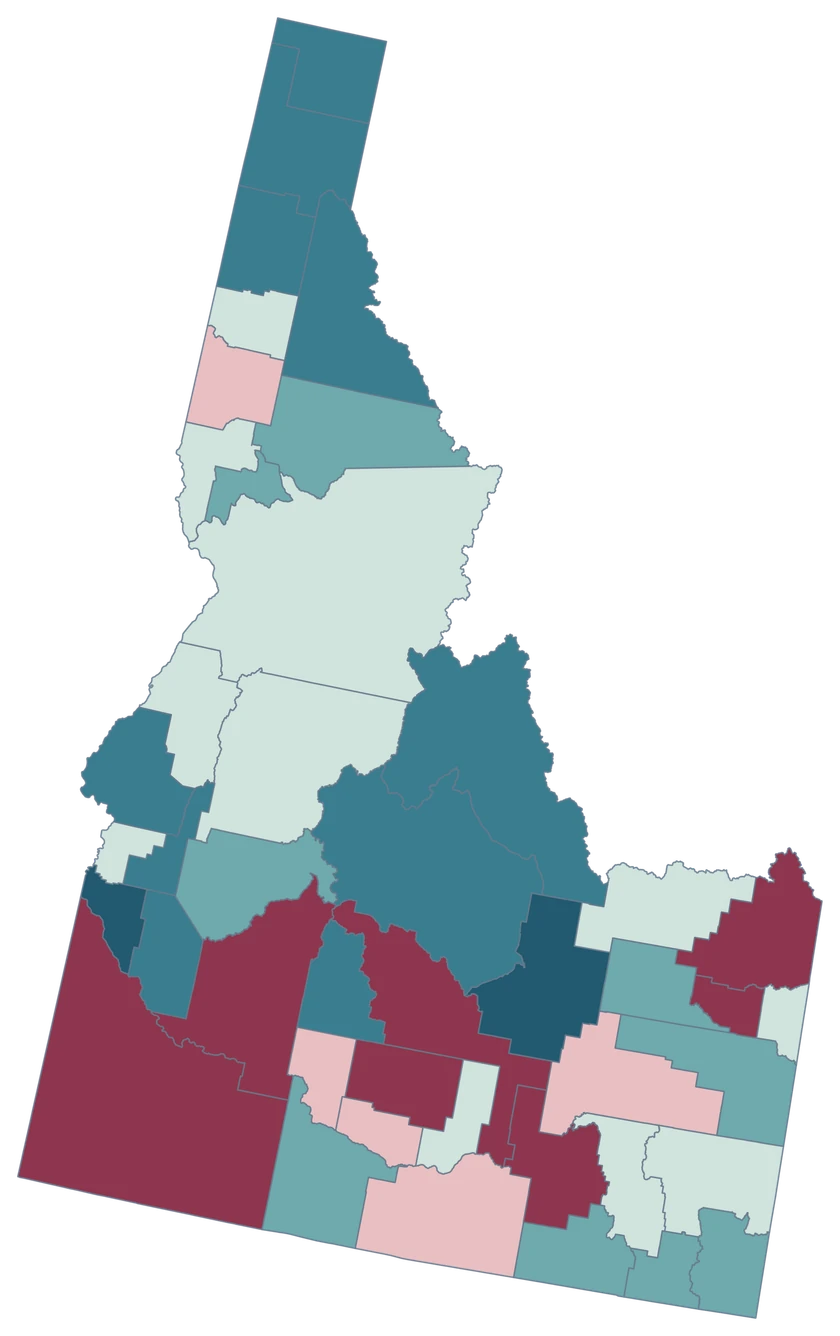
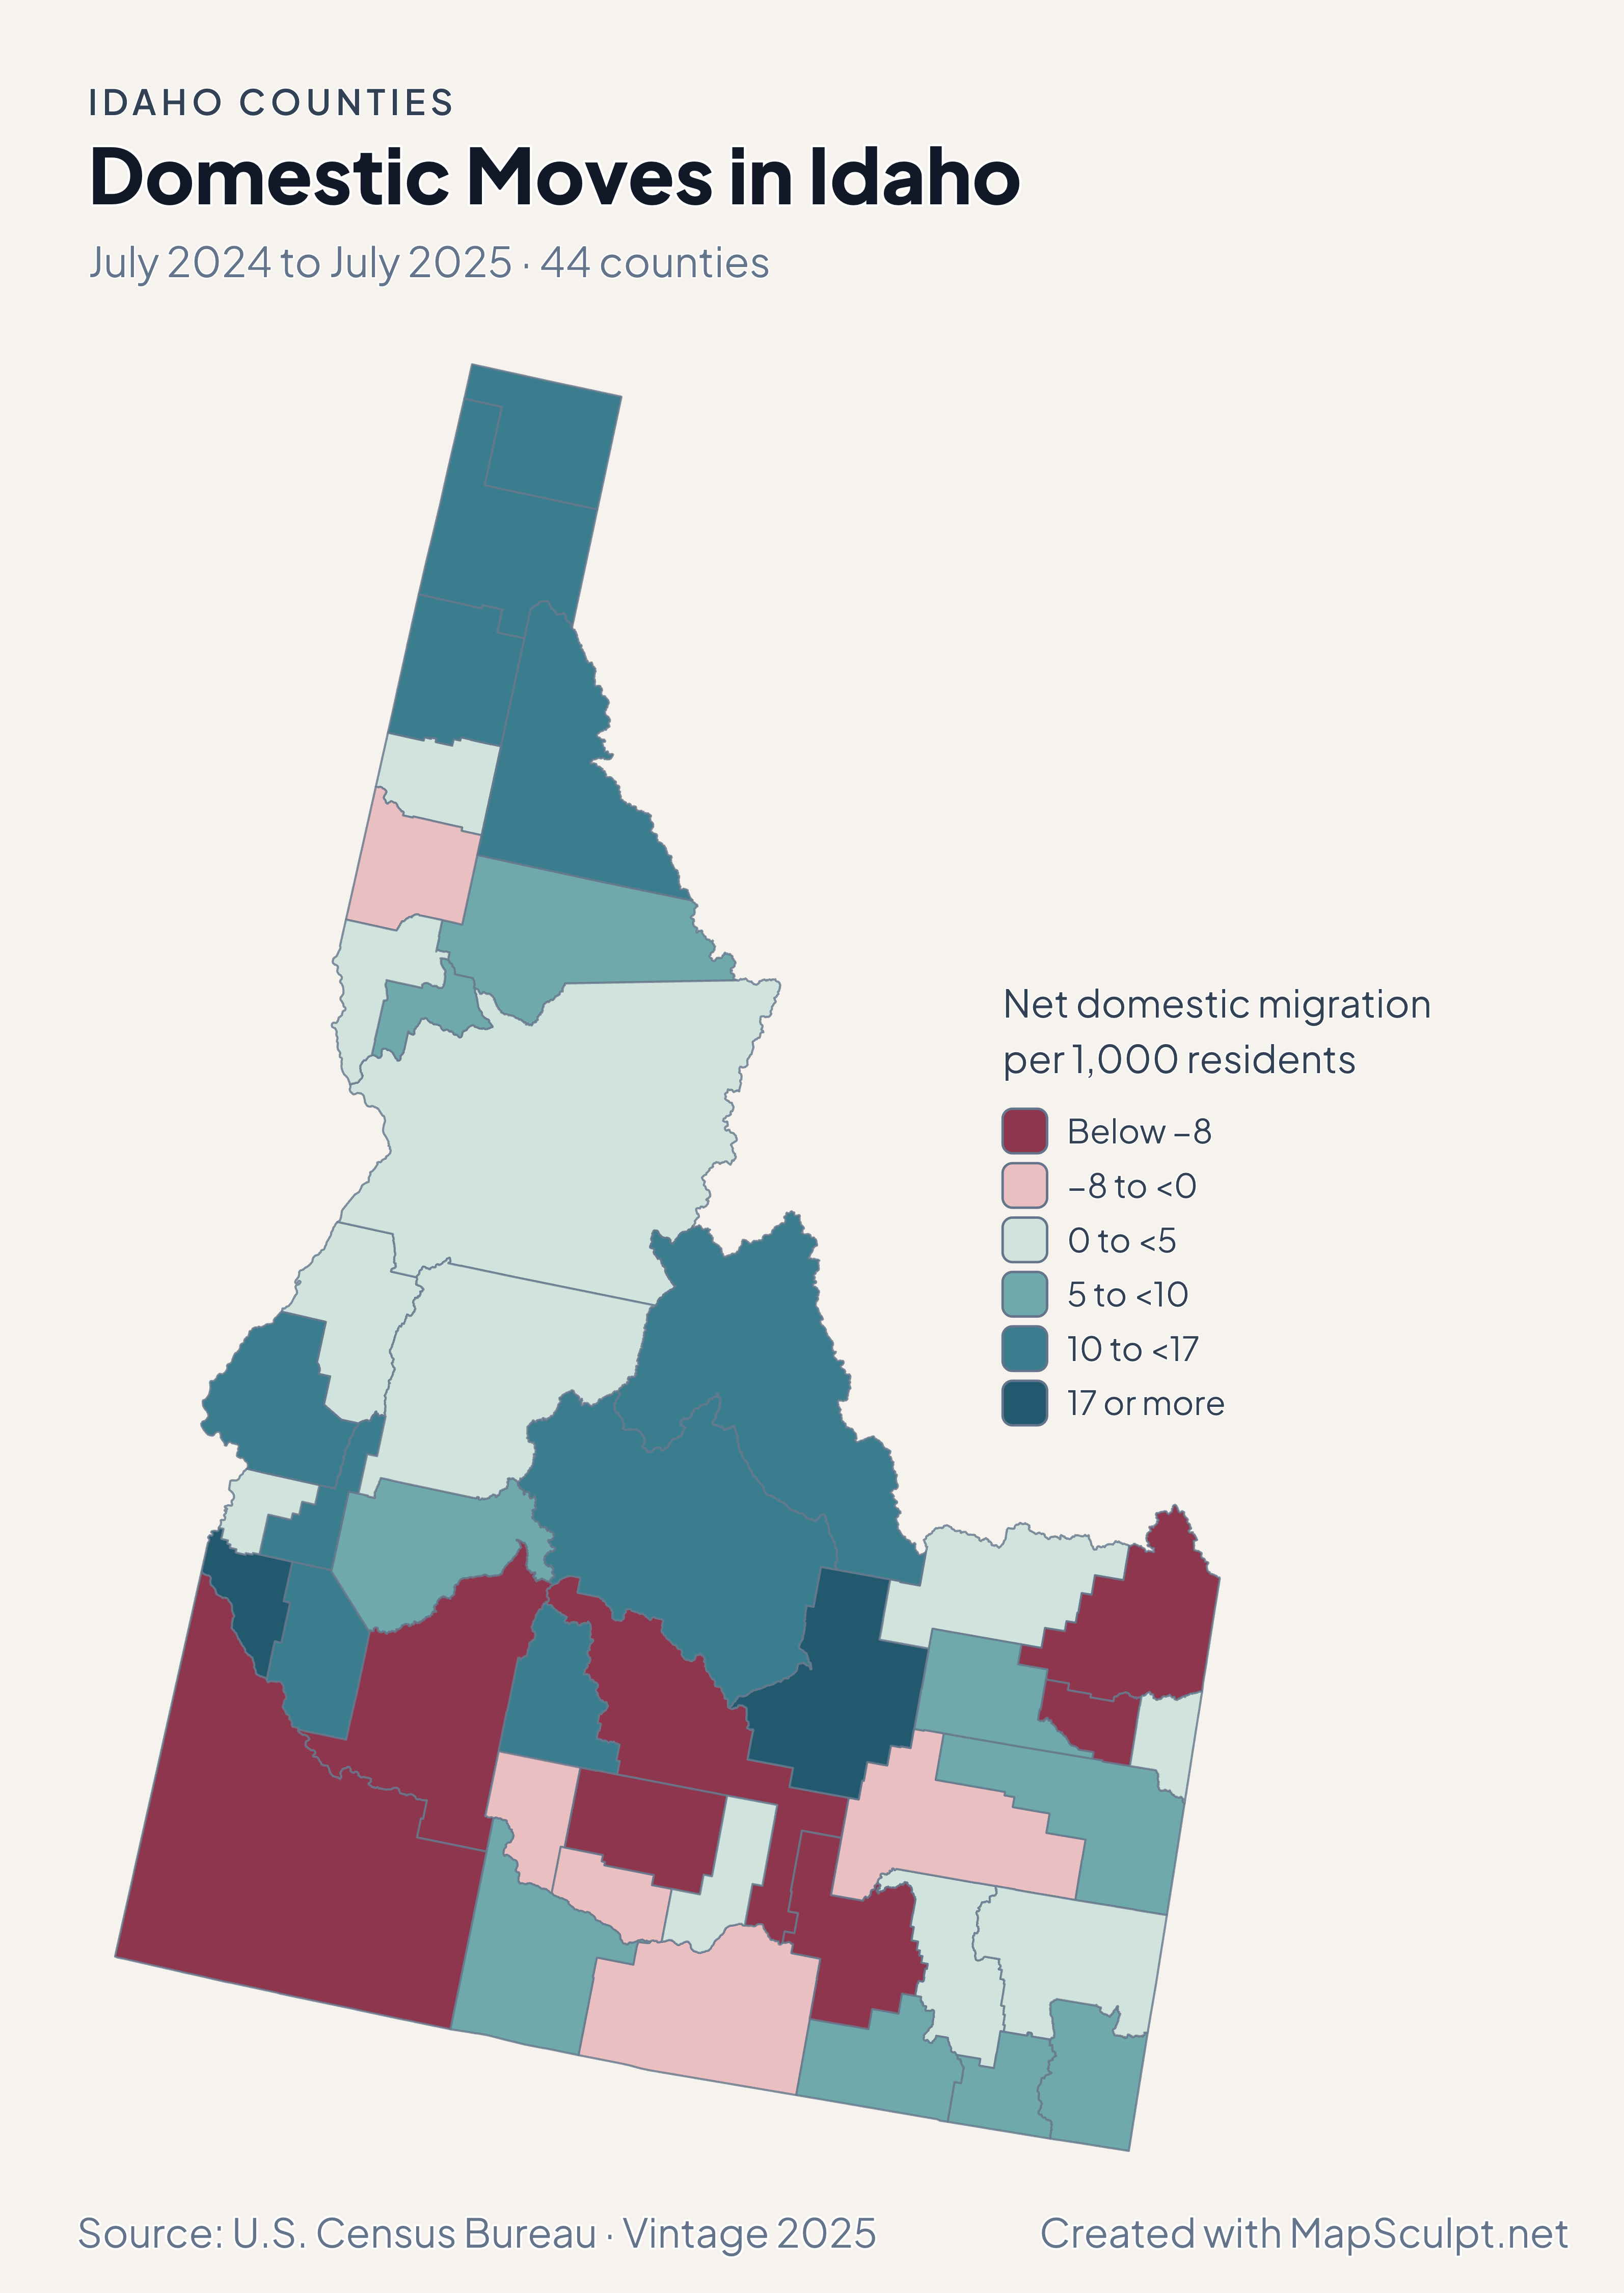
Idaho county choropleth of domestic moves, including Kootenai, Boundary, Canyon, Madison.

July 2024 to July 2025 · 44 counties

Panhandle counties gained from domestic moves.

Kootenai recorded +16.63 net domestic movers per 1,000 residents and Boundary +10.70. Canyon recorded +20.95 and Madison recorded −14.08.

Net domestic migration per 1,000 residents

  • Below −8
  • −8 to <0
  • 0 to <5
  • 5 to <10
  • 10 to <17
  • 17 or more

U.S. Census Bureau · Vintage 2025

Download complete PNG

Canyon grew 2.87% and Ada 2.04%. Kootenai grew 1.84% in the panhandle and Bonneville grew 1.48% in eastern Idaho. All rates compare July 2024 with July 2025. See the Census estimates ↗

MAKE IT YOURS

From county data to a finished map.

  1. Open the Idaho editor

    Start with all 44 county features.

  2. Match county records

    Use the five-digit GEOID, such as 16001. Review matches before applying a color scale.

  3. Classify by measurement

    Choose intervals and colors that make the units and direction of change easy to read.

  4. Export the finished map

    Include the source, period and legend in a downloadable PNG.

TRY CSV IMPORT

Try six Idaho records.

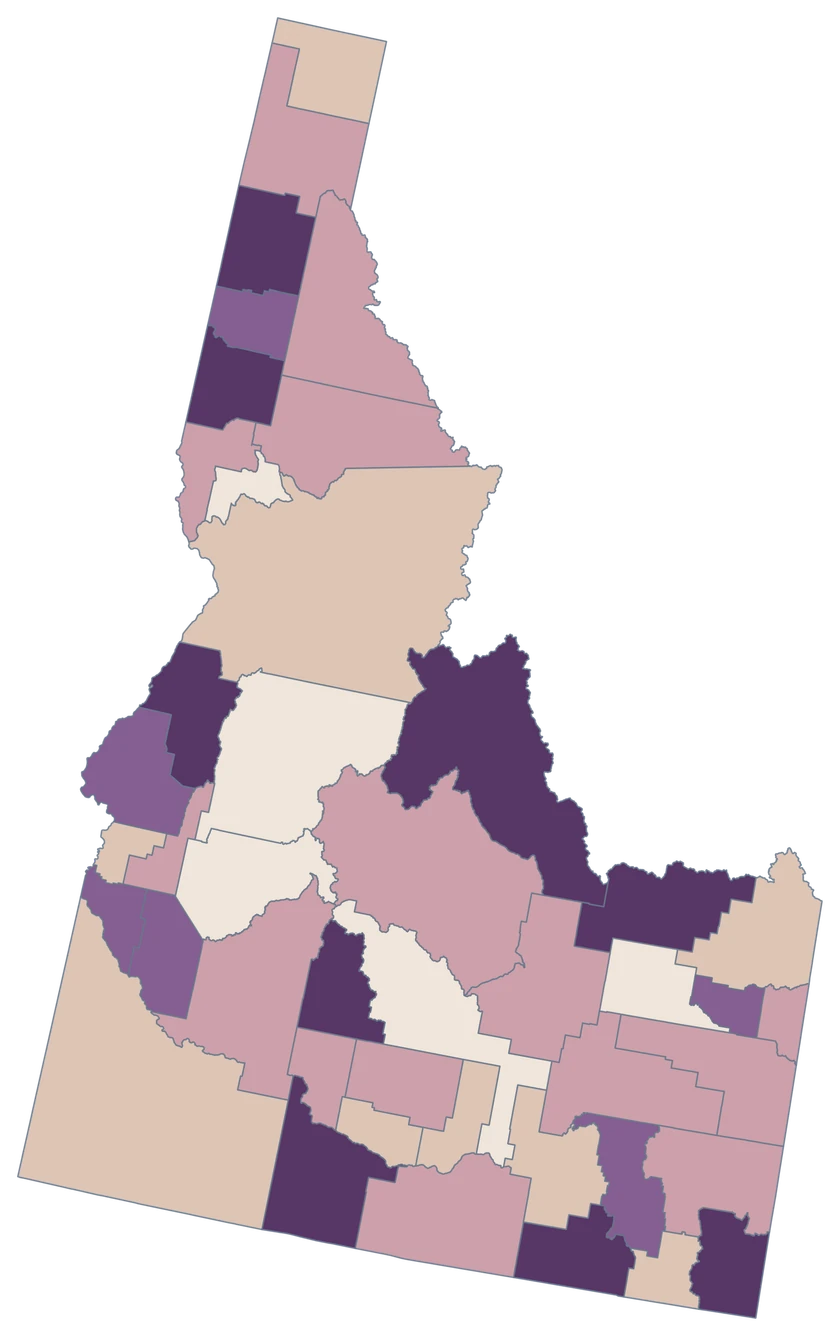
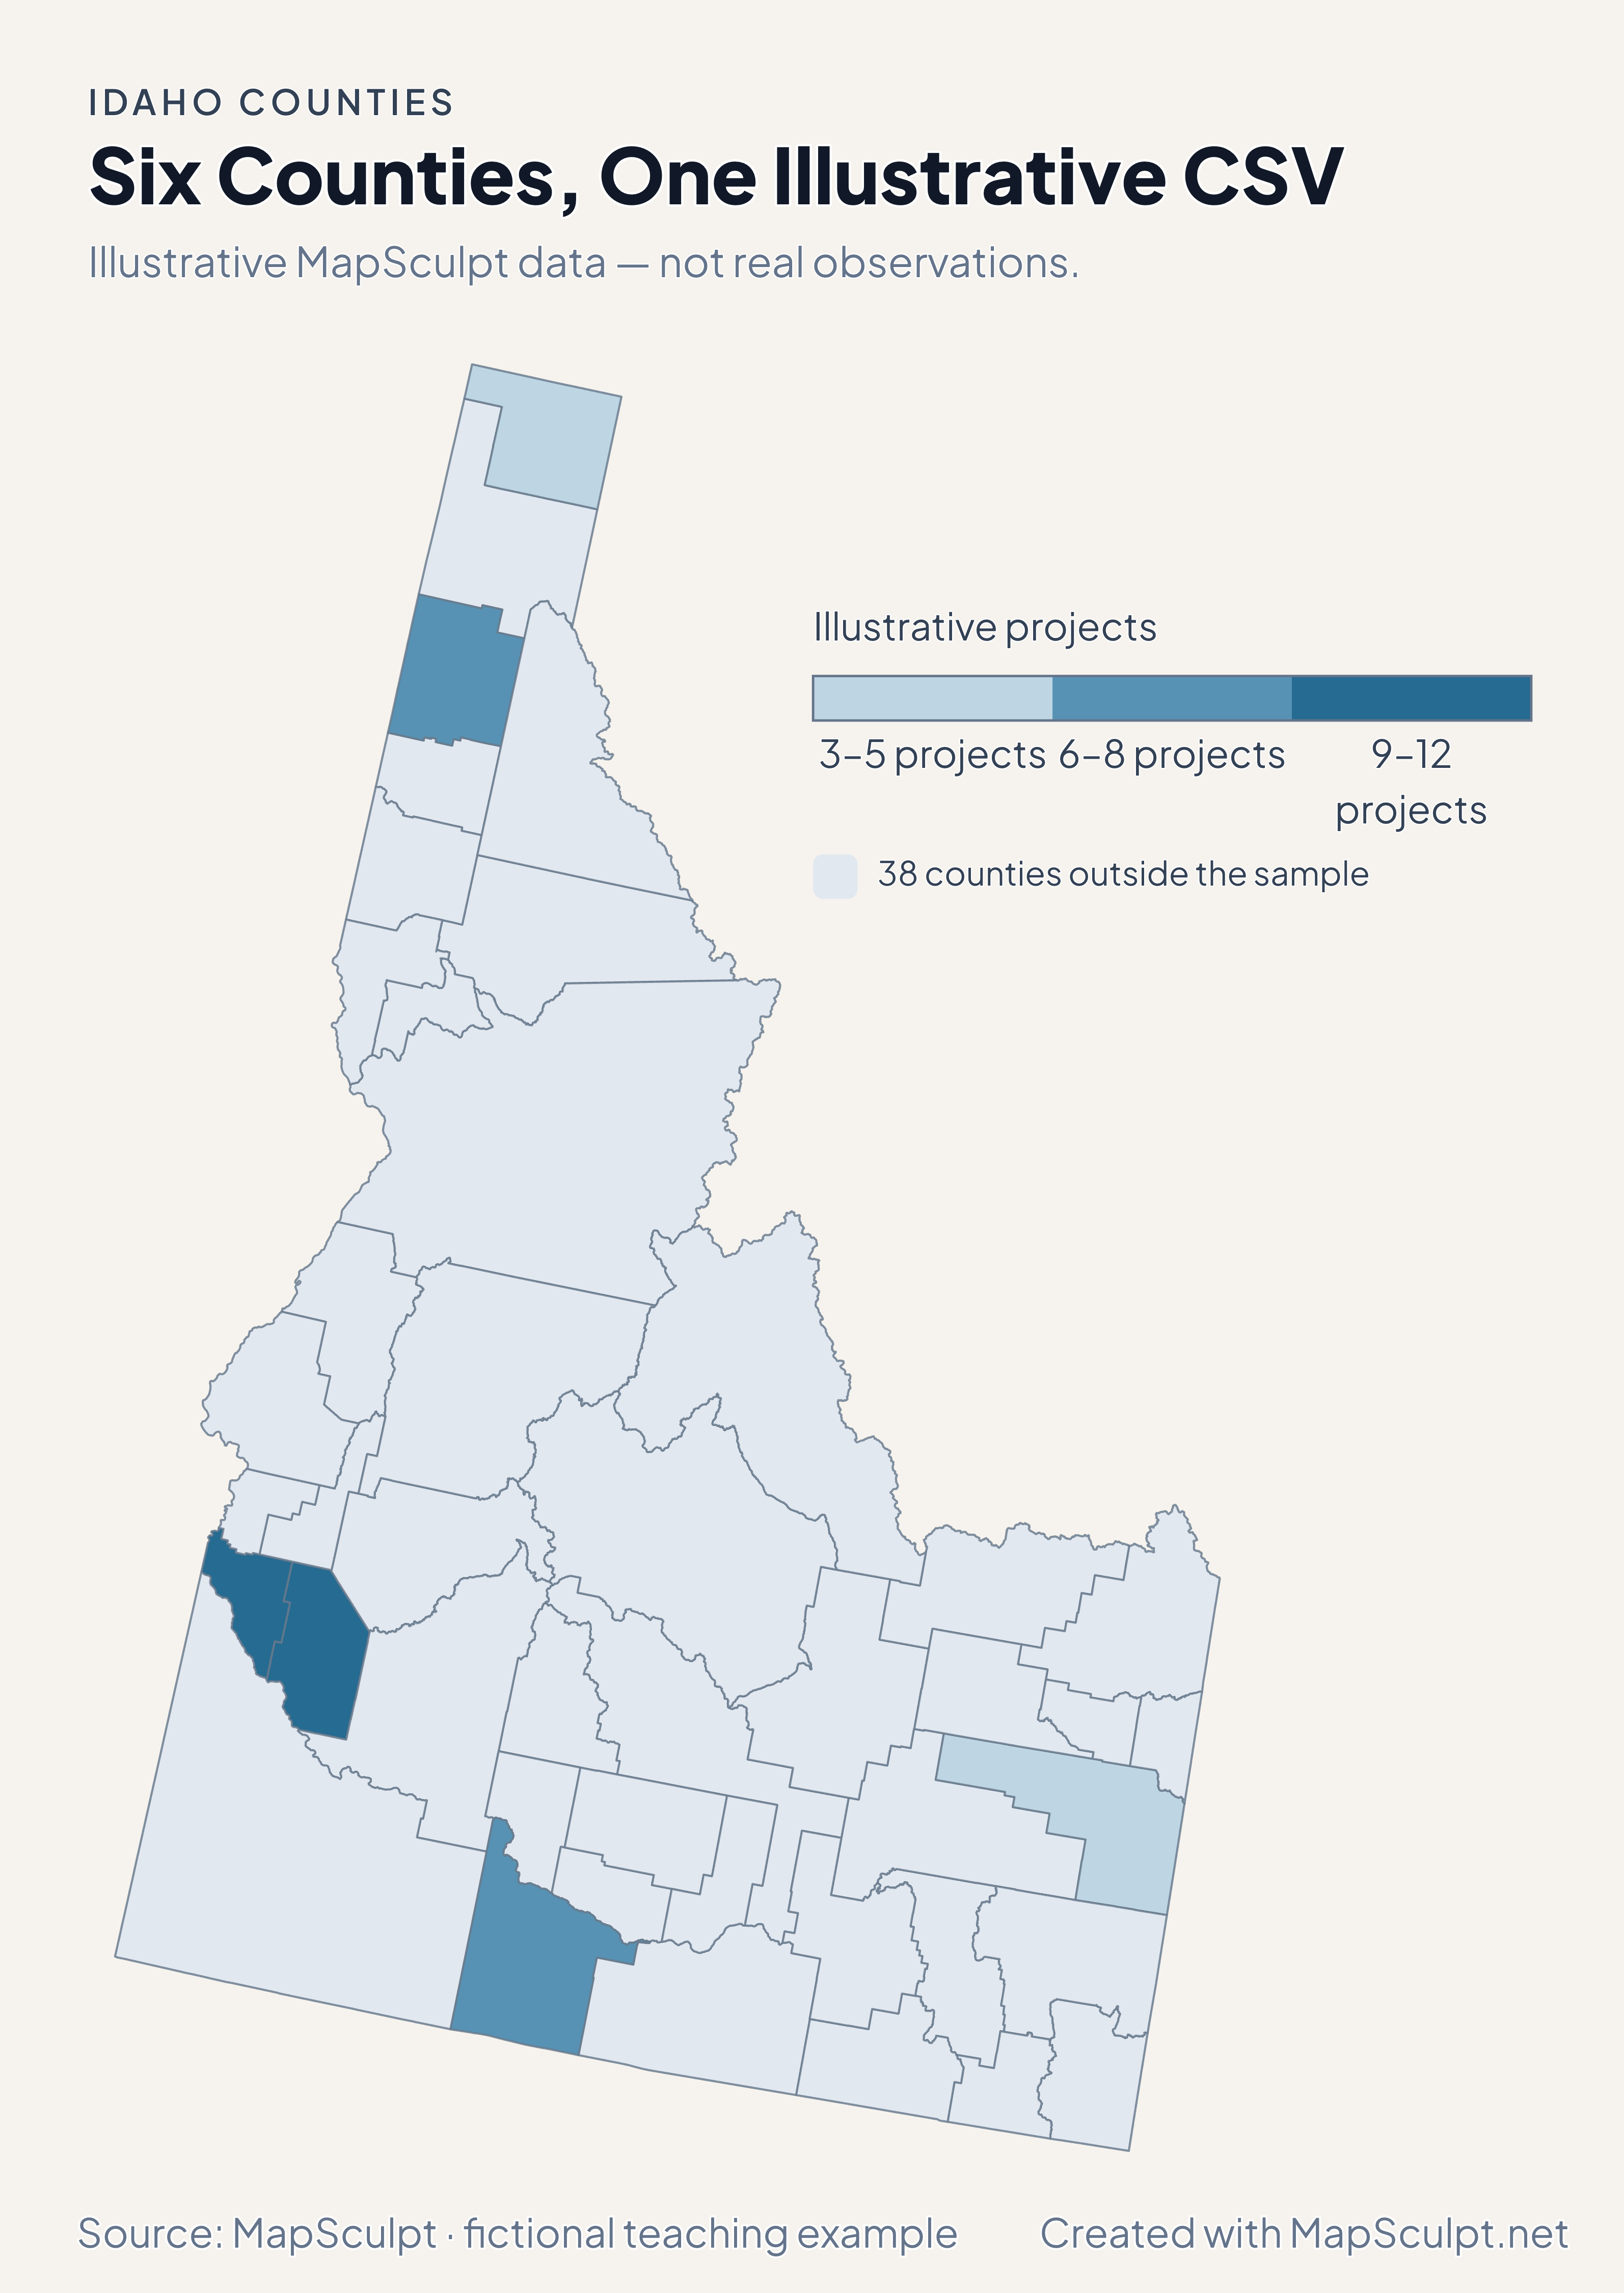
Import the fictional project counts and use breaks of 3, 6, 9 and 12. The remaining 38 counties stay neutral.

Illustrative MapSculpt data — not real observations.
CountyGEOIDProjects
Ada County1600112
Canyon County160279
Kootenai County160557
Bonneville County160193
Twin Falls County160838
Boundary County160215

Keep five-digit GEOIDs as text. The sample uses 16001 for Ada County.

Download illustrative CSV ↓

Six Counties, One Illustrative CSV

Illustrative MapSculpt data — not real observations.

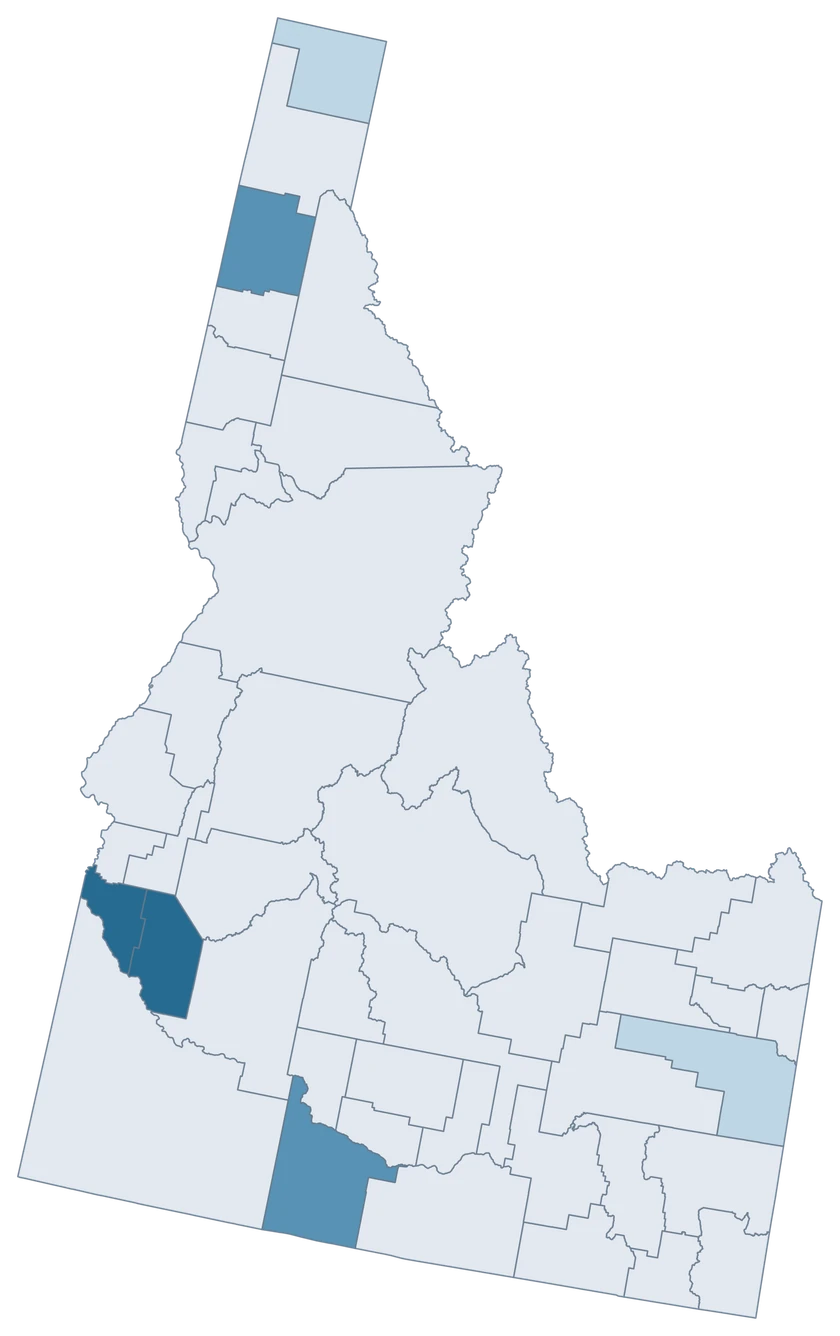
Idaho example map with six fictional project counts and 38 neutral counties.

Illustrative projects

  • 3–5 projects
  • 6–8 projects
  • 9–12 projects
  • 38 counties outside the sample
Download complete PNG

CSV → Match 6 counties → Style → Export PNG Create an Idaho map

COUNTY REFERENCE

All 44 Idaho counties and GEOIDs.

Official county names and five-digit Census GEOIDs. Search by name or code.

  1. Ada CountyGEOID 16001
  2. Adams CountyGEOID 16003
  3. Bannock CountyGEOID 16005
  4. Bear Lake CountyGEOID 16007
  5. Benewah CountyGEOID 16009
  6. Bingham CountyGEOID 16011
  7. Blaine CountyGEOID 16013
  8. Boise CountyGEOID 16015
  9. Bonner CountyGEOID 16017
  10. Bonneville CountyGEOID 16019
  11. Boundary CountyGEOID 16021
  12. Butte CountyGEOID 16023
  13. Camas CountyGEOID 16025
  14. Canyon CountyGEOID 16027
  15. Caribou CountyGEOID 16029
  16. Cassia CountyGEOID 16031
  17. Clark CountyGEOID 16033
  18. Clearwater CountyGEOID 16035
  19. Custer CountyGEOID 16037
  20. Elmore CountyGEOID 16039
  21. Franklin CountyGEOID 16041
  22. Fremont CountyGEOID 16043
  23. Gem CountyGEOID 16045
  24. Gooding CountyGEOID 16047
  25. Idaho CountyGEOID 16049
  26. Jefferson CountyGEOID 16051
  27. Jerome CountyGEOID 16053
  28. Kootenai CountyGEOID 16055
  29. Latah CountyGEOID 16057
  30. Lemhi CountyGEOID 16059
  31. Lewis CountyGEOID 16061
  32. Lincoln CountyGEOID 16063
  33. Madison CountyGEOID 16065
  34. Minidoka CountyGEOID 16067
  35. Nez Perce CountyGEOID 16069
  36. Oneida CountyGEOID 16071
  37. Owyhee CountyGEOID 16073
  38. Payette CountyGEOID 16075
  39. Power CountyGEOID 16077
  40. Shoshone CountyGEOID 16079
  41. Teton CountyGEOID 16081
  42. Twin Falls CountyGEOID 16083
  43. Valley CountyGEOID 16085
  44. Washington CountyGEOID 16087
U.S. Census Bureau · 2025 Cartographic Boundary Files

COMMON QUESTIONS

Idaho county map questions.

Can I highlight only the Idaho panhandle?

Yes. You can select Boundary, Bonner and Kootenai individually. You can also assign them a shared fill for a regional comparison.

Which GEOIDs identify Ada and Canyon?

Ada County is 16001 and Canyon is 16027. Use the county IDs for comparable county-wide records.

Is Boise County the polygon for Boise city?

Boise city is in Ada County. Boise County is a separate county with its own Census identifier.

Can I compare Idaho and Wyoming Teton counties?

Use the national county editor and join by state-prefixed GEOID. Idaho’s Teton County is 16081.

Can I download the entire panhandle at full resolution?

The complete PNG retains the northern extent from the editor. The responsive web preview scales the complete outline.

What does the net domestic migration color measure?

It shows net moves within the U.S. per 1,000 average residents. Total change includes other components.

YOUR NEXT MAP STARTS HERE

Build your Idaho county map.

Join your own Idaho county records by GEOID, review the matches and export with an accurate legend.

Create an Idaho map