Skip to content
MapSculpt

GEOGRAPHIC MAP MAKER / FLORIDA

Florida
Counties Map Maker

Color all 67 Florida counties. Explore real population and housing patterns, import your own data, and export a custom map ready to share.

Free online editor · No sign-up required

67counties
individually editable

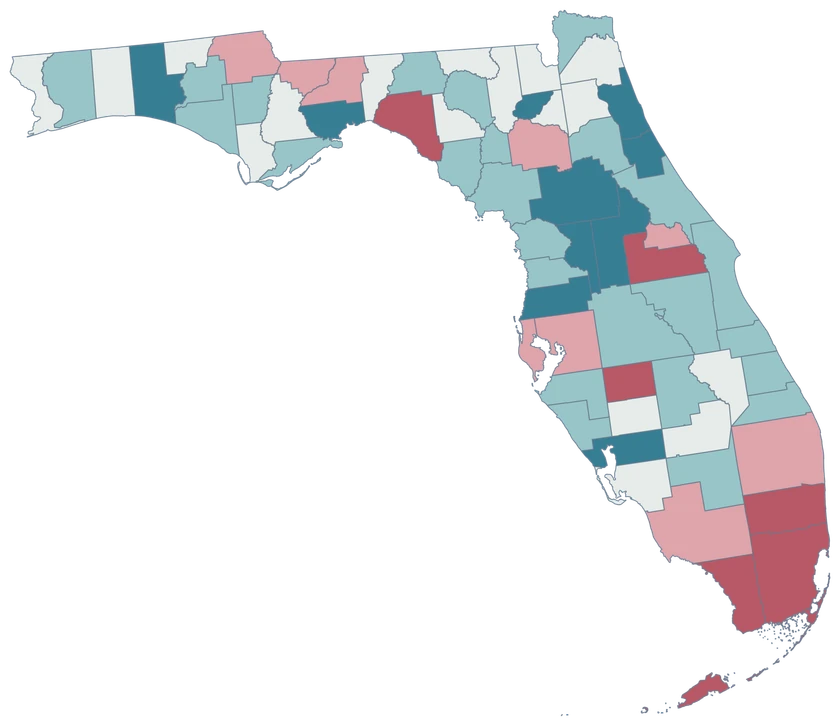
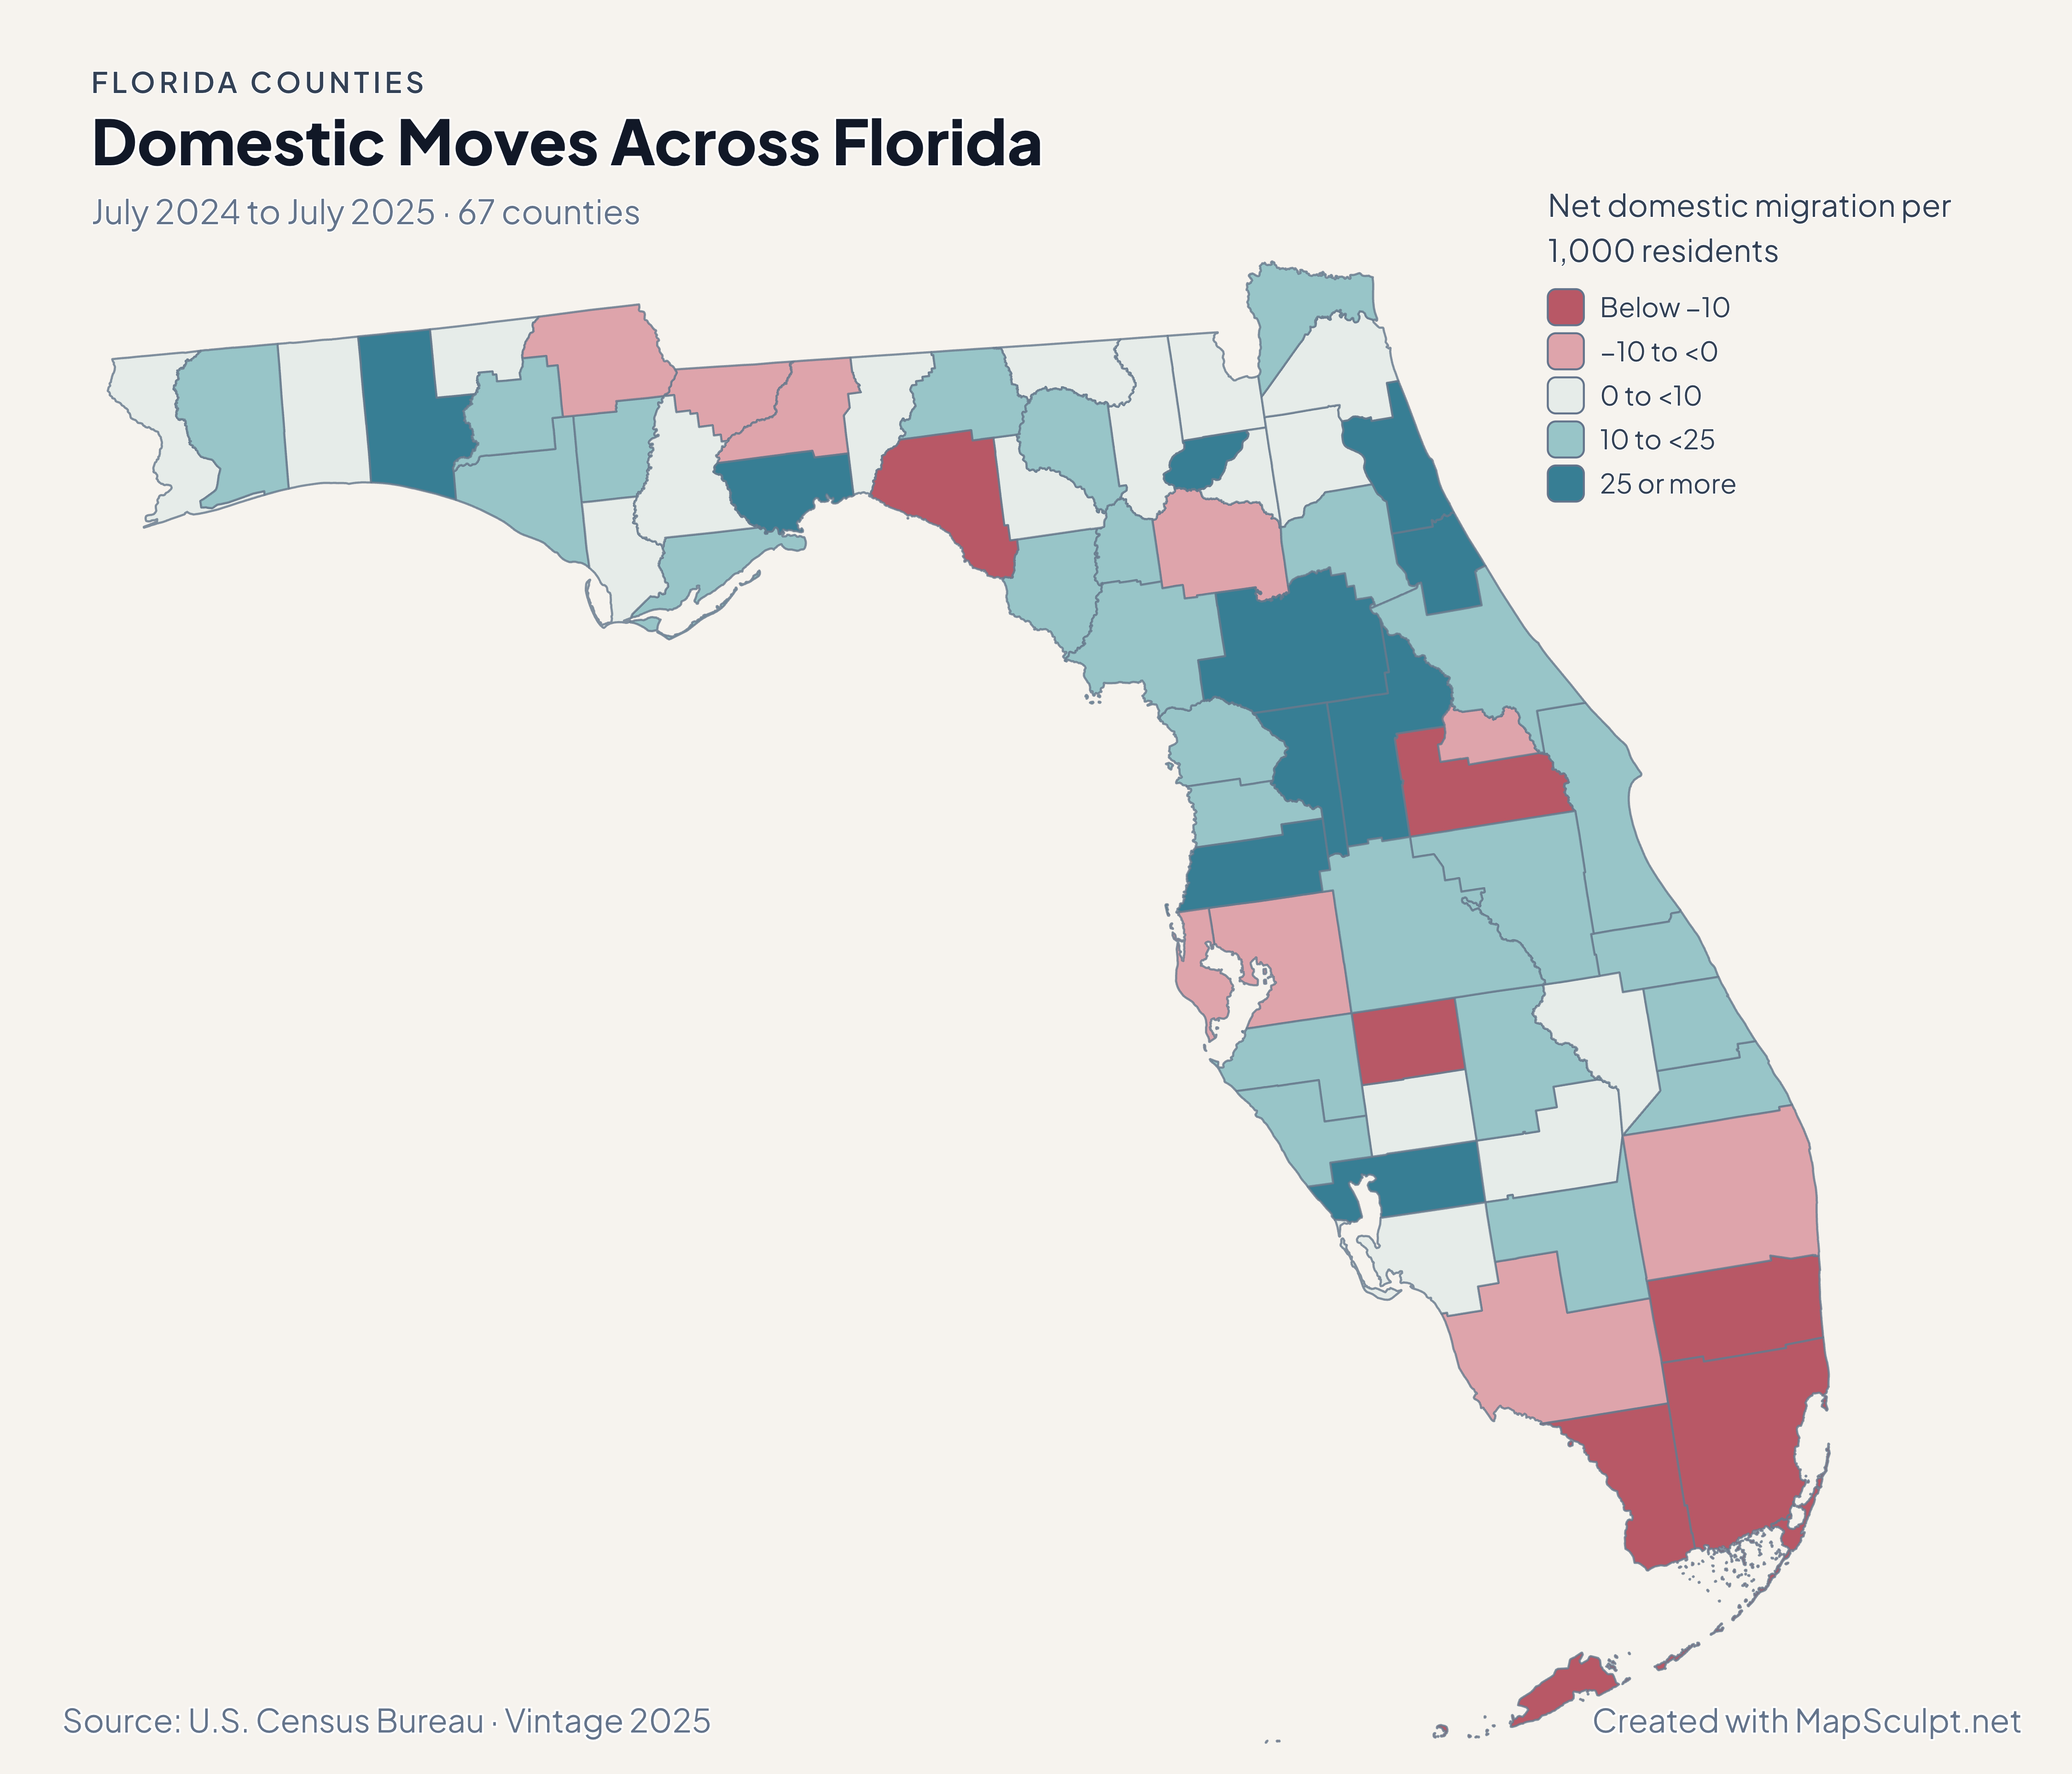
Domestic Moves Across Florida

July 2024 to July 2025 · 67 counties

Florida counties colored by net domestic migration per 1,000 residents. Rose marks losses and teal marks gains; Miami-Dade and Broward recorded net losses.

Net domestic migration per 1,000 residents

  • Below −10
  • −10 to <0
  • 0 to <10
  • 10 to <25
  • 25 or more
U.S. Census Bureau · Vintage 2025Download complete PNG Domestic migration measures moves within the United States. It excludes international migration, births and deaths.

KNOW YOUR GEOGRAPHY

67 counties. From the Panhandle to the Keys.

Florida’s county map connects the Panhandle, peninsula and island communities. Every county has one selectable identity, including multipart coastal counties. Monroe County includes the Keys shown in the source geography.

The editor preserves the 2025 Census cartographic boundary source at 1:500,000 scale. Small islands and coastlines are generalized; this is a county map, not a map of city limits, ZIP codes, parcels or flood-risk zones.

Browse all county GEOIDs ↗

2025 Census boundaries

OFFICIAL DATA

Different measures. Different Florida stories.

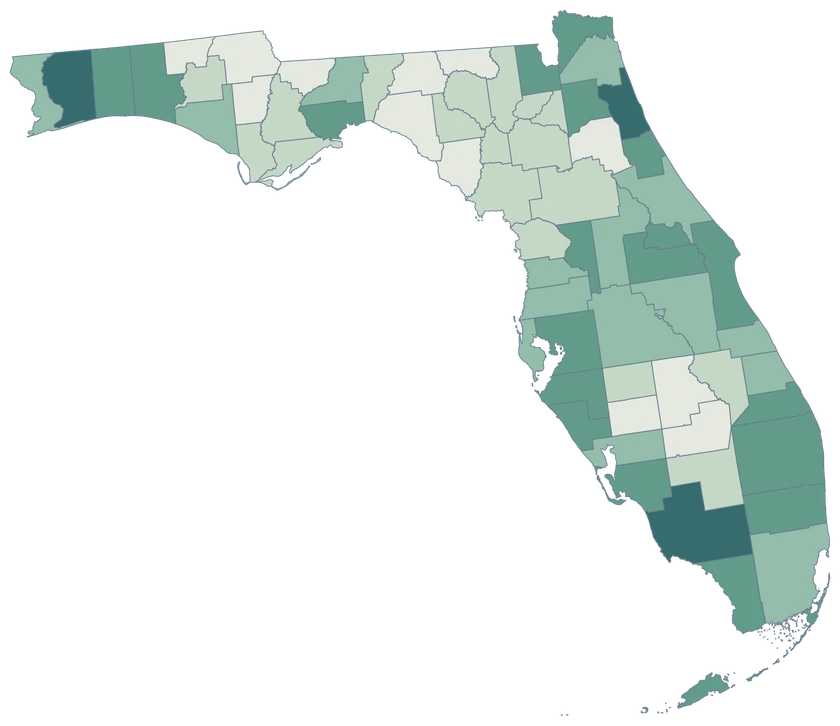
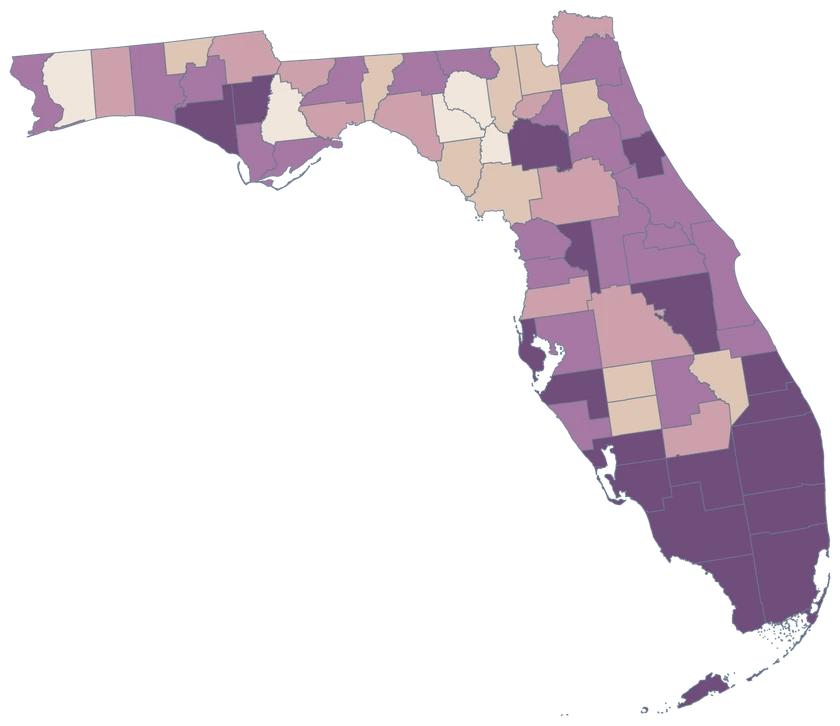
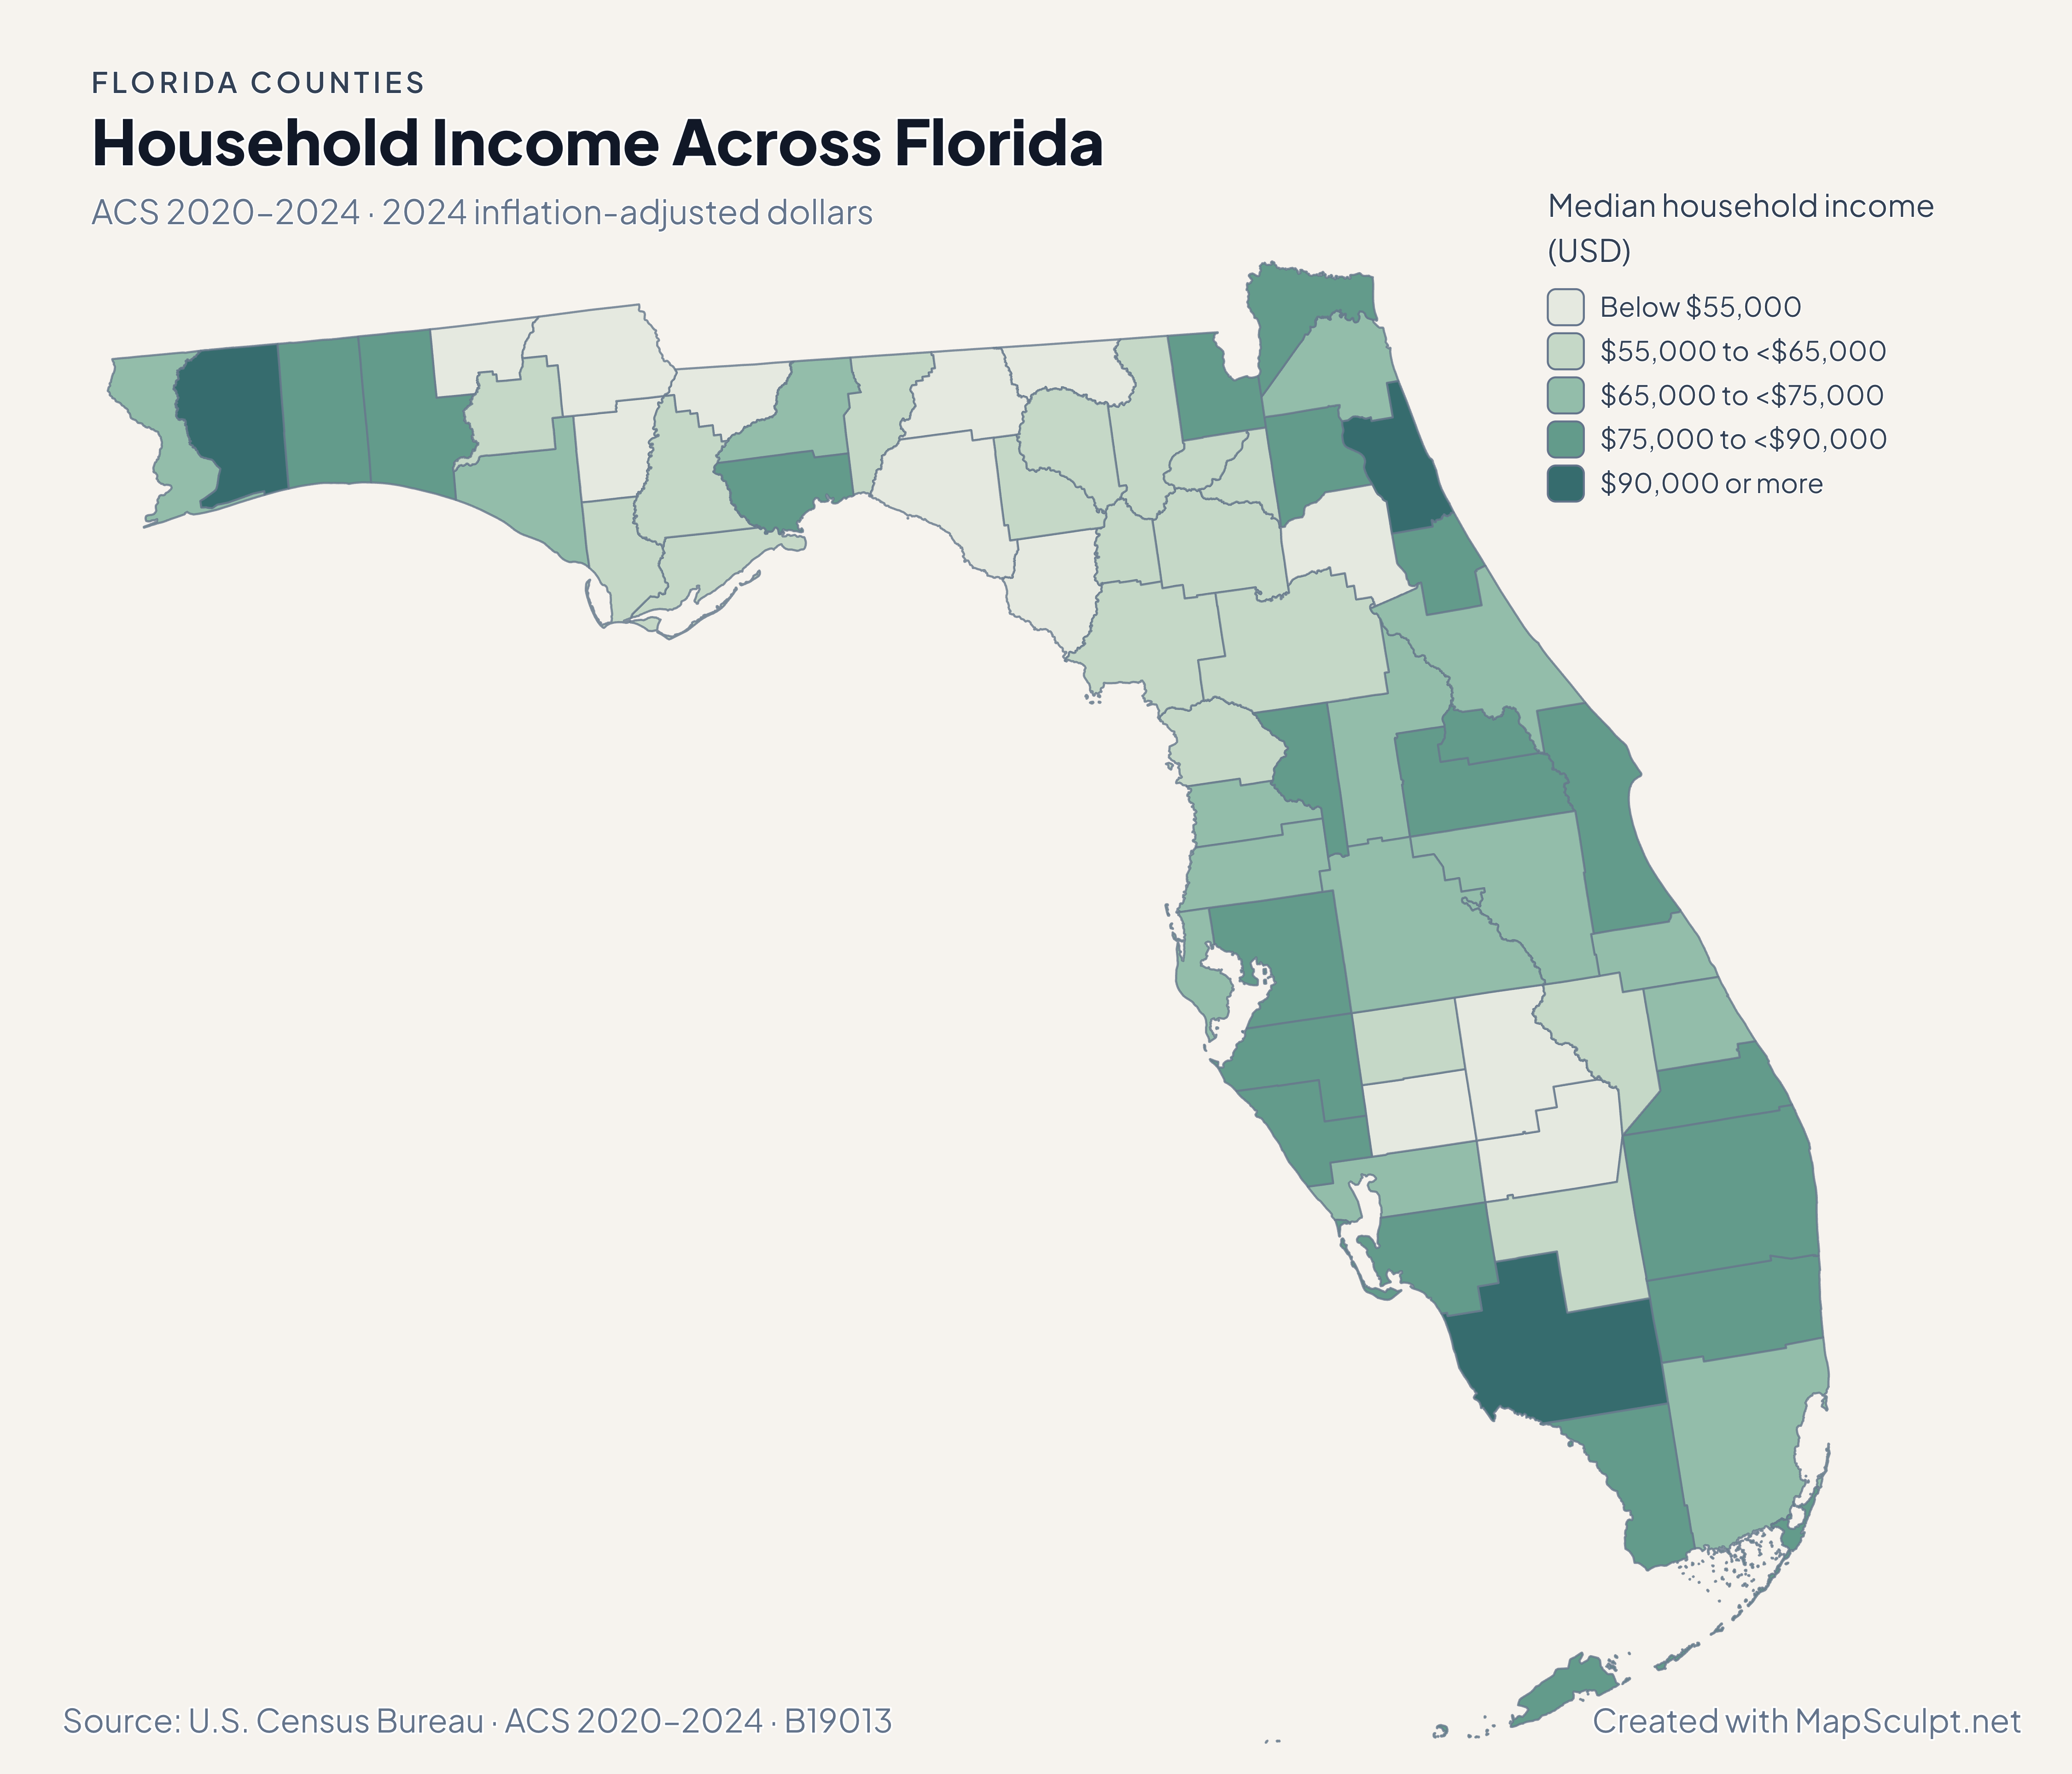
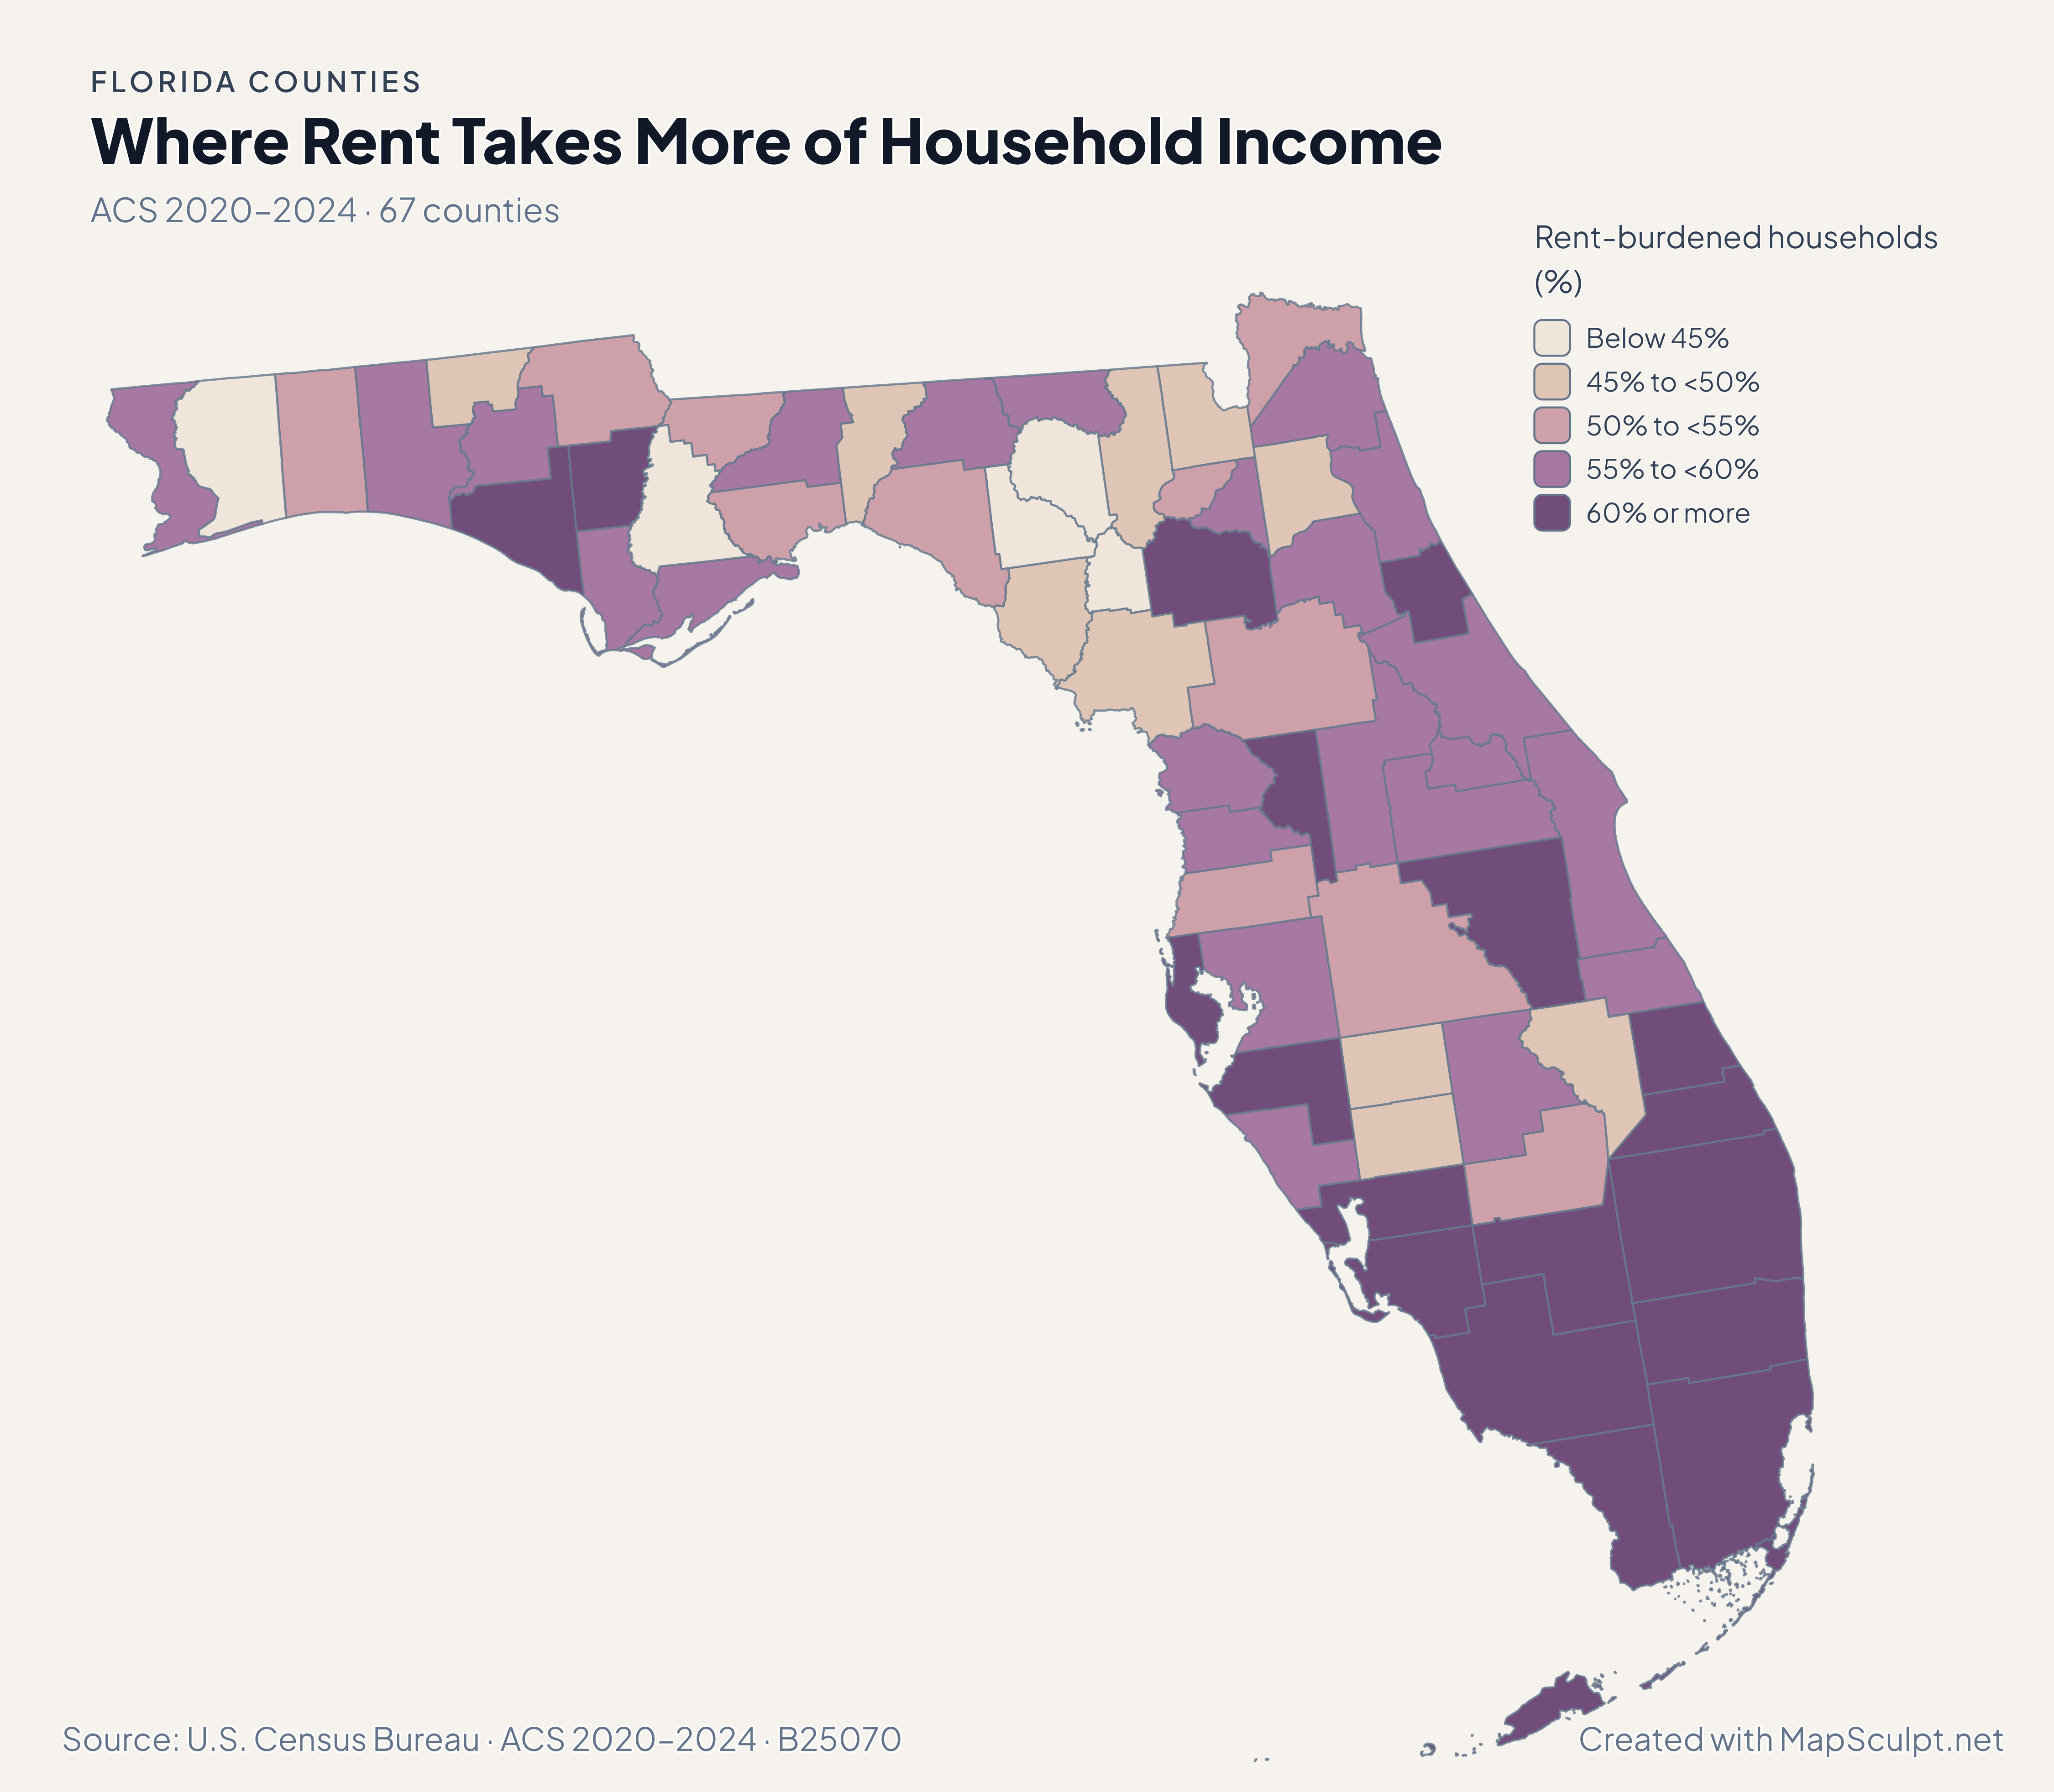
Four views of the same 67 counties, using the Census Bureau’s population estimates and five-year American Community Survey. Each map states its own period and units.

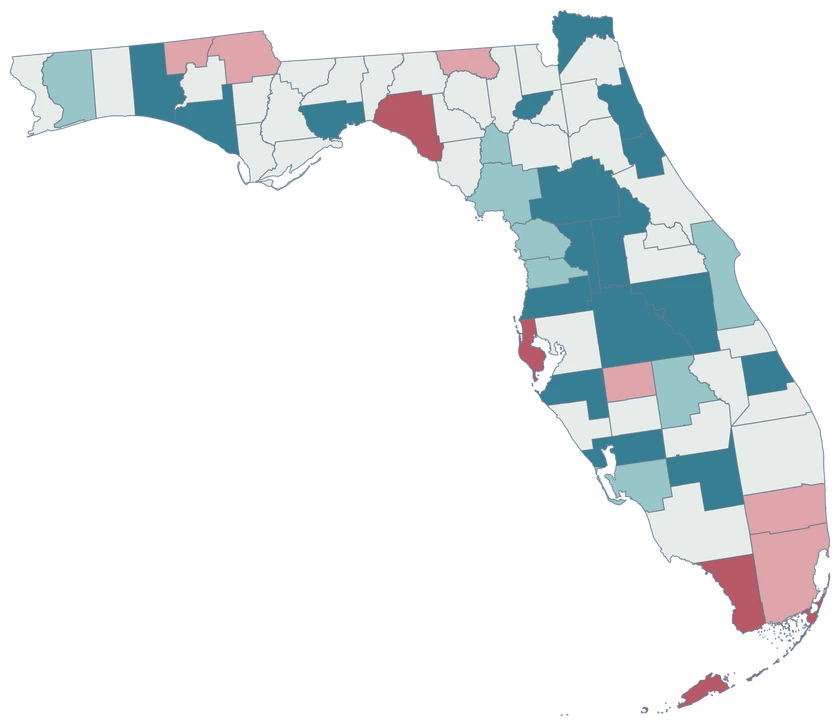
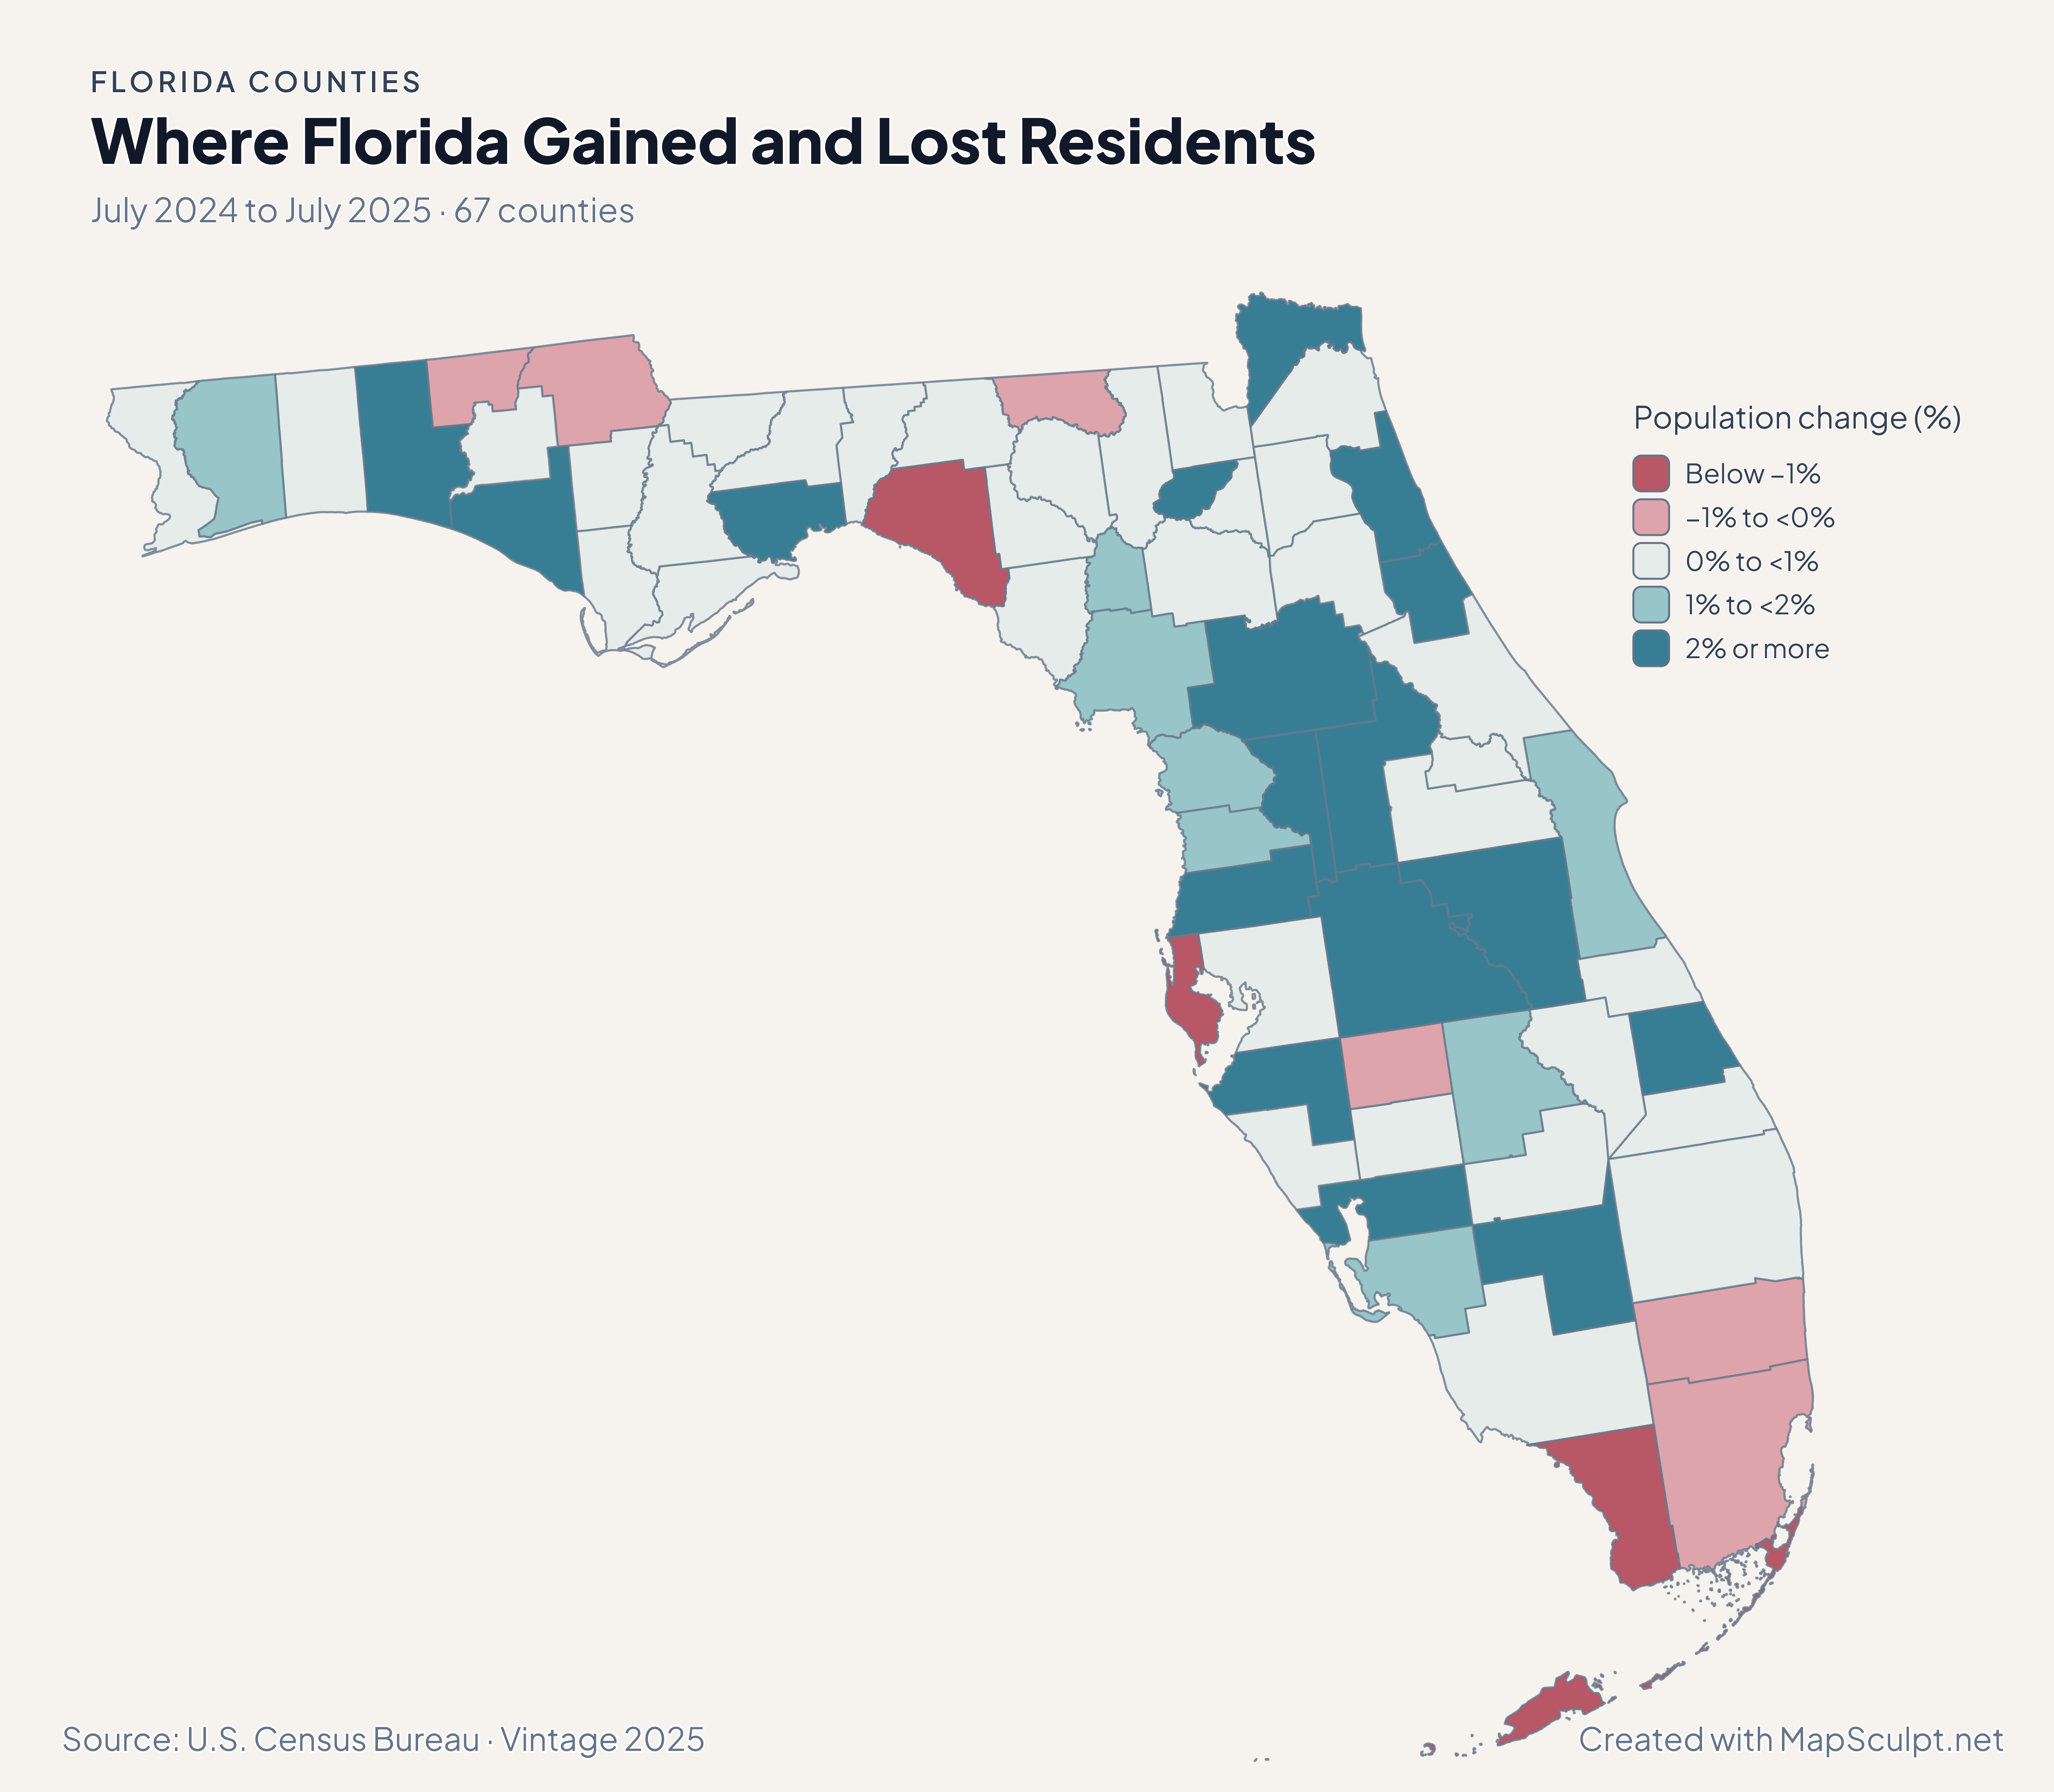
Florida population-change map with nine declining counties in rose and 58 growing counties in neutral-to-teal classes.

July 2024 to July 2025 · 67 counties

Growth was widespread, but not universal.

58 Florida counties gained residents and nine declined between July 2024 and July 2025. St. Johns had the largest percentage gain, about 3.90%; Taylor had the largest percentage decline, about 2.21%. These estimates describe change, not its causes.

Population change (%)

  • Below −1%
  • −1% to <0%
  • 0% to <1%
  • 1% to <2%
  • 2% or more

U.S. Census Bureau · Vintage 2025

Download complete PNG

Miami-Dade, Broward, Palm Beach, Orange and Hillsborough all recorded net domestic out-migration in 2024–2025. Yet Orange, Palm Beach and Hillsborough still gained residents overall. Domestic moves are only one component of population change. See the Census estimates ↗

MAKE IT YOURS

From county data to a finished map.

  1. Choose Florida counties

    Open the Florida editor and start with all 67 county boundaries.

  2. Import your CSV

    Match five-digit GEOIDs or county names. Review every match before applying values.

  3. Style your story

    Choose meaningful classes and colors, then add a title, legend and source.

  4. Export your PNG

    Check the complete composition and download a high-resolution map.

TRY CSV IMPORT

From six rows to a Florida county map.

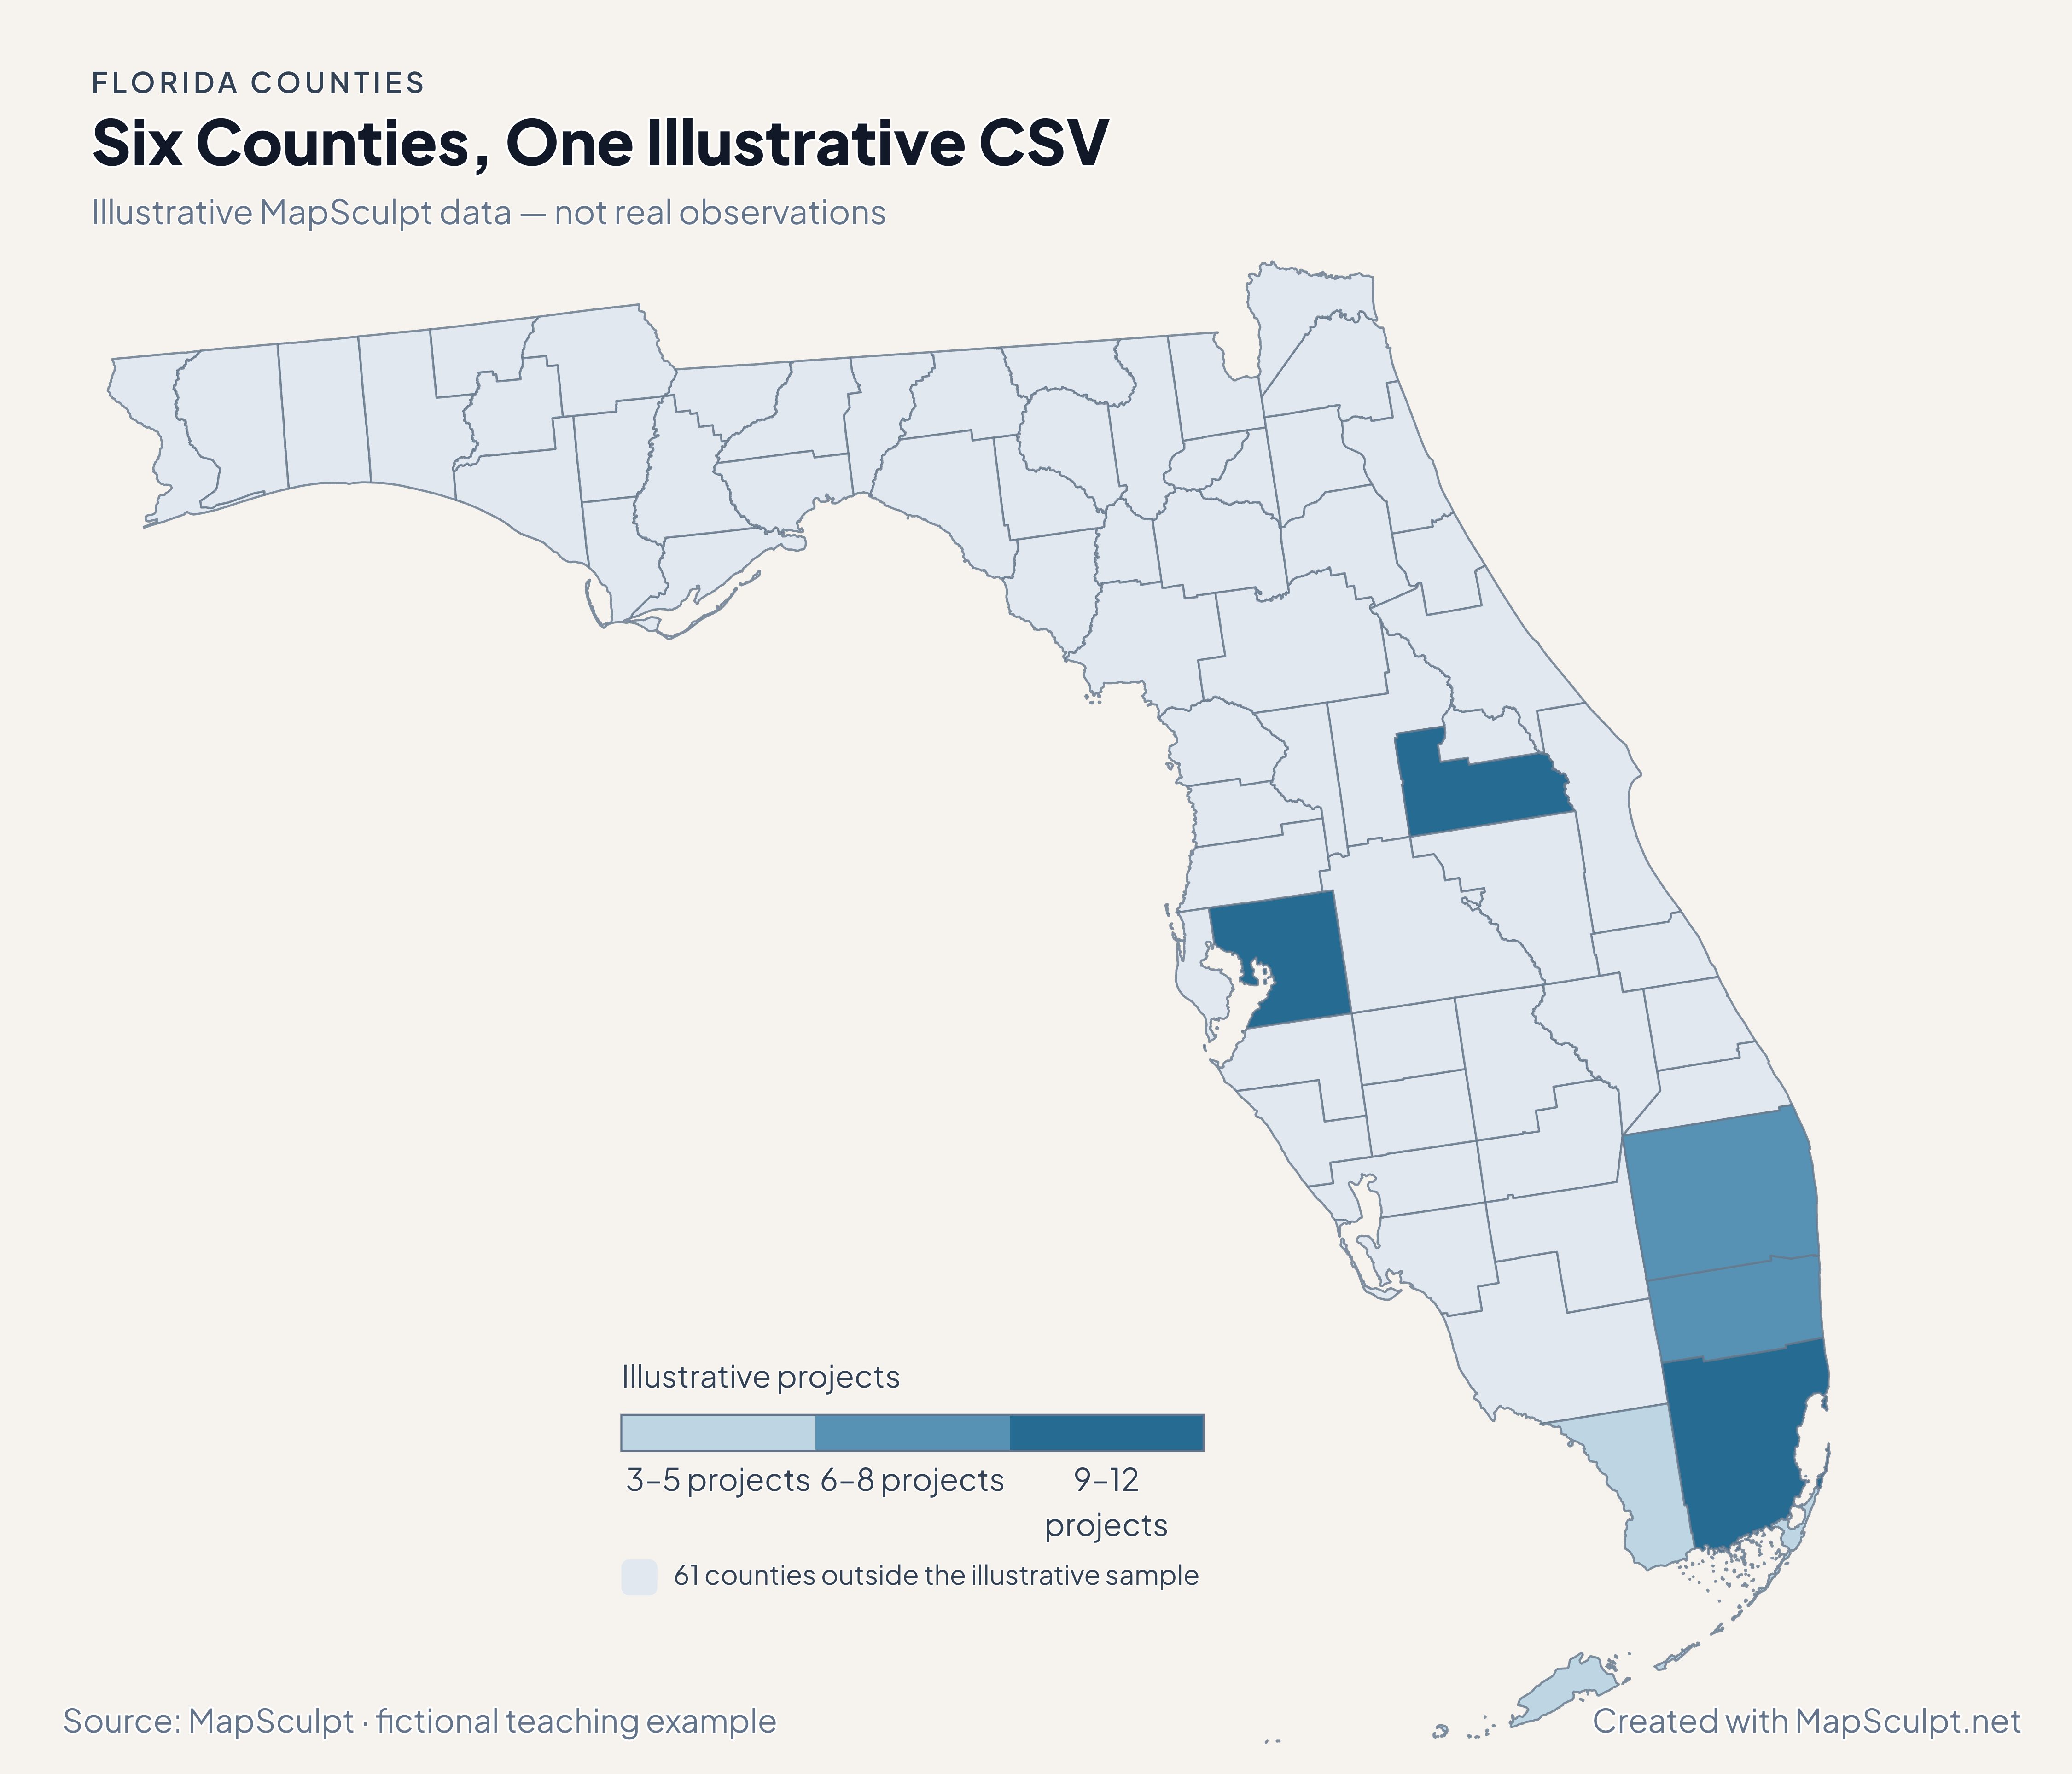
Try a small fictional project list with real county identifiers. Import the CSV, select IllustrativeProjects, choose custom numeric boundaries 3, 6, 9 and 12, then set your colors. The other 61 counties remain outside this illustrative sample.

Illustrative MapSculpt data — not real observations.
CountyGEOIDProjects
Miami-Dade County1208612
Broward County120118
Palm Beach County120996
Orange County1209510
Hillsborough County120579
Monroe County120873

Keep GEOIDs as text. Use 12086 for Miami-Dade County and 12087 for Monroe County. Names should identify counties, not cities: Miami is not a substitute for Miami-Dade County.

Download illustrative CSV ↓

Six Counties, One Illustrative CSV

Illustrative MapSculpt data — not real observations.

Illustrative Florida project map showing six selected counties and 61 neutral counties; the values are fictional, not real observations.

Illustrative projects

  • 3–5 projects
  • 6–8 projects
  • 9–12 projects
  • 61 counties outside the illustrative sample
Download complete PNG

CSV → Match 6 counties → Style → Export PNG Create a Florida map

COUNTY REFERENCE

All 67 Florida counties and GEOIDs.

Official county names and five-digit Census GEOIDs. Search by name or code.

  1. Alachua CountyGEOID 12001
  2. Baker CountyGEOID 12003
  3. Bay CountyGEOID 12005
  4. Bradford CountyGEOID 12007
  5. Brevard CountyGEOID 12009
  6. Broward CountyGEOID 12011
  7. Calhoun CountyGEOID 12013
  8. Charlotte CountyGEOID 12015
  9. Citrus CountyGEOID 12017
  10. Clay CountyGEOID 12019
  11. Collier CountyGEOID 12021
  12. Columbia CountyGEOID 12023
  13. DeSoto CountyGEOID 12027
  14. Dixie CountyGEOID 12029
  15. Duval CountyGEOID 12031
  16. Escambia CountyGEOID 12033
  17. Flagler CountyGEOID 12035
  18. Franklin CountyGEOID 12037
  19. Gadsden CountyGEOID 12039
  20. Gilchrist CountyGEOID 12041
  21. Glades CountyGEOID 12043
  22. Gulf CountyGEOID 12045
  23. Hamilton CountyGEOID 12047
  24. Hardee CountyGEOID 12049
  25. Hendry CountyGEOID 12051
  26. Hernando CountyGEOID 12053
  27. Highlands CountyGEOID 12055
  28. Hillsborough CountyGEOID 12057
  29. Holmes CountyGEOID 12059
  30. Indian River CountyGEOID 12061
  31. Jackson CountyGEOID 12063
  32. Jefferson CountyGEOID 12065
  33. Lafayette CountyGEOID 12067
  34. Lake CountyGEOID 12069
  35. Lee CountyGEOID 12071
  36. Leon CountyGEOID 12073
  37. Levy CountyGEOID 12075
  38. Liberty CountyGEOID 12077
  39. Madison CountyGEOID 12079
  40. Manatee CountyGEOID 12081
  41. Marion CountyGEOID 12083
  42. Martin CountyGEOID 12085
  43. Miami-Dade CountyGEOID 12086
  44. Monroe CountyGEOID 12087
  45. Nassau CountyGEOID 12089
  46. Okaloosa CountyGEOID 12091
  47. Okeechobee CountyGEOID 12093
  48. Orange CountyGEOID 12095
  49. Osceola CountyGEOID 12097
  50. Palm Beach CountyGEOID 12099
  51. Pasco CountyGEOID 12101
  52. Pinellas CountyGEOID 12103
  53. Polk CountyGEOID 12105
  54. Putnam CountyGEOID 12107
  55. Santa Rosa CountyGEOID 12113
  56. Sarasota CountyGEOID 12115
  57. Seminole CountyGEOID 12117
  58. St. Johns CountyGEOID 12109
  59. St. Lucie CountyGEOID 12111
  60. Sumter CountyGEOID 12119
  61. Suwannee CountyGEOID 12121
  62. Taylor CountyGEOID 12123
  63. Union CountyGEOID 12125
  64. Volusia CountyGEOID 12127
  65. Wakulla CountyGEOID 12129
  66. Walton CountyGEOID 12131
  67. Washington CountyGEOID 12133
U.S. Census Bureau · 2025 Cartographic Boundary Files

COMMON QUESTIONS

Florida county map questions.

How many counties does this Florida map include?

All 67 Florida counties are individually editable. The directory lists every official county name and five-digit Census GEOID.

Are the Florida Keys included?

The map retains the islands represented in the existing Census cartographic source. The Keys shown belong to Monroe County and share its county identity. Small features are generalized at 1:500,000 scale.

Can I color Miami-Dade, Broward and Palm Beach separately?

Yes. They are separate counties: Miami-Dade is 12086, Broward is 12011 and Palm Beach is 12099. Selecting a county changes that county’s fill.

Why can a county gain population while losing domestic movers?

Total population change includes births, deaths, domestic migration, international migration and residual adjustments. Orange, Palm Beach and Hillsborough had population gains alongside net domestic out-migration in the Census 2024–2025 estimates.

Which names or codes should my Florida CSV use?

Five-digit county GEOIDs are the most explicit identifiers. Official county names also work in the Florida editor. Preserve codes as text and review matches; city names such as Miami or Orlando are not county identifiers.

Does the downloadable CSV contain Census observations?

No. It contains clearly labeled fictional MapSculpt project counts for six Florida counties. The statistical maps use official data, with links to the original Census publishers instead of redistributed dataset downloads.

Can I customize the colors and legend?

Yes. Import your Florida county values or color counties directly, adjust categories and colors, and add a title, legend and source in the editor.

Can I download the complete example maps?

Yes. Each example has a full-resolution native MapSculpt PNG with its title, legend and attribution included. The CSV example is explicitly labeled illustrative.

Does this show flood zones, ZIP codes or city boundaries?

No. The selectable geography is Florida counties. Generalized Census county boundaries are not parcel, flood-risk, ZIP-code or municipal boundaries.

Can I compare the income and population maps as one time series?

No. Population change covers July 2024 to July 2025; the ACS estimates pool 2020–2024 and income is expressed in 2024 dollars. The maps describe different measures and periods, not a common annual series.

YOUR NEXT MAP STARTS HERE

Make Florida’s geography your own.

Start with 67 counties. Bring your data, make your choices, and export a map worth sharing.

Create a Florida map