Skip to content
MapSculpt

GEOGRAPHIC MAP MAKER / CONNECTICUT

Connecticut
Planning Regions Map Maker

Compare renter costs across Connecticut’s nine planning regions, from Greater Bridgeport to the northeast. These are the current Census county equivalents for joining modern demographic data.

Free online editor · No sign-up required

9planning regions
individually editable

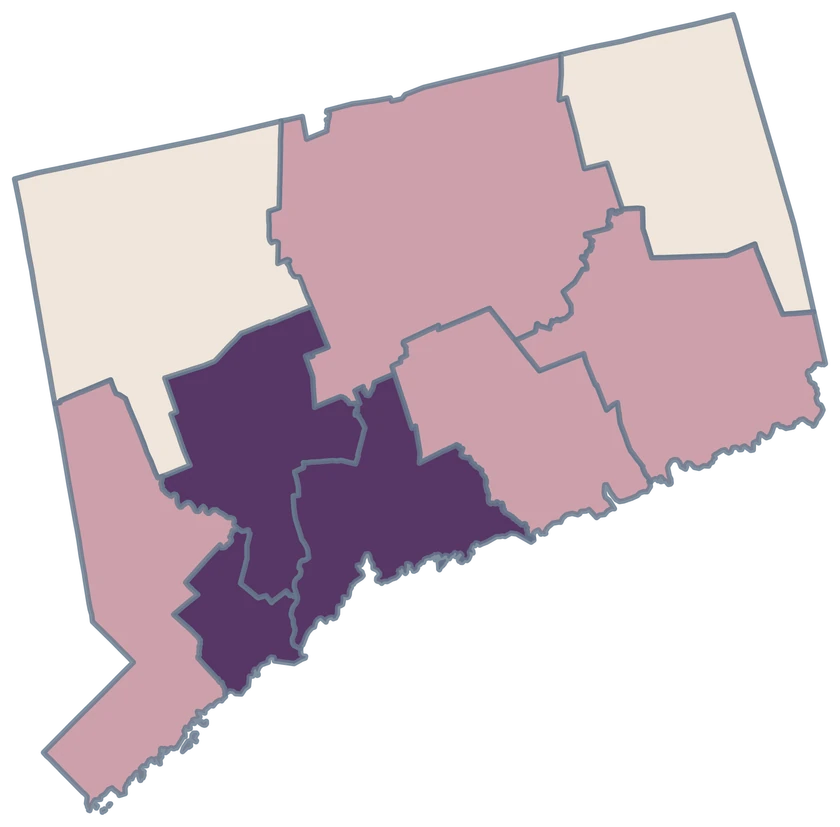
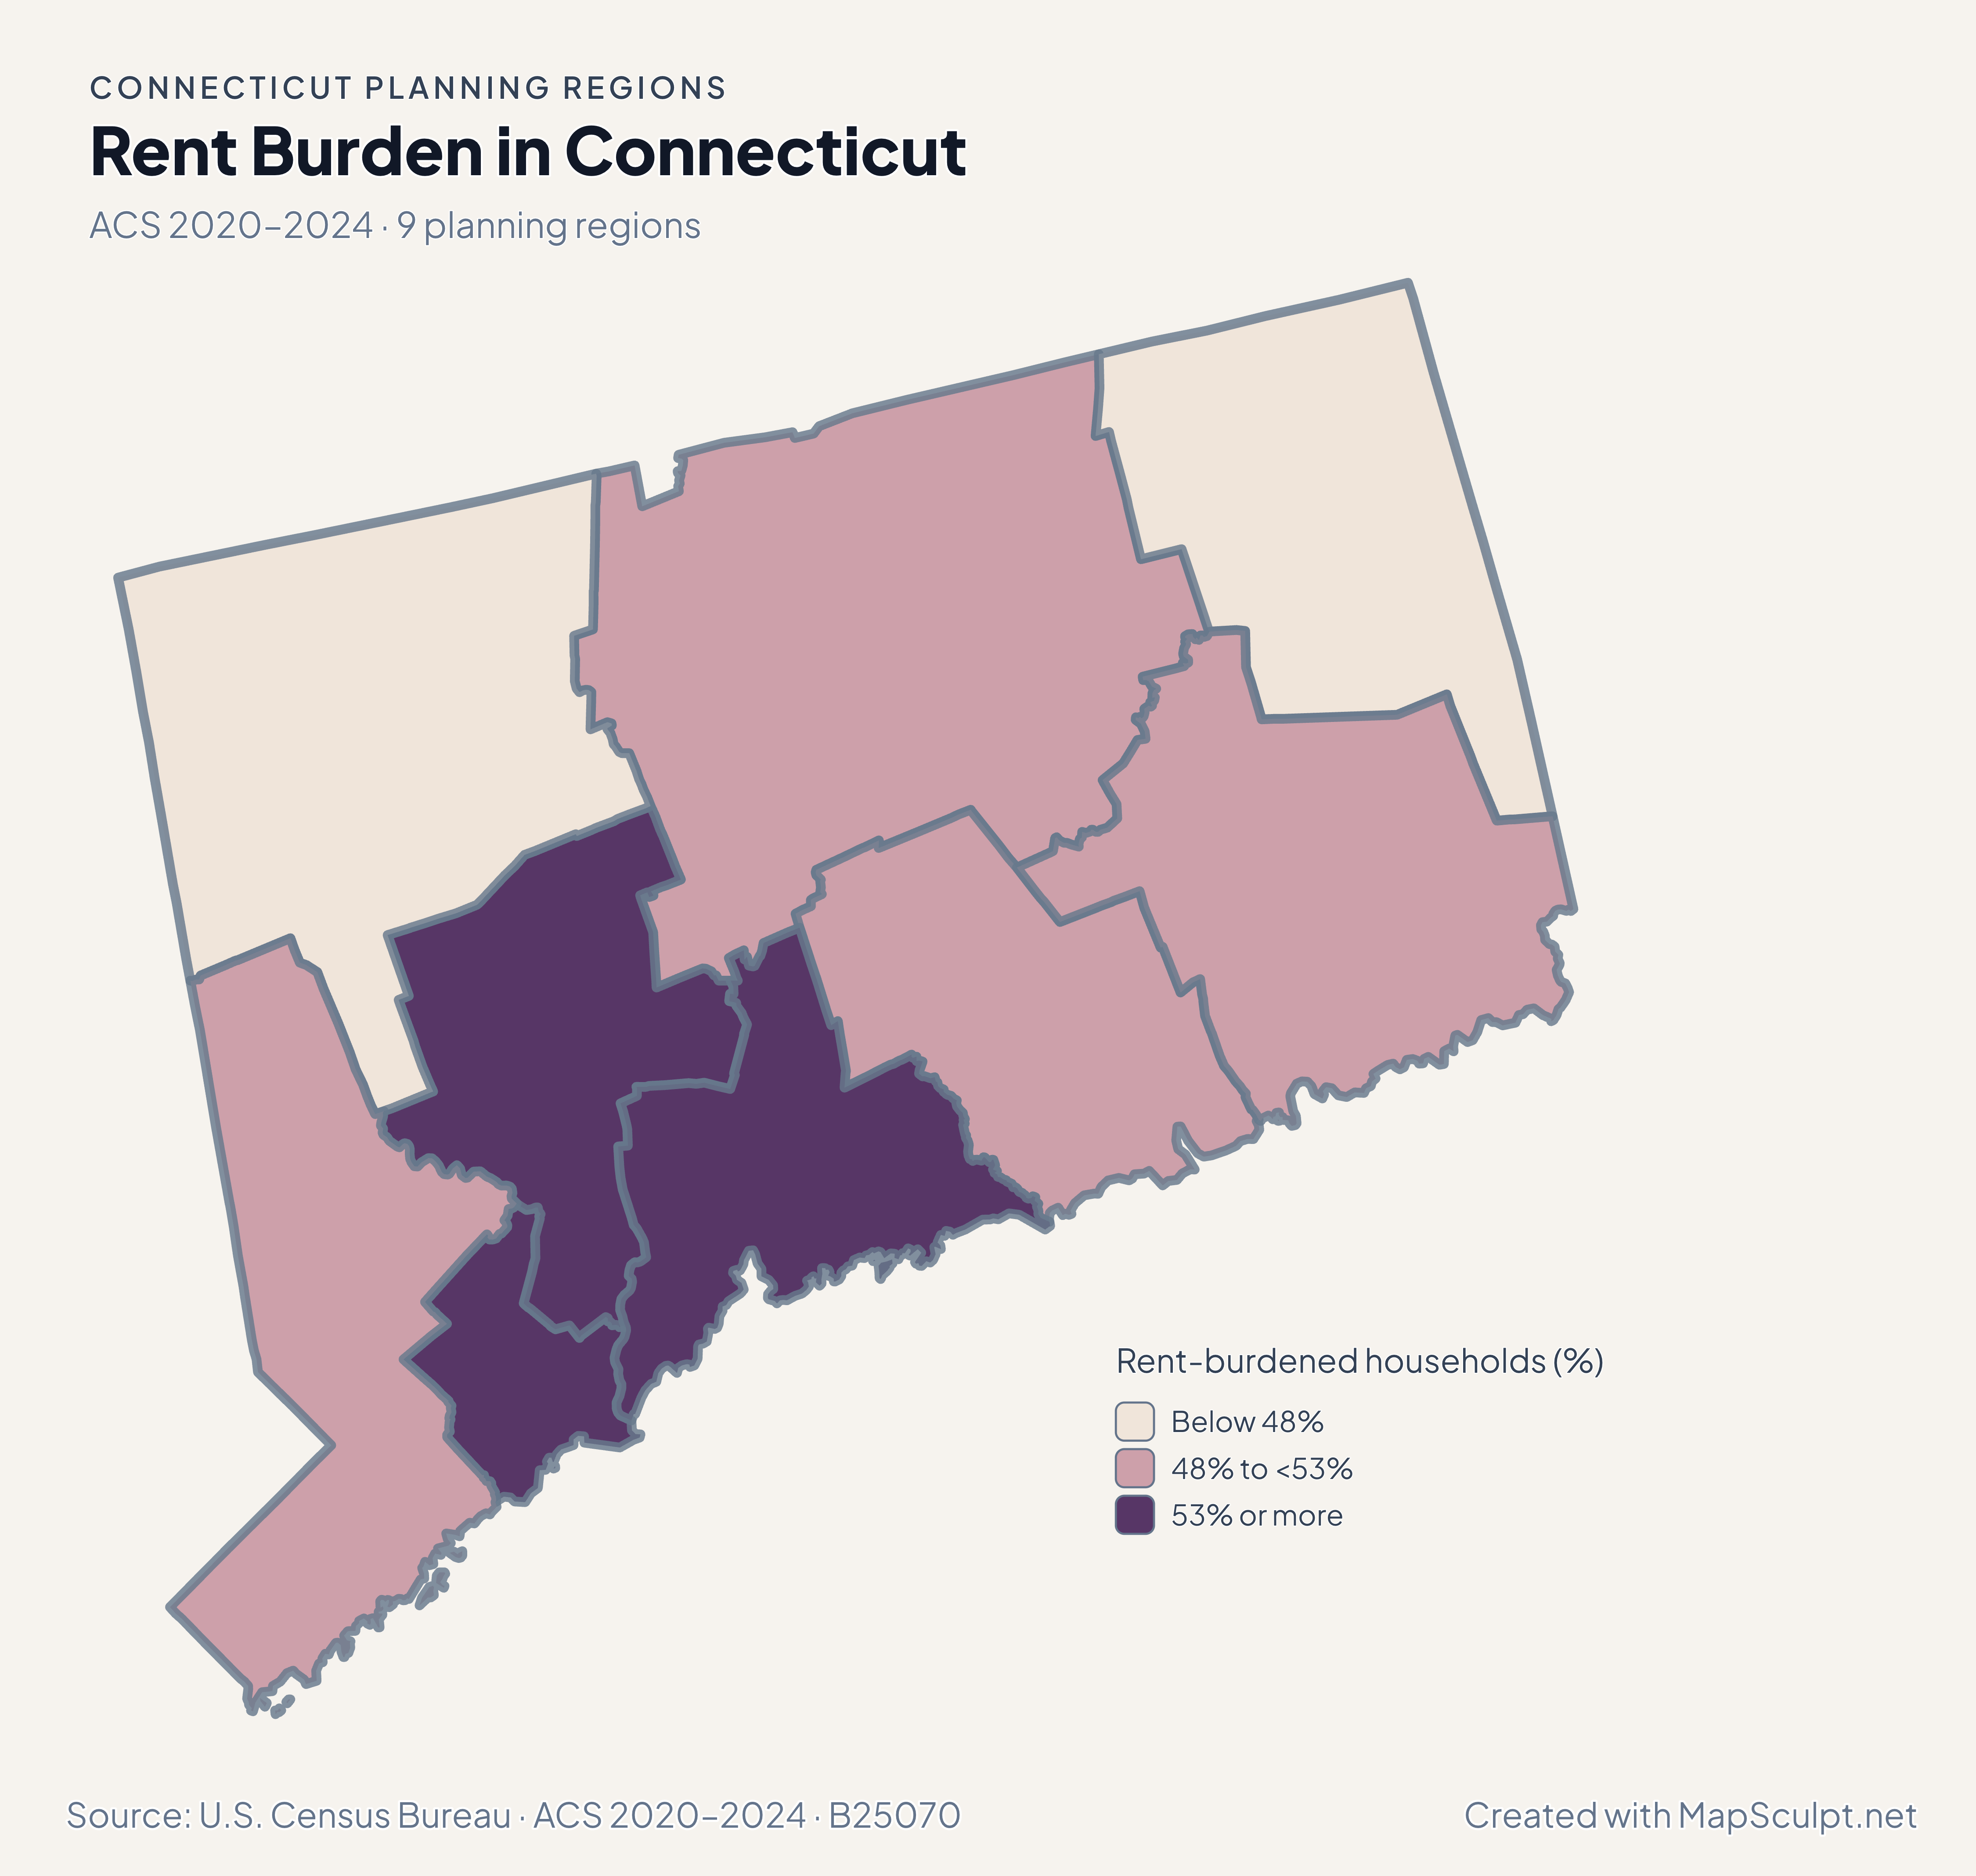
Rent Burden in Connecticut

ACS 2020–2024 · 9 planning regions

Connecticut rent burden by planning region, with Greater Bridgeport in the highest displayed class and the northeast in the lowest.

Rent-burdened households (%)

  • Below 48%
  • 48% to <53%
  • 53% or more
U.S. Census Bureau · ACS 2020–2024 · B25070Download complete PNG The estimate covers renter households with a computable gross-rent-to-income ratio.

KNOW YOUR GEOGRAPHY

Nine planning regions are the current Census equivalents.

The Census Bureau replaced Connecticut’s eight historical counties with nine planning regions for county-equivalent statistics. The map uses the current boundaries and identifiers.

Planning regions group municipalities through regional councils of governments. Older county tables cover different areas, so a county name or legacy GEOID cannot substitute for a modern planning-region record.

Browse all planning region GEOIDs ↗

2025 Census boundaries

OFFICIAL DATA

What the current regional boundaries reveal.

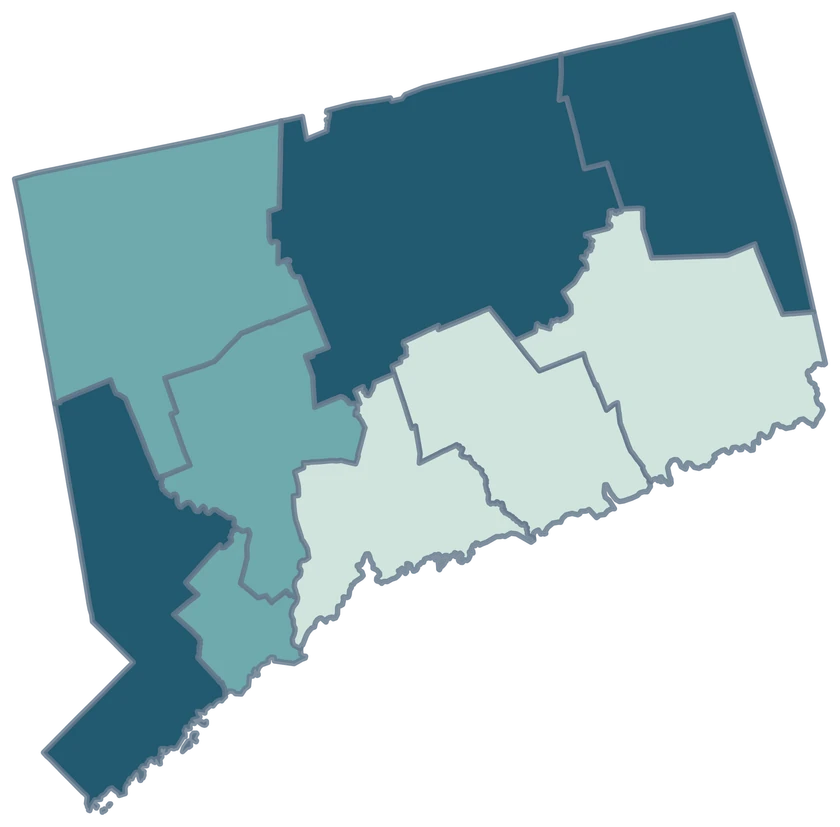
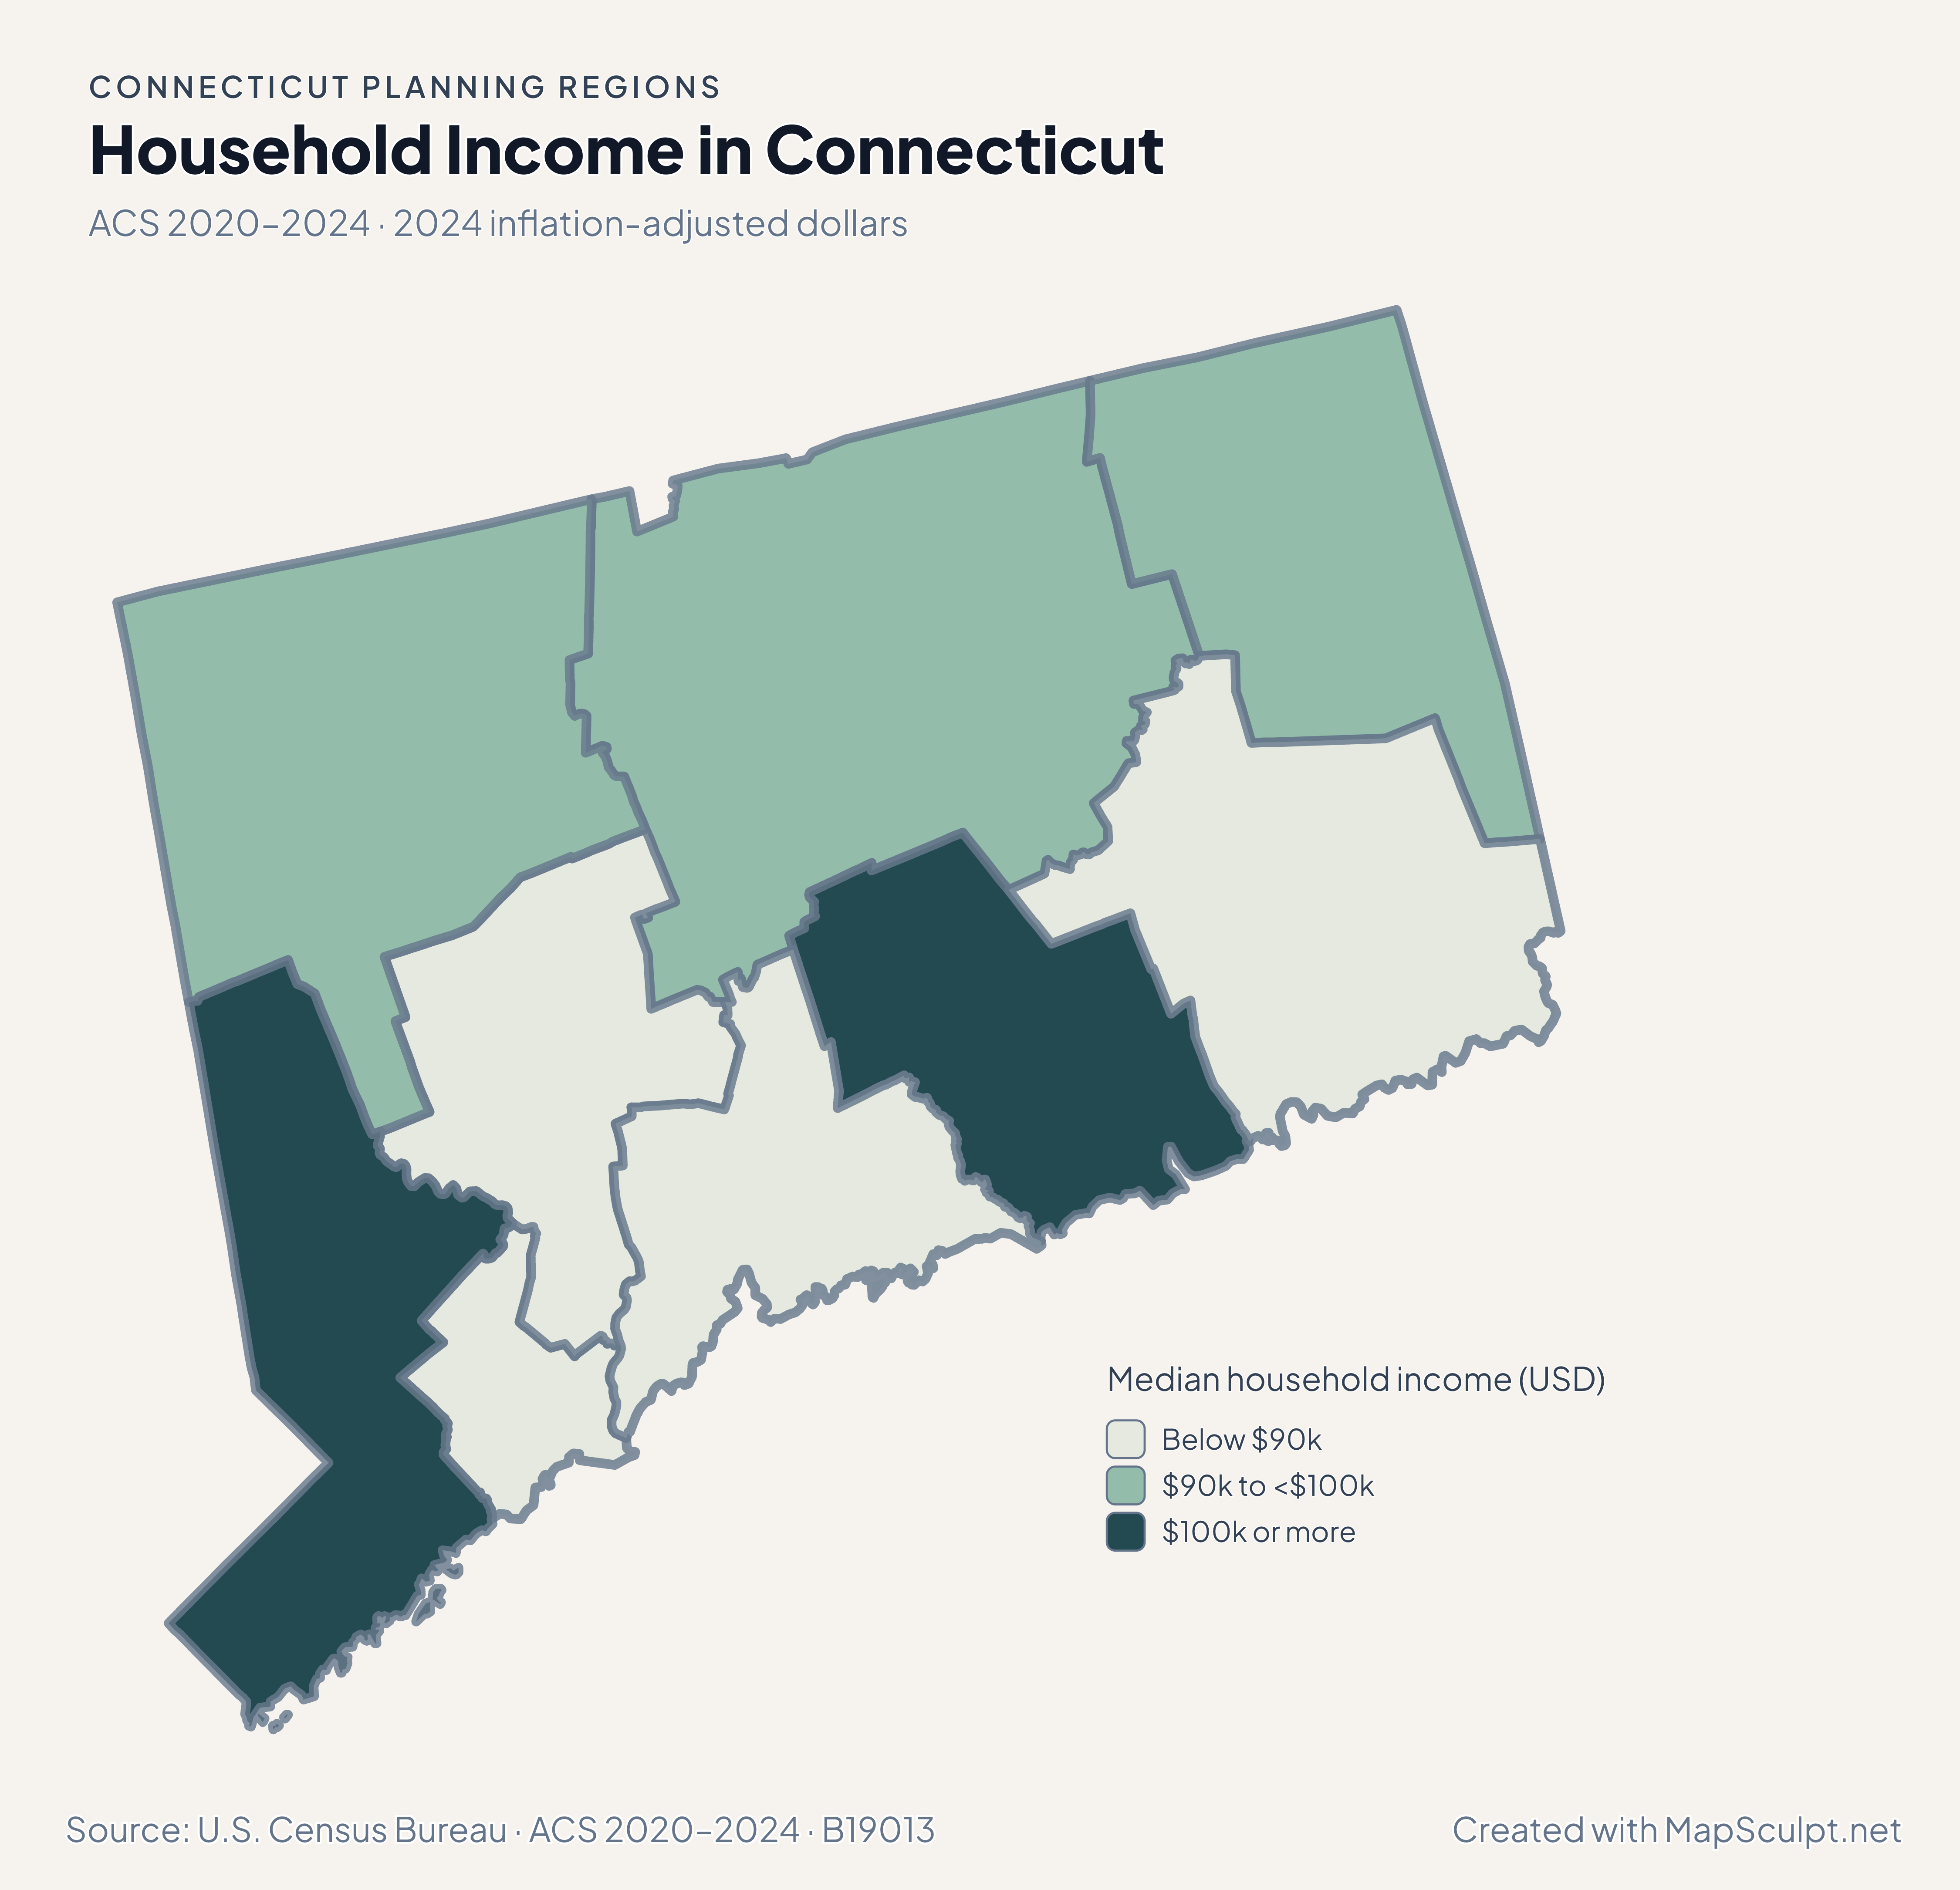
Population and domestic moves use the July 2024–July 2025 estimates. Income and renter costs use the 2020–2024 American Community Survey.

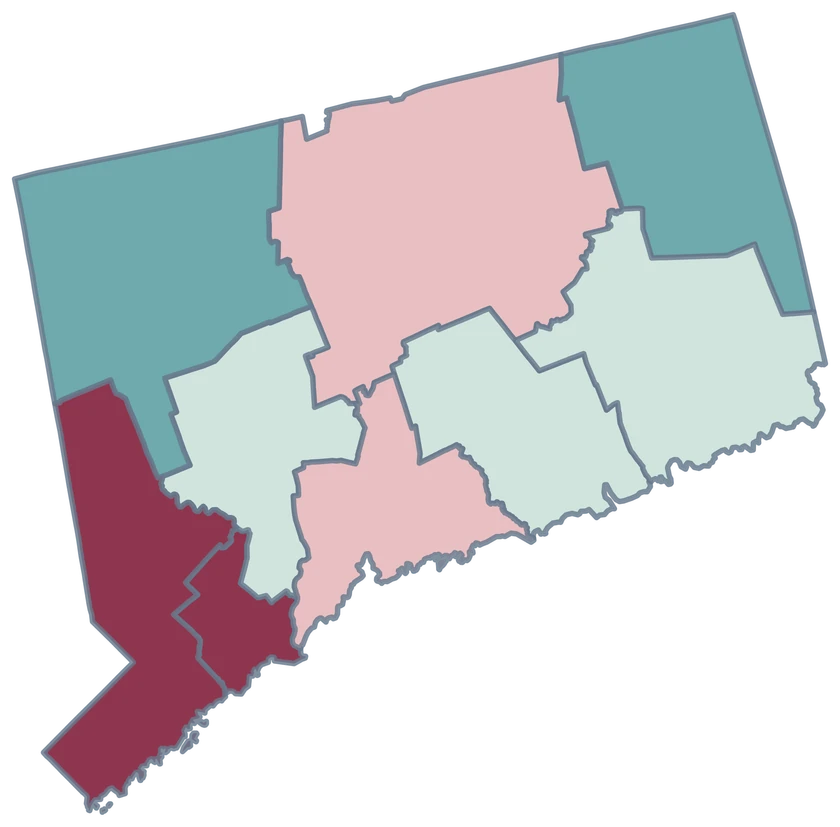
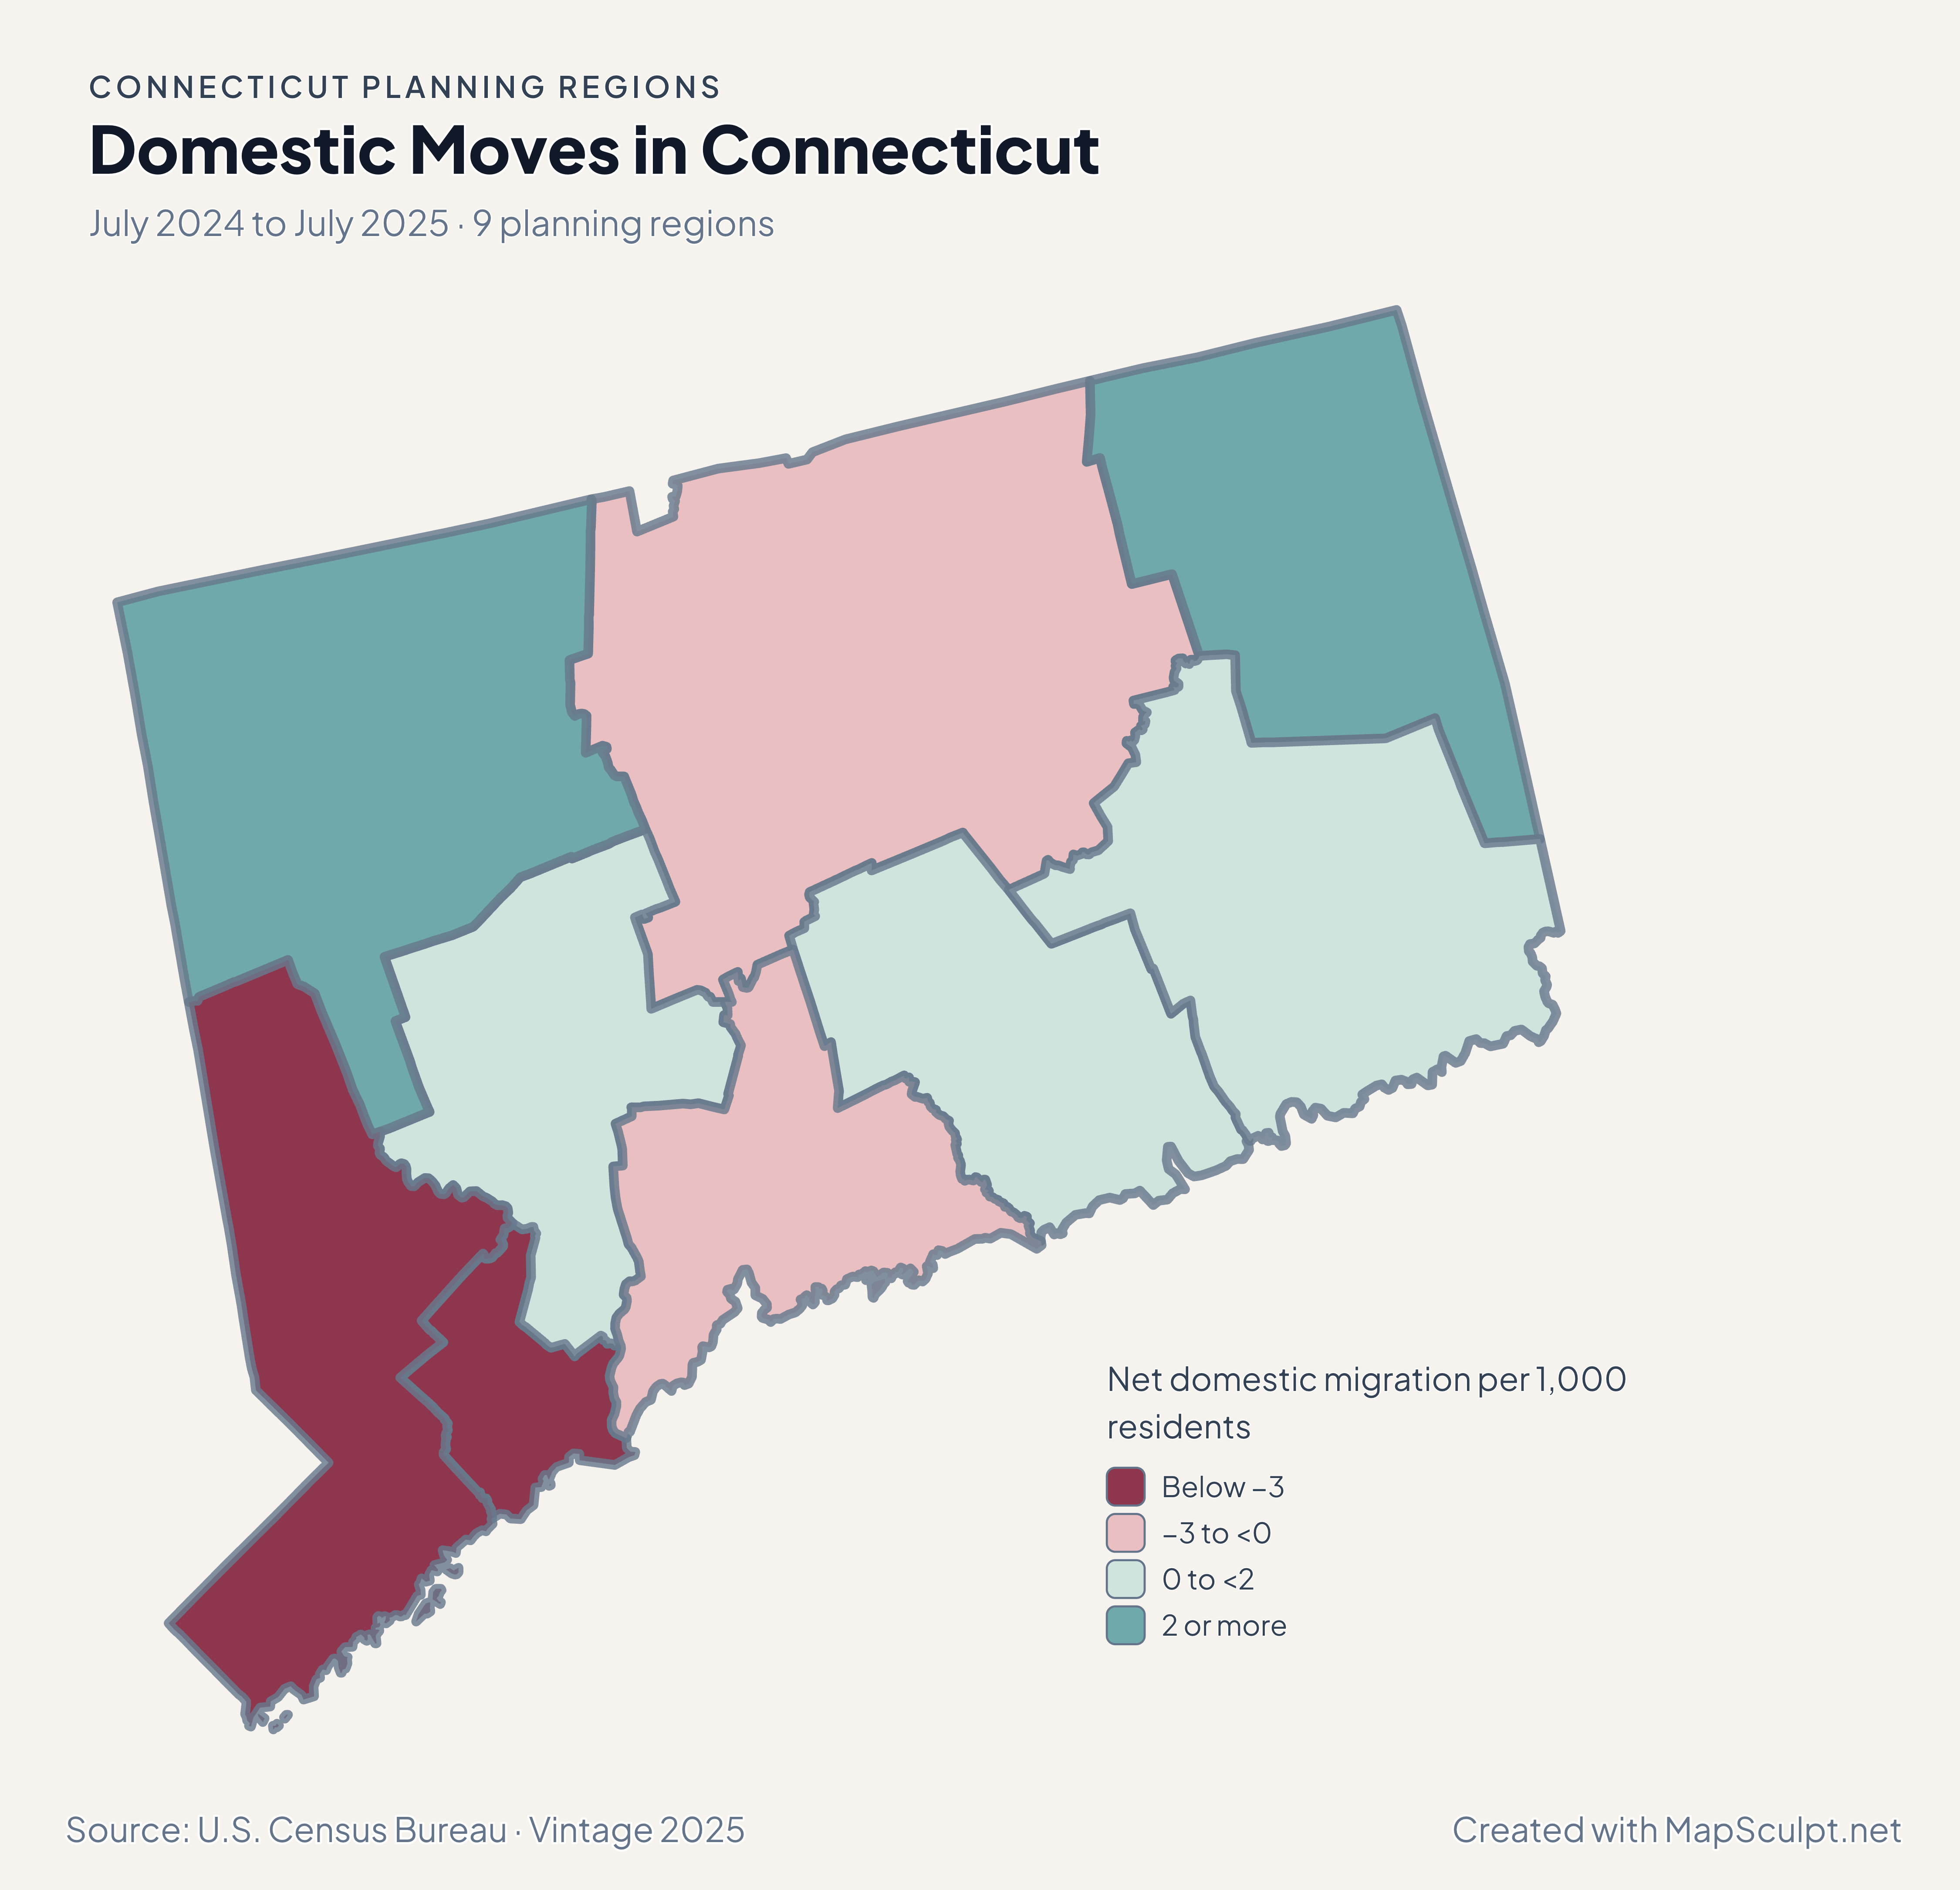
Connecticut planning regions with negative domestic migration in Greater Bridgeport and positive migration in the northeast.

July 2024 to July 2025 · 9 planning regions

Greater Bridgeport and Northeastern Connecticut moved in different directions.

Greater Bridgeport recorded −6.06 net domestic movers per 1,000 residents. Northeastern Connecticut recorded +4.56. The Capitol region was close to balance at −0.11.

Net domestic migration per 1,000 residents

  • Below −3
  • −3 to <0
  • 0 to <2
  • 2 or more

U.S. Census Bureau · Vintage 2025

Download complete PNG

Among households with computable ratios, an estimated 58.7% in Greater Bridgeport spent at least 30% of income on gross rent, compared with 51.9% in Capitol and 40.9% in Northeastern Connecticut. Read these estimates with ACS sampling uncertainty in mind. See the Census estimates ↗

MAKE IT YOURS

From planning region data to a finished map.

  1. Open the Connecticut editor

    Start with all 9 selectable planning regions.

  2. Match your planning region records

    Use 09110 for Capitol Planning Region. Review the match list before applying colors.

  3. Choose a scale

    Use a palette and class boundaries suited to the units in your data.

  4. Export with a legend

    Include the source and reference period alongside a complete high-resolution PNG.

TRY CSV IMPORT

Try six Connecticut records.

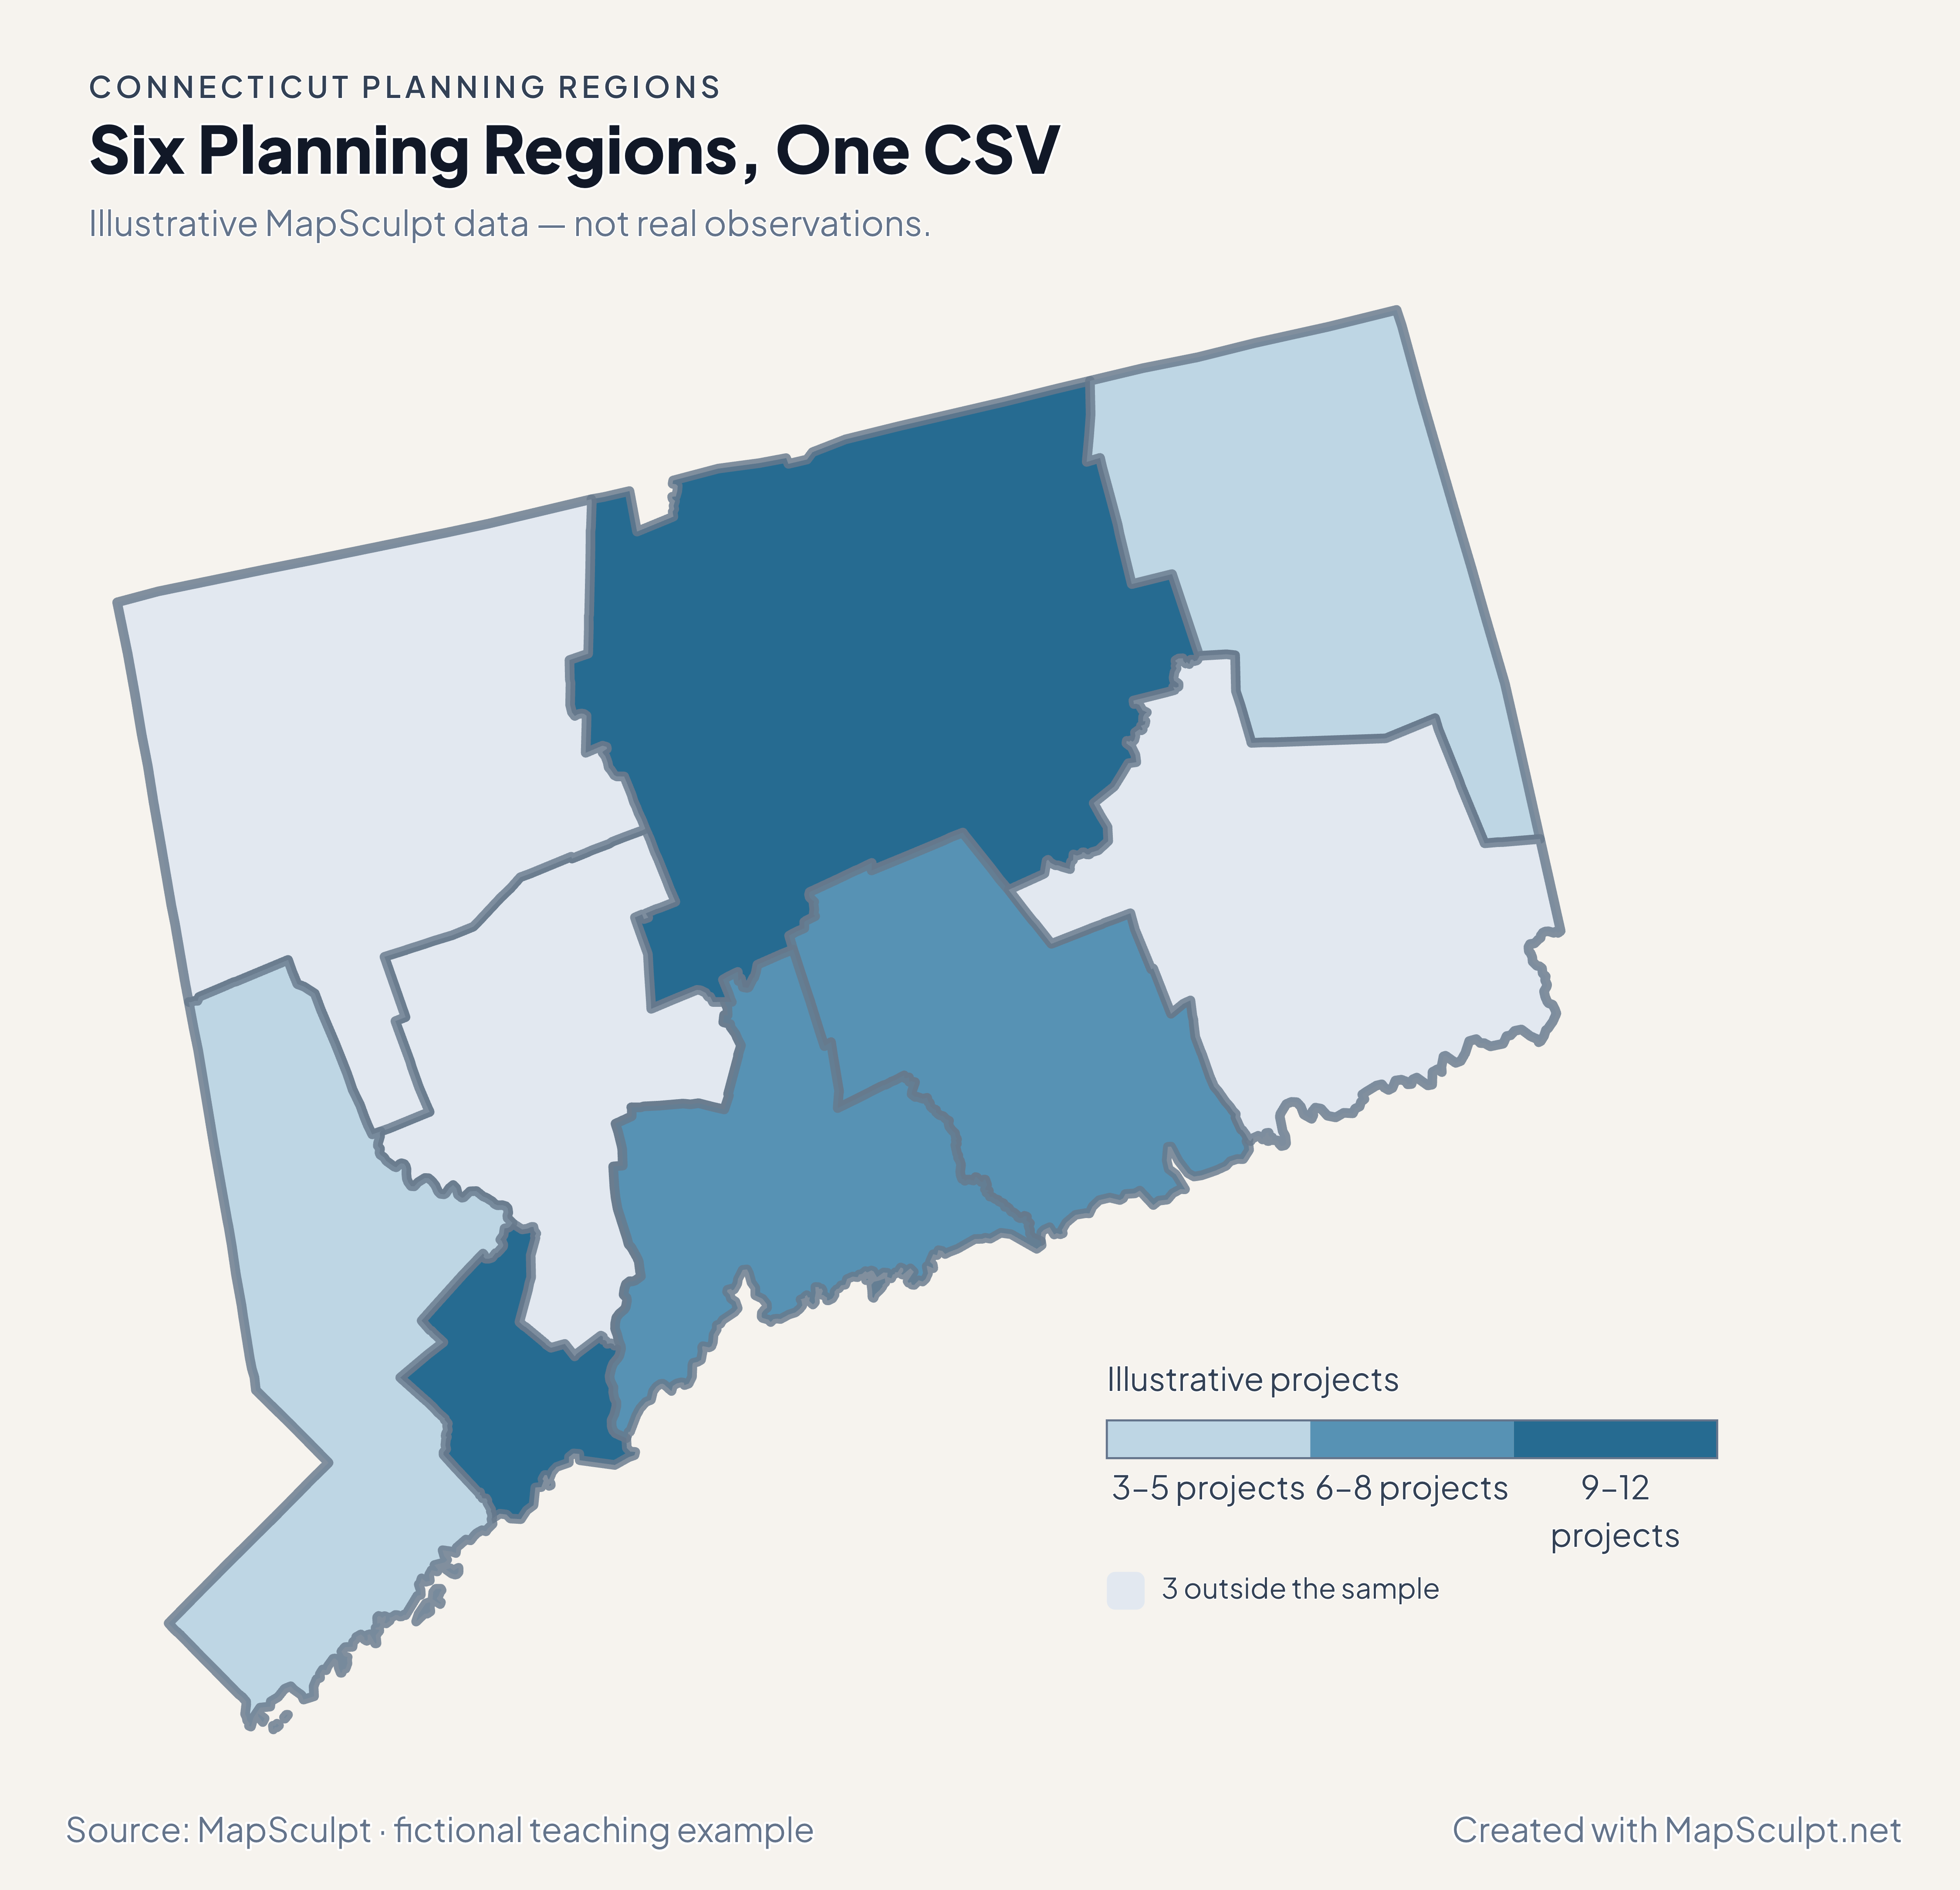
Import the fictional project counts and apply three custom classes. The other 3 planning regions stay neutral.

Illustrative MapSculpt data — not real observations.
Planning regionGEOIDProjects
Capitol Planning Region0911012
Greater Bridgeport Planning Region091209
Lower Connecticut River Valley Planning Region091307
Northeastern Connecticut Planning Region091503
South Central Connecticut Planning Region091708
Western Connecticut Planning Region091905

Keep five-digit GEOIDs as text. The sample uses 09110 for Capitol Planning Region.

Download illustrative CSV ↓

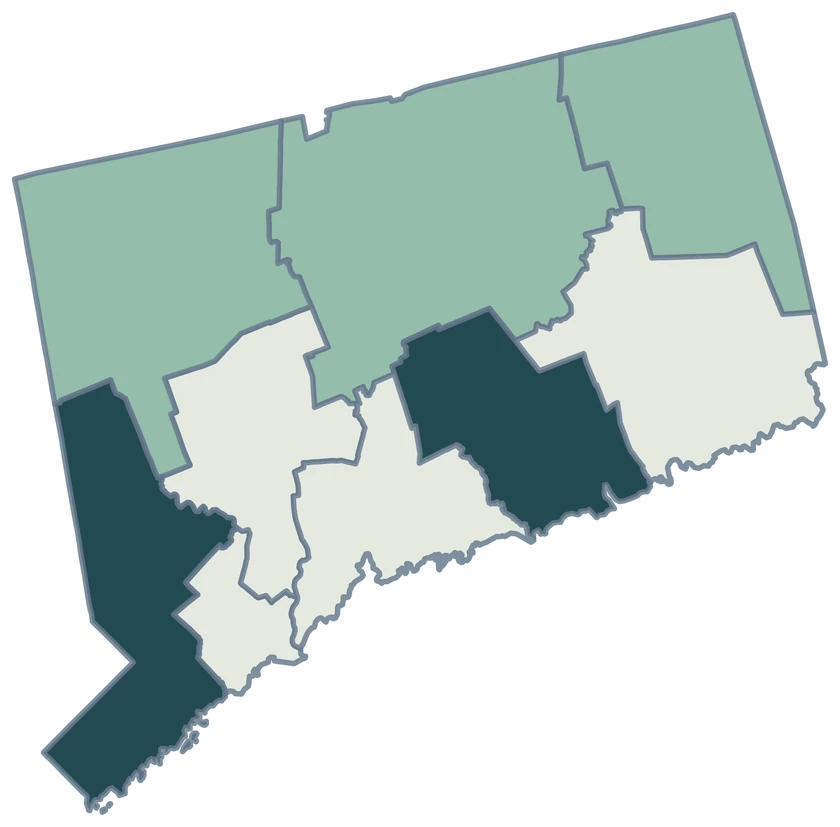
Six Planning Regions, One CSV

Illustrative MapSculpt data — not real observations.

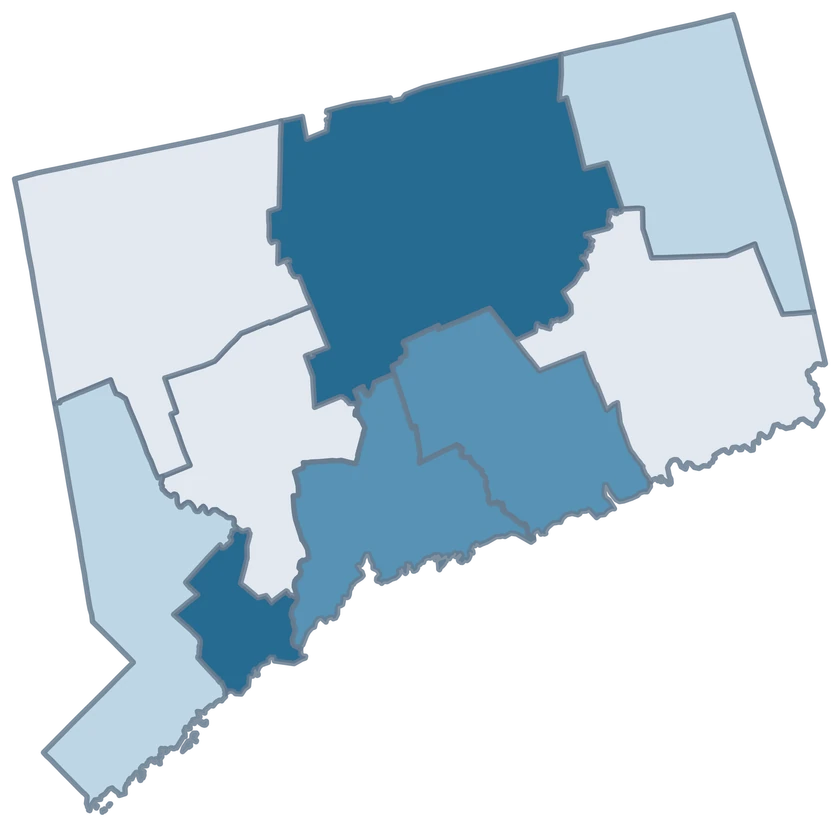
Connecticut illustrative project counts for six planning regions; 3 planning regions remain neutral.

Illustrative projects

  • 3–5 projects
  • 6–8 projects
  • 9–12 projects
  • 3 outside the sample
Download complete PNG

CSV → Match 6 planning regions → Style → Export PNG Create a Connecticut map

GEOGRAPHY NOTES

Connecticut’s geographic change

The Census Bureau announced the final switch to planning regions in June 2022. Use the geography and vintage specified by the data publisher when combining Connecticut tables.

Connecticut Office of Policy and Management

PLANNING REGION REFERENCE

All 9 Connecticut planning regions and GEOIDs.

Official planning region names and five-digit Census GEOIDs. Search by name or code.

  1. Capitol Planning RegionGEOID 09110
  2. Greater Bridgeport Planning RegionGEOID 09120
  3. Lower Connecticut River Valley Planning RegionGEOID 09130
  4. Naugatuck Valley Planning RegionGEOID 09140
  5. Northeastern Connecticut Planning RegionGEOID 09150
  6. Northwest Hills Planning RegionGEOID 09160
  7. South Central Connecticut Planning RegionGEOID 09170
  8. Southeastern Connecticut Planning RegionGEOID 09180
  9. Western Connecticut Planning RegionGEOID 09190

U.S. Census Bureau · 2025 Cartographic Boundary Files

COMMON QUESTIONS

Connecticut planning region map questions.

Why do some Connecticut maps show eight counties?

They use the historical county boundaries. Census county-equivalent reporting now uses nine planning regions, which this editor implements.

Can I join an older county table to these nine regions?

Use a source published for the planning regions or derive compatible measures from appropriate smaller geographies. The legacy county GEOIDs do not join directly.

Which GEOID identifies the Capitol Planning Region?

Use 09110. The Western Connecticut Planning Region uses 09190. Store these identifiers as text so the leading zero survives spreadsheet import.

Does Greater Bridgeport represent only the city?

The planning region includes multiple municipalities. A city-only tabulation should not be used as the planning-region value.

Can I color only six of the nine regions?

Yes. The illustrative CSV uses six GEOIDs. The remaining three regions keep the distinct neutral fill.

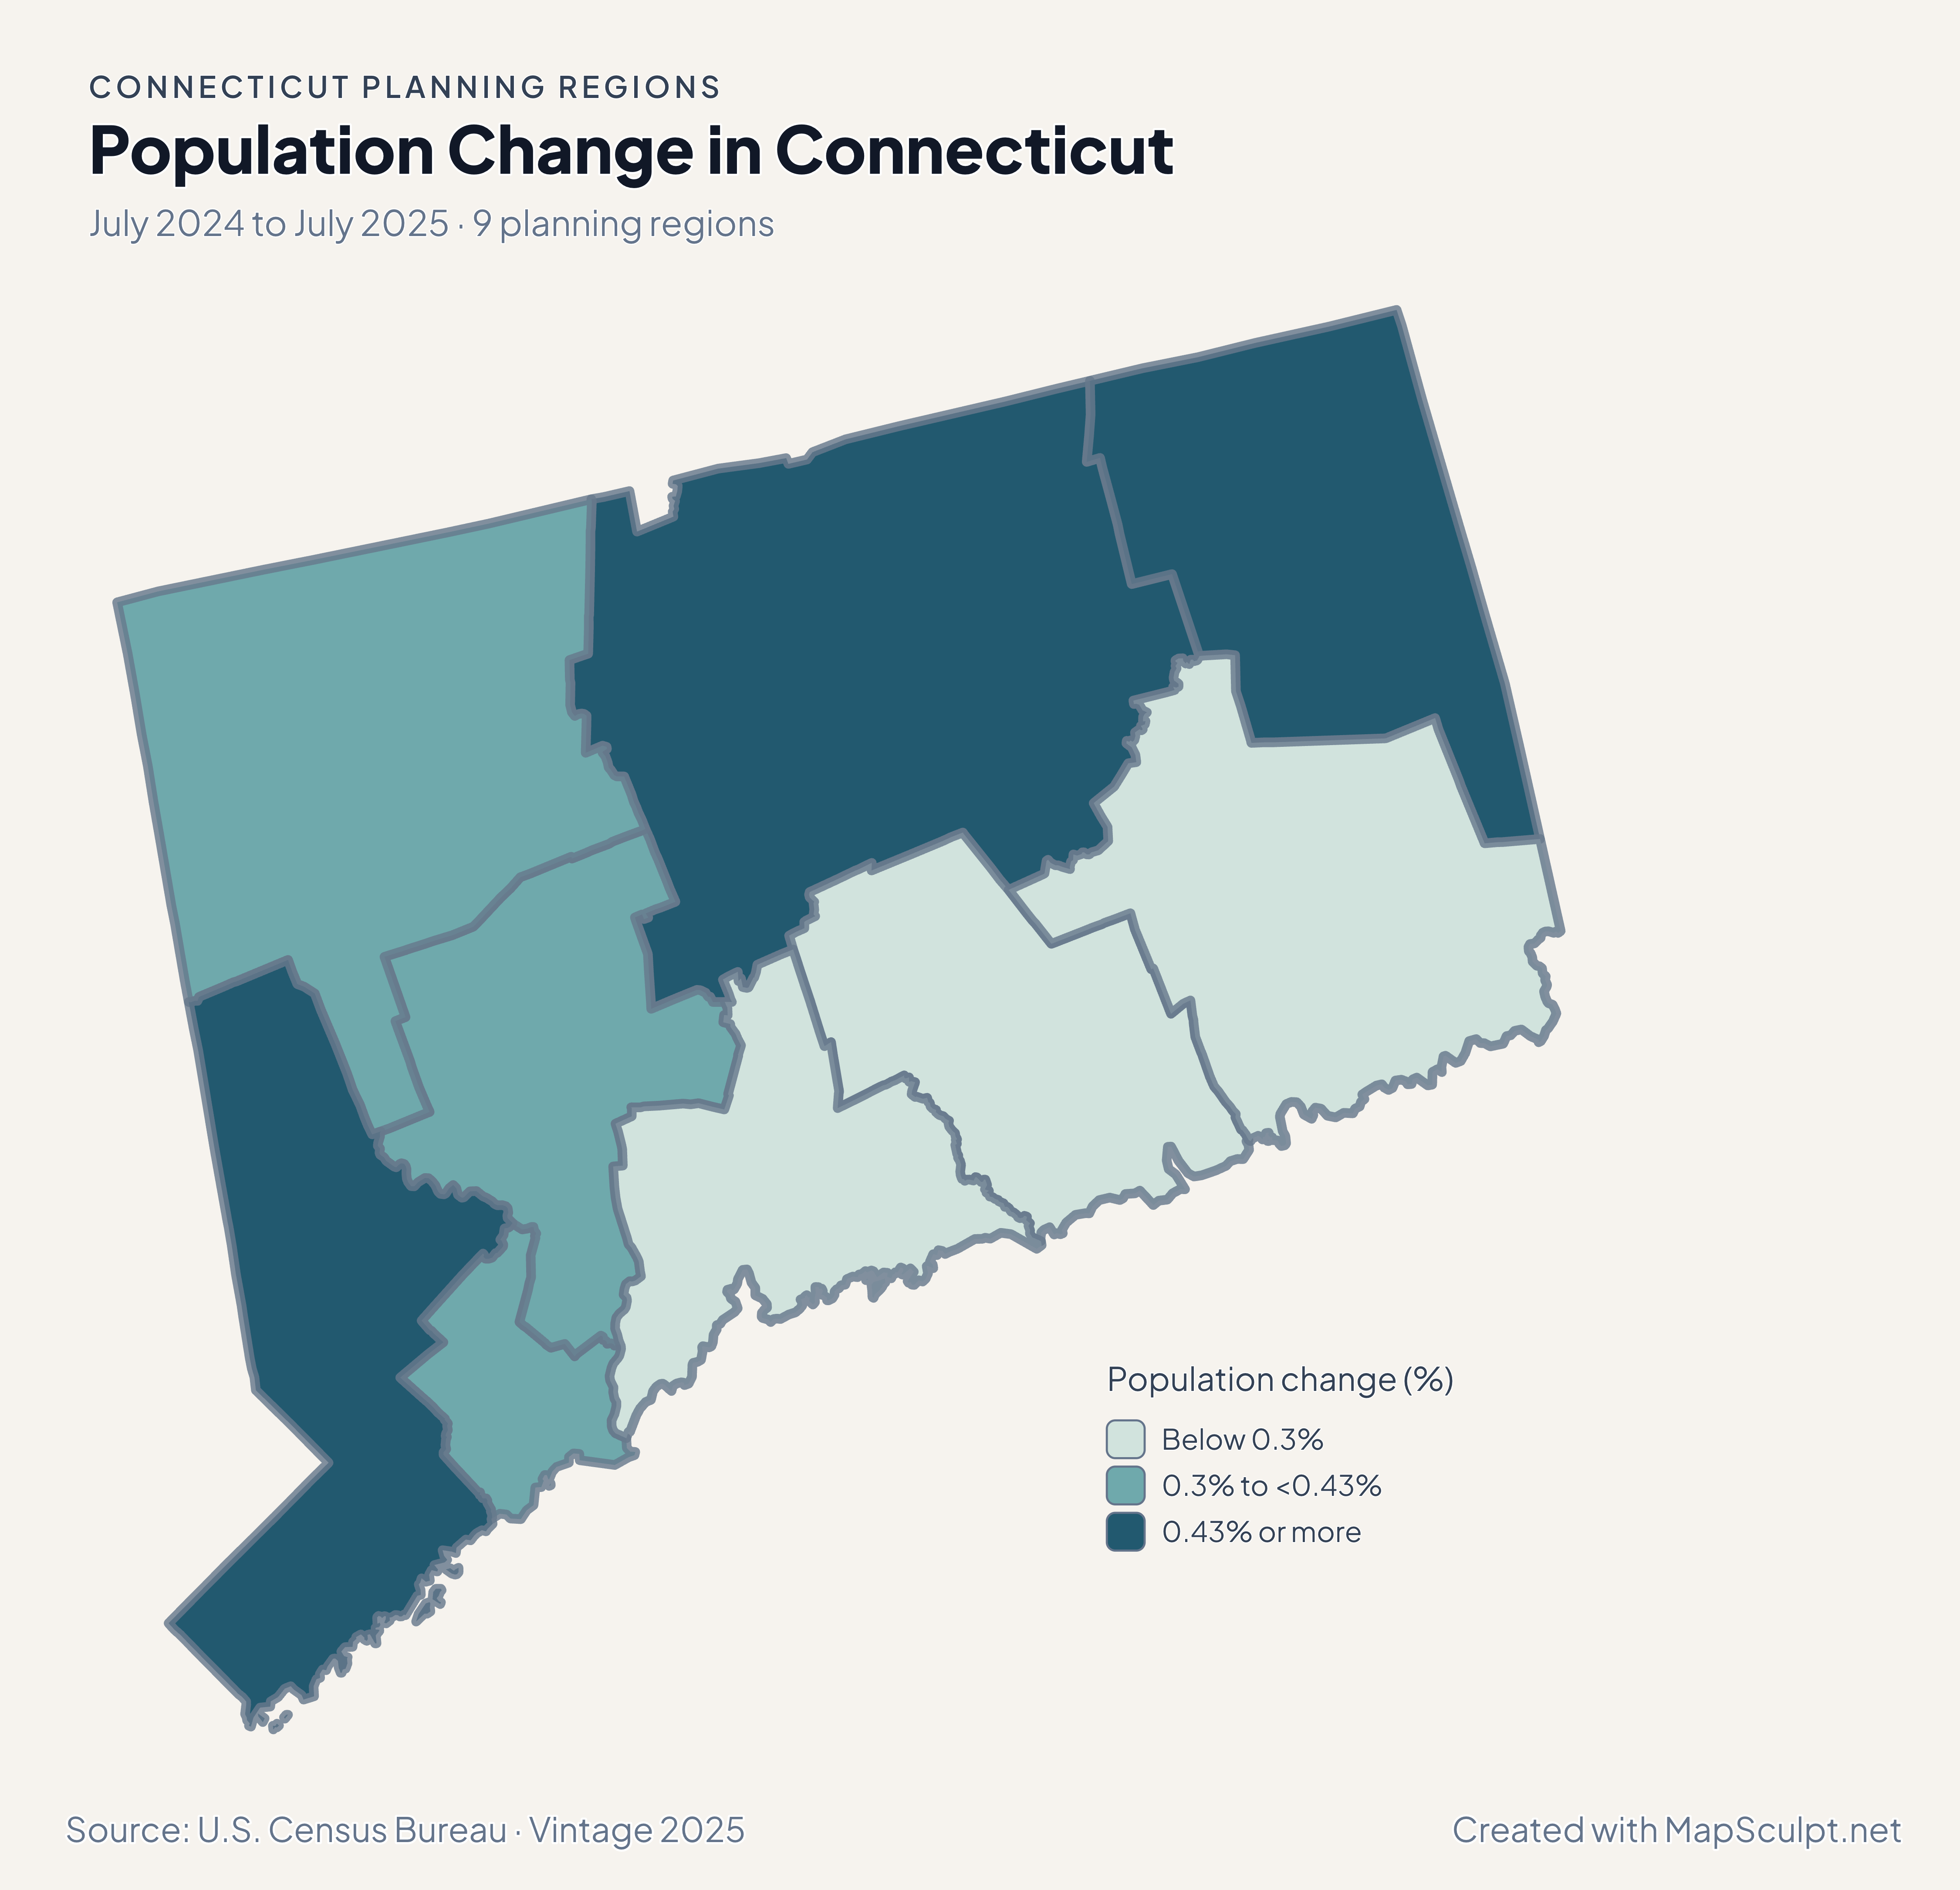
Why did Greater Bridgeport gain population with net domestic losses?

Net domestic moves measure moves within the United States. Total population estimates include other components such as international migration and natural change.

YOUR NEXT MAP STARTS HERE

Build your own Connecticut map.

Join your records by GEOID, check the planning regions that matched, and export with a legend and source.

Create a Connecticut map