Skip to content
MapSculpt

GEOGRAPHIC MAP MAKER / OHIO

Ohio
Counties Map Maker

Compare county growth around Columbus, along Lake Erie and toward the Ohio River. Use Ohio’s 88 county boundaries to show where a change is concentrated and put your own numbers in context.

Free online editor · No sign-up required

88counties
individually editable

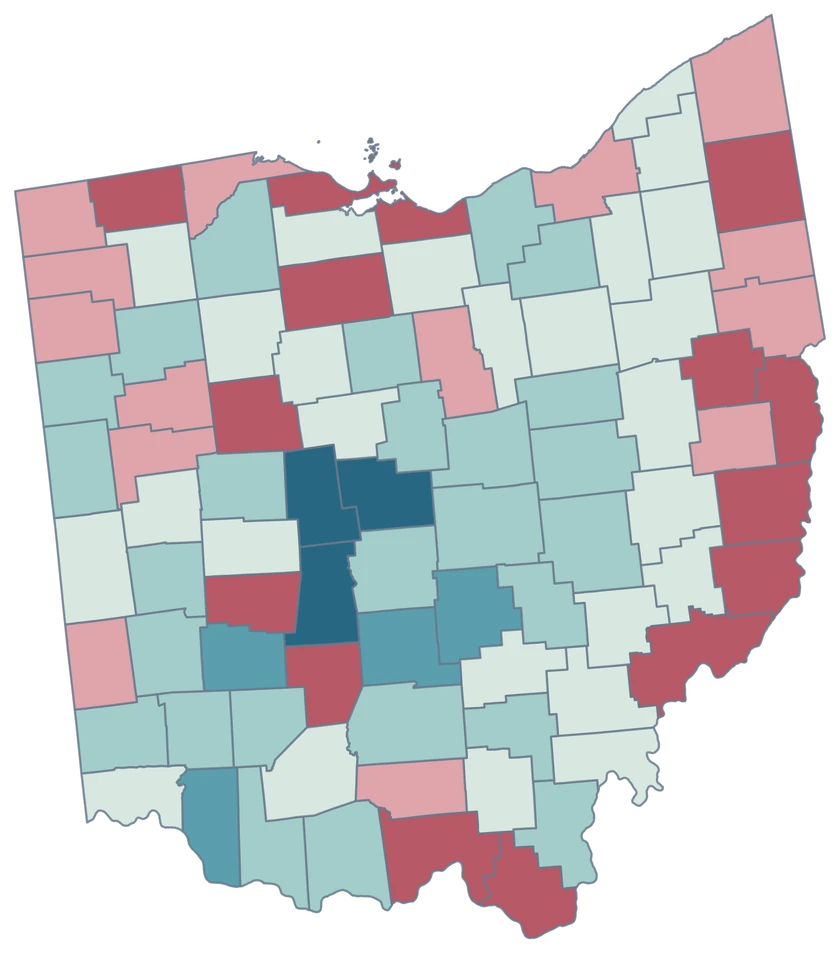
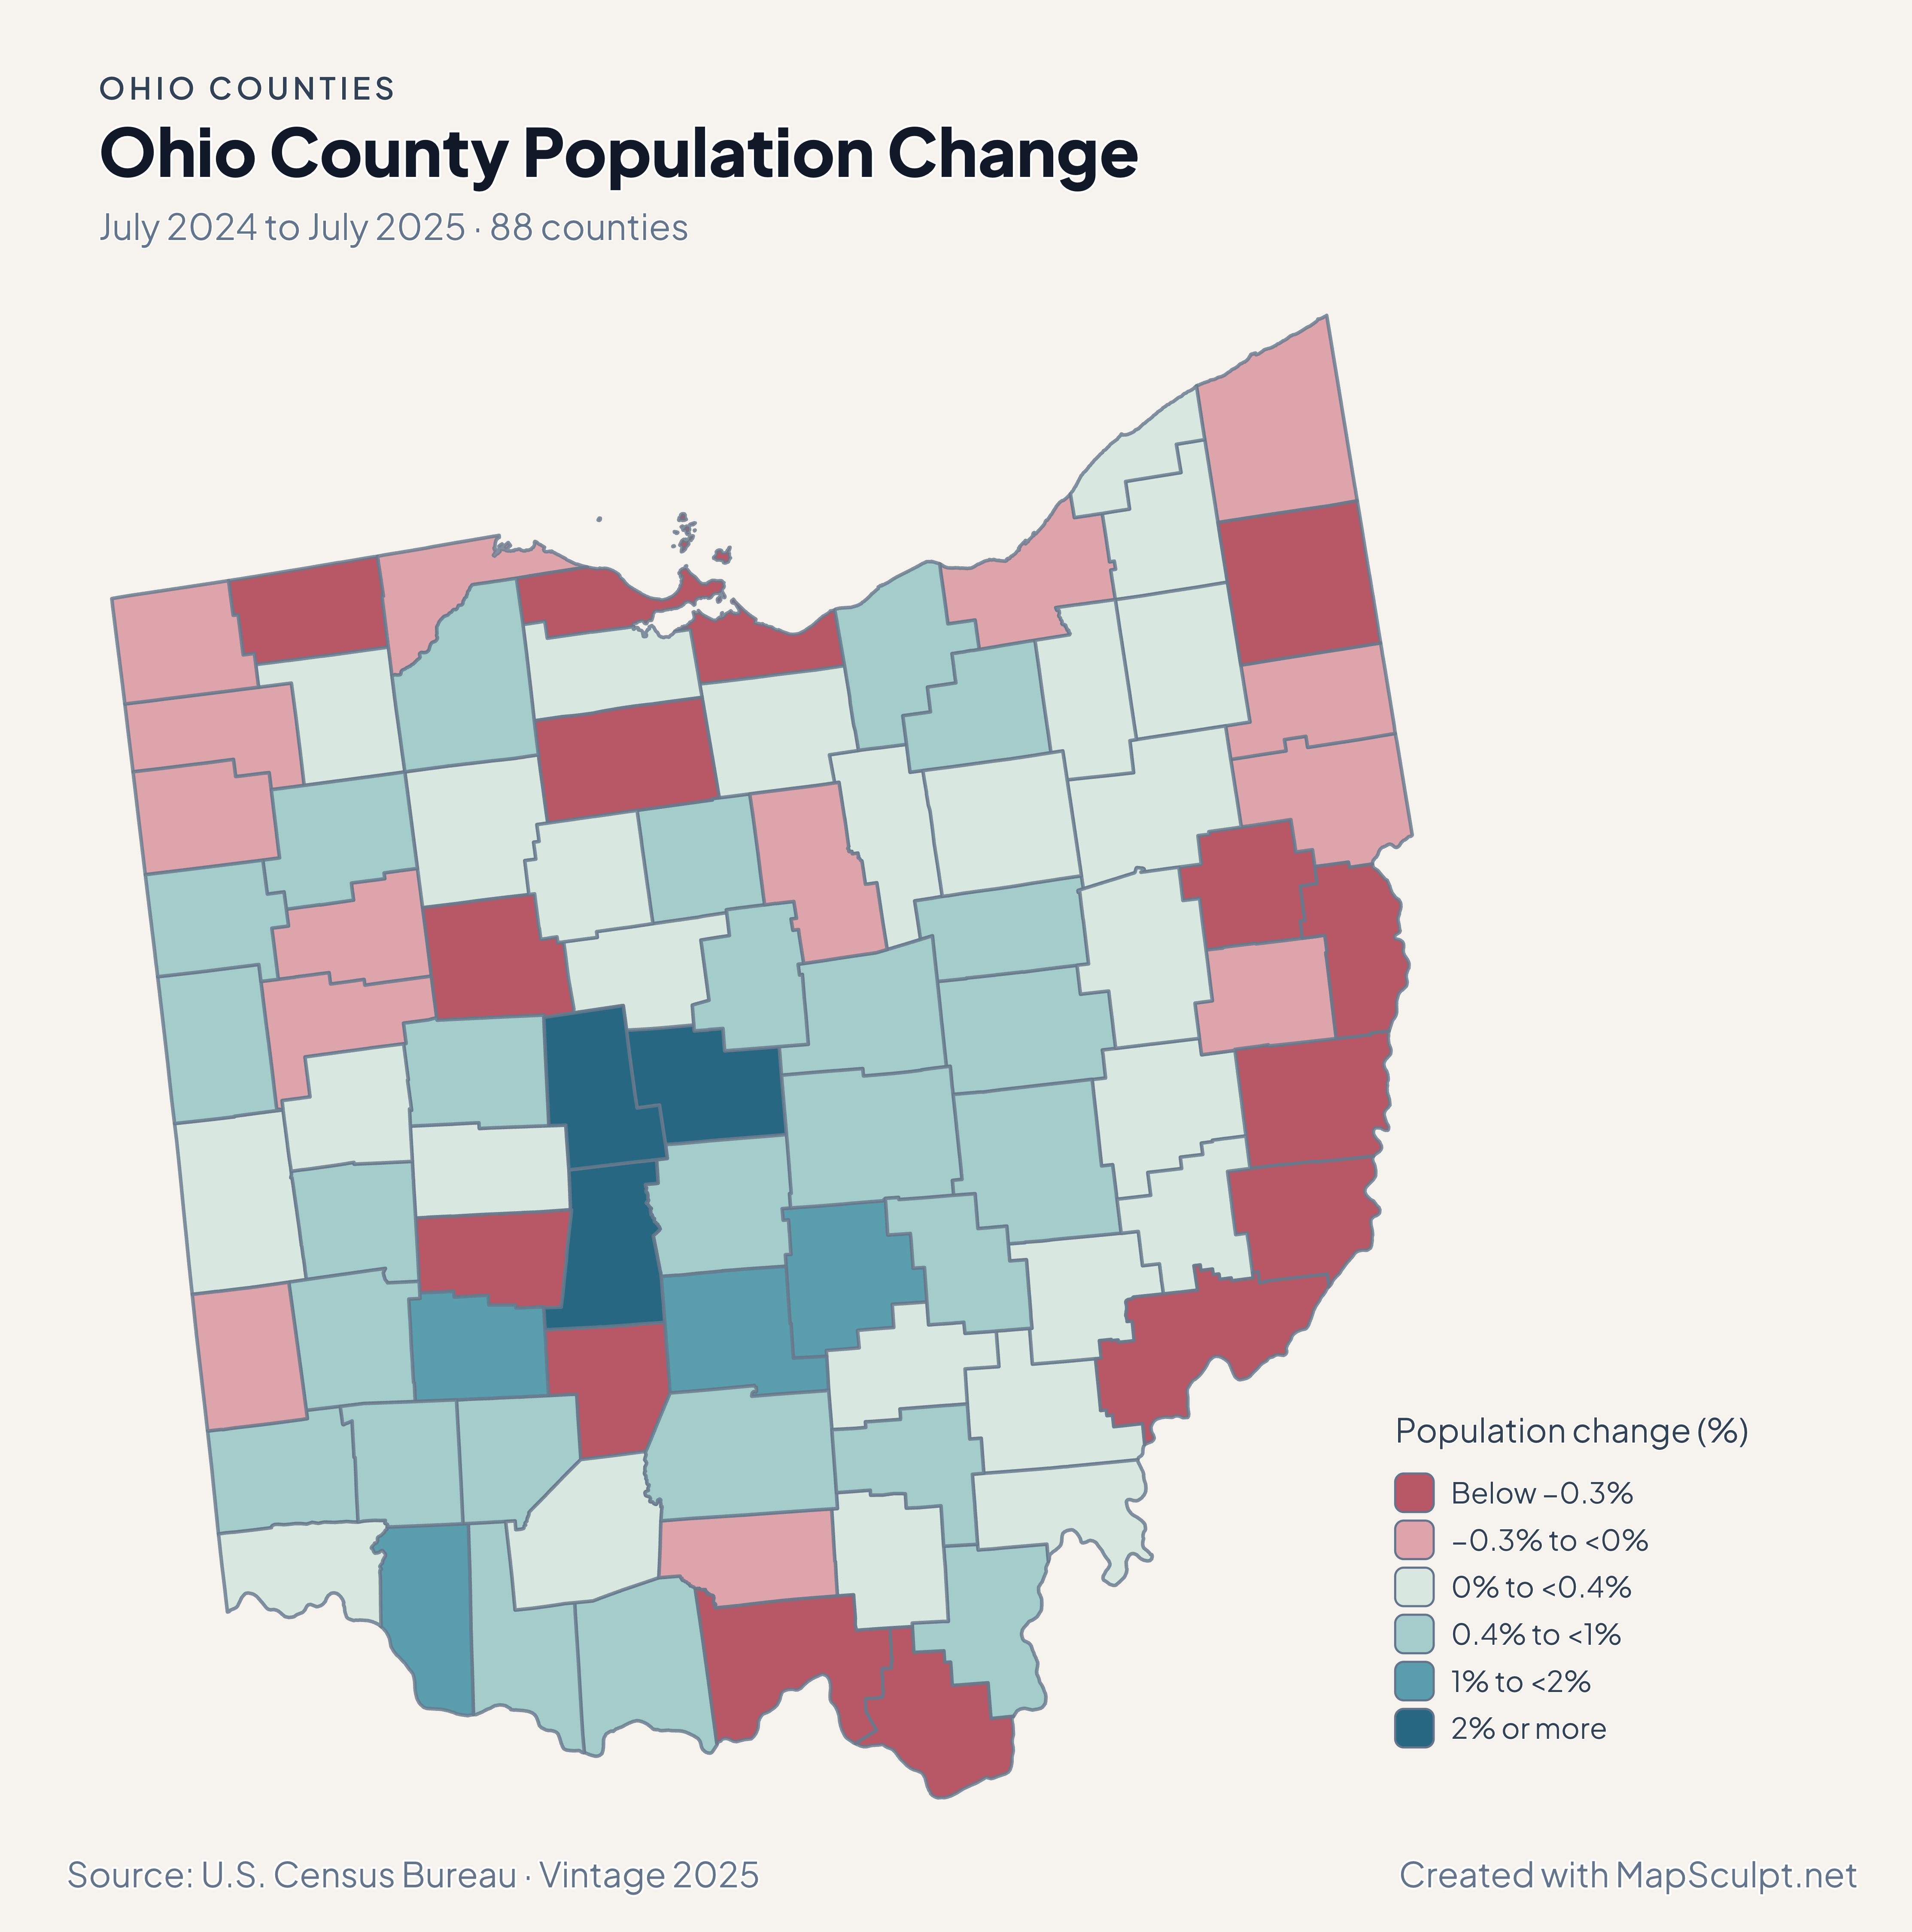
Ohio County Population Change

July 2024 to July 2025 · 88 counties

Ohio population change map with Madison, Delaware and Union shaded in the top growth class.

Population change (%)

  • Below −0.3%
  • −0.3% to <0%
  • 0% to <0.4%
  • 0.4% to <1%
  • 1% to <2%
  • 2% or more
U.S. Census Bureau · Vintage 2025Download complete PNG Percentage change compares each county with its own July 2024 population.

KNOW YOUR GEOGRAPHY

Columbus, Lake Erie and the Ohio River.

The county map follows Ohio from the Lake Erie shore to the river border in the south. Franklin, Delaware, Madison and Union are separate county features, so you can compare the Columbus area without assigning it one fill.

Values attached to Cleveland, Cincinnati or another municipality need to be checked for geographic coverage. Join data at county scale when it describes Cuyahoga, Hamilton or another entire county.

Browse all county GEOIDs ↗

2025 Census boundaries

OFFICIAL DATA

Central Ohio stands out in the latest estimates.

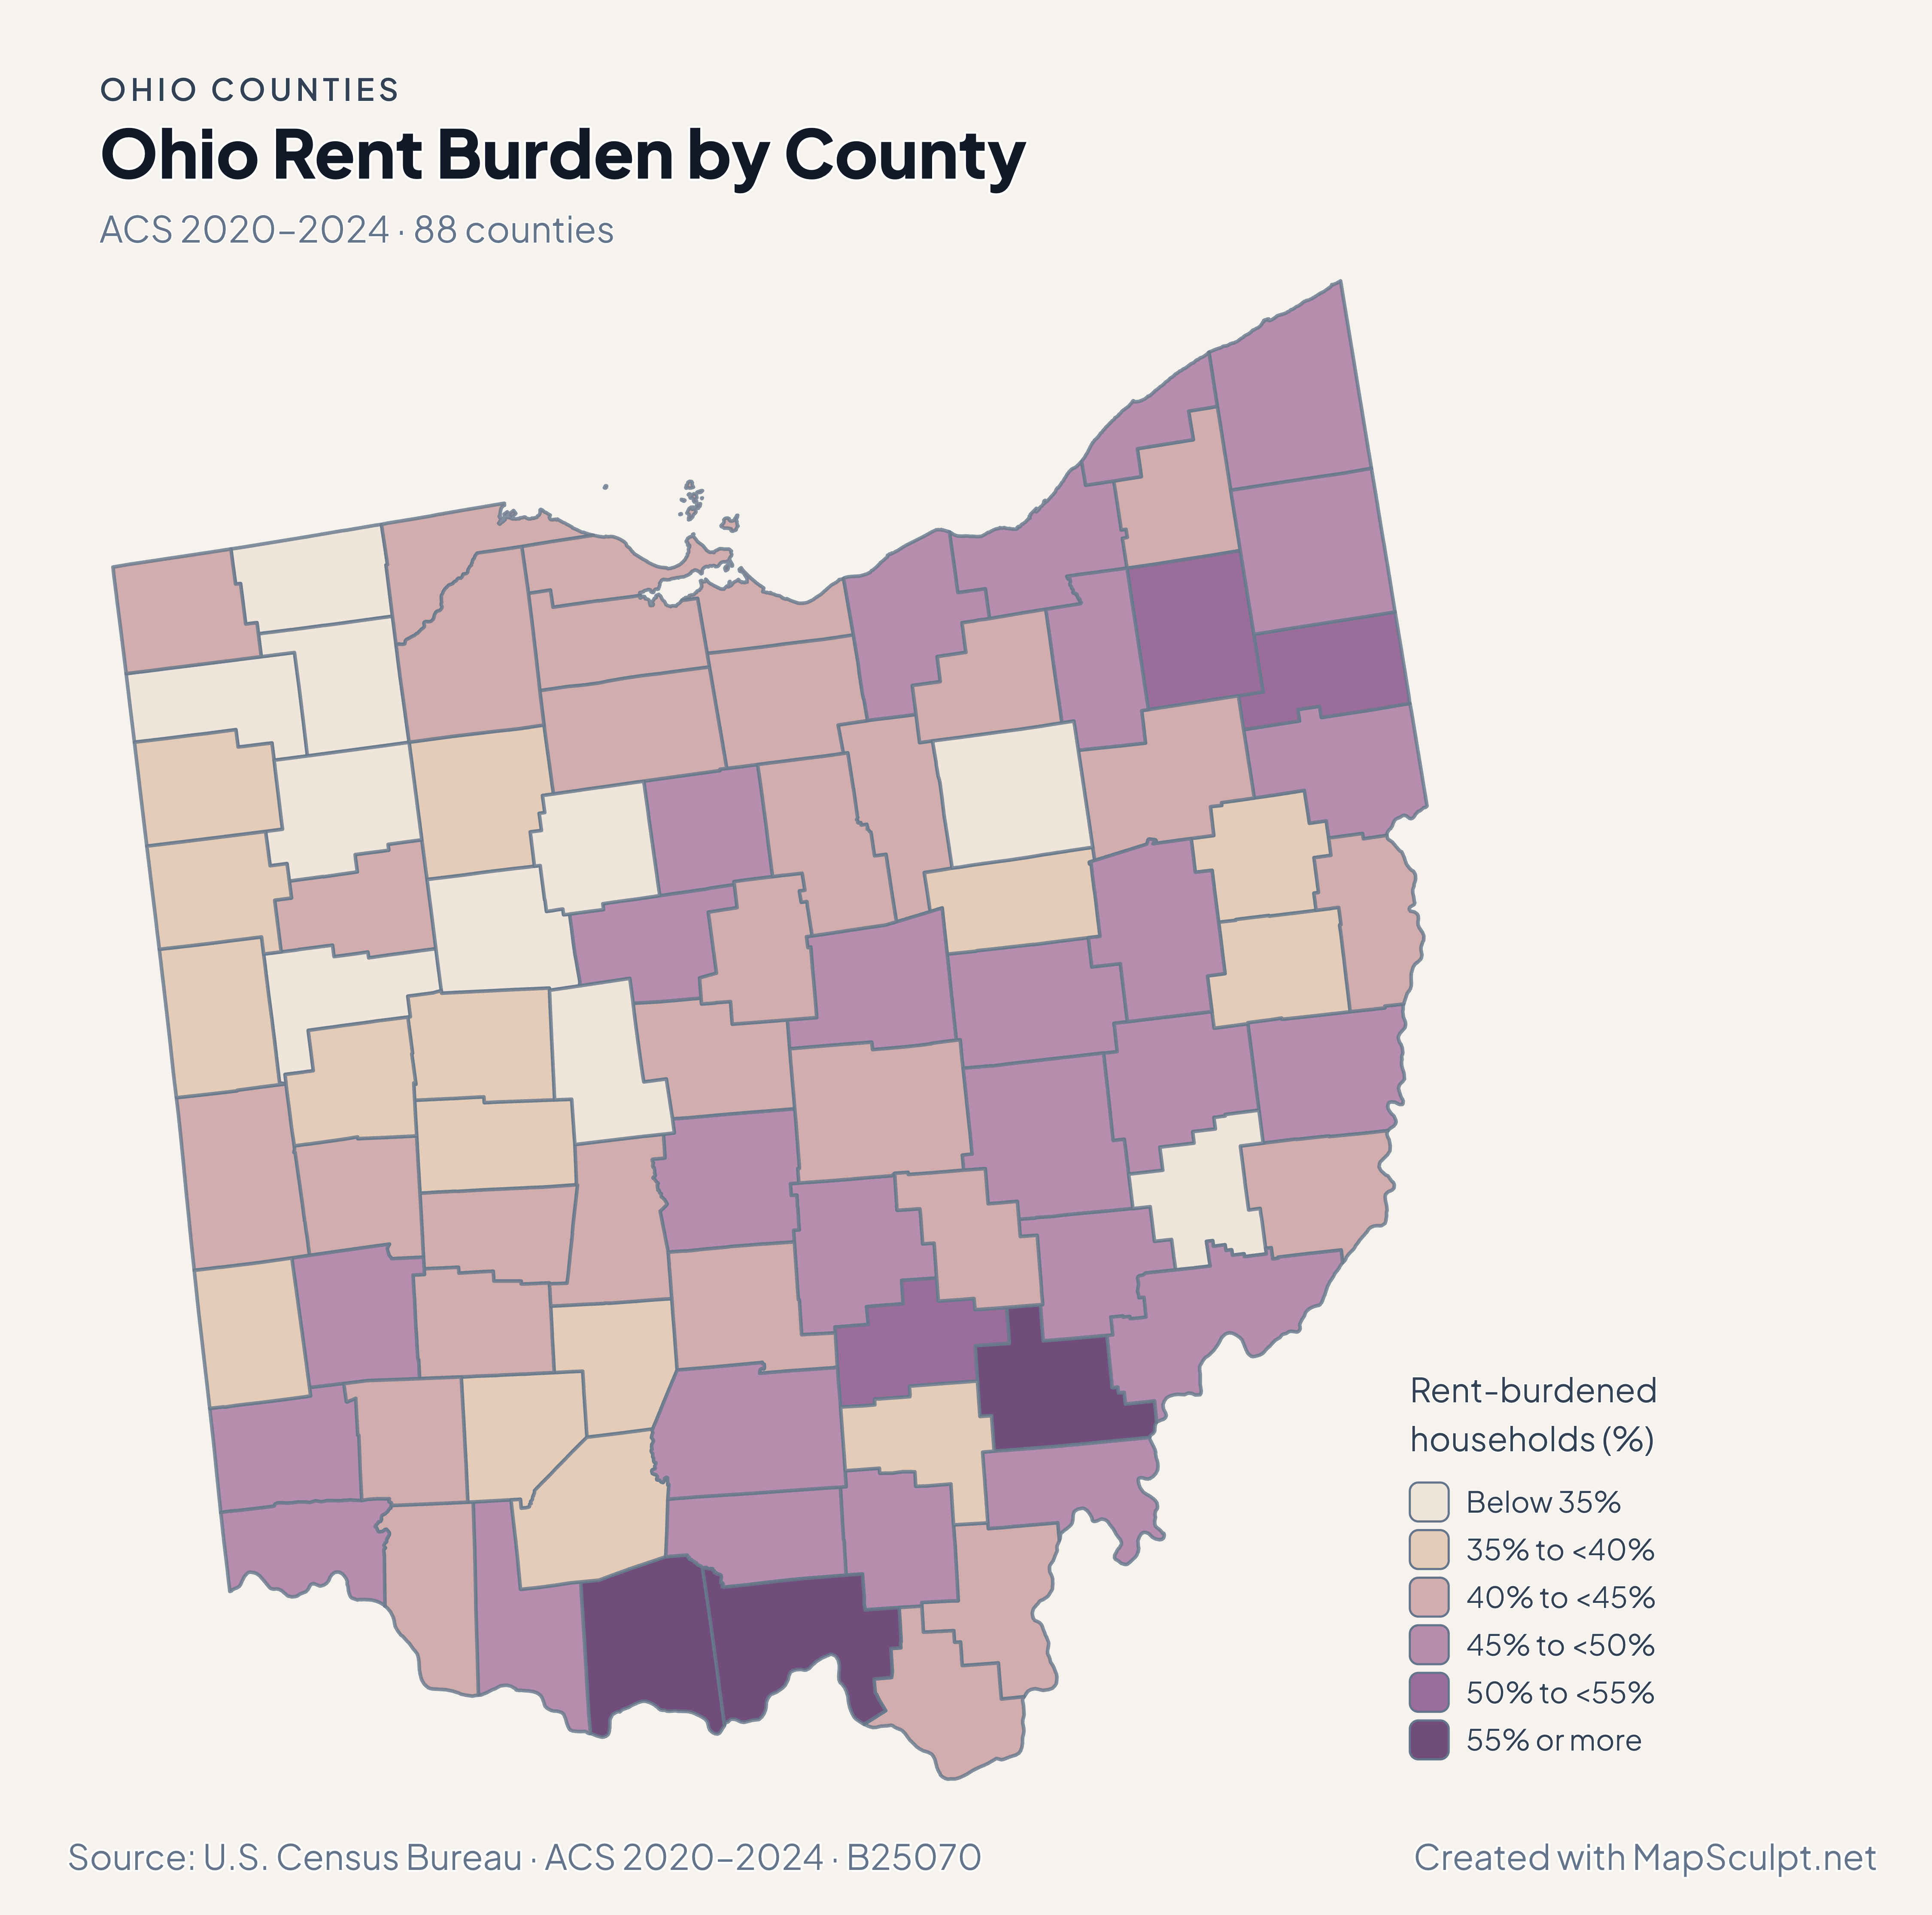
Compare relative growth near Columbus with income and migration patterns elsewhere in Ohio. Keep the reference period beside each comparison.

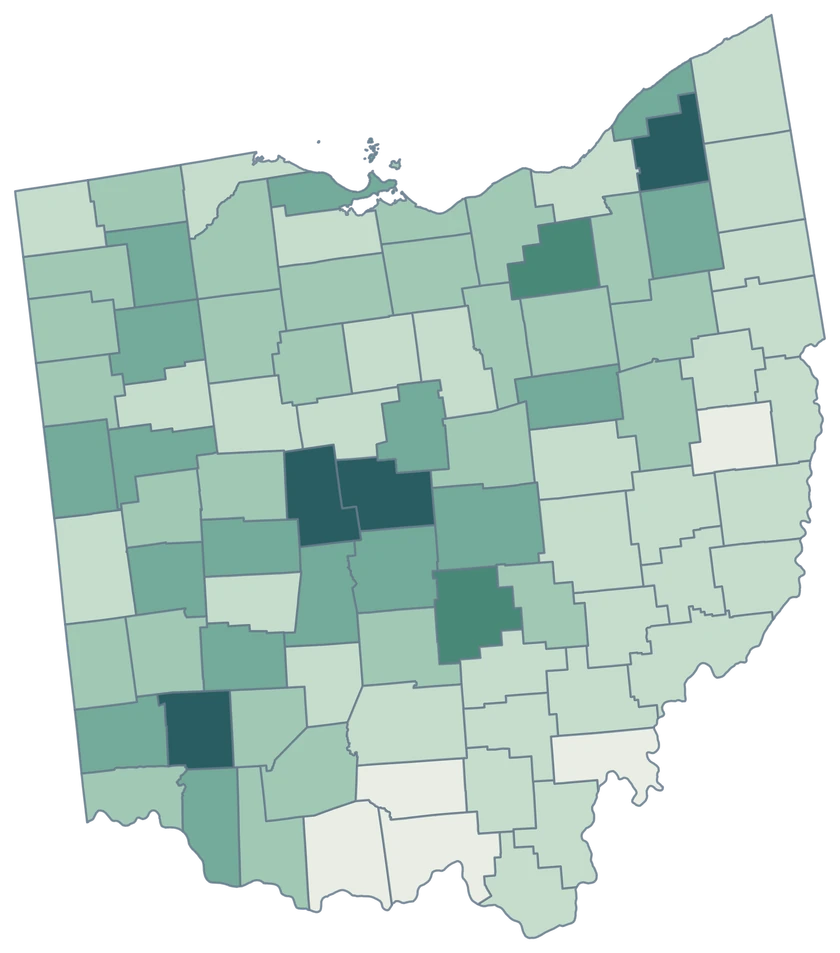
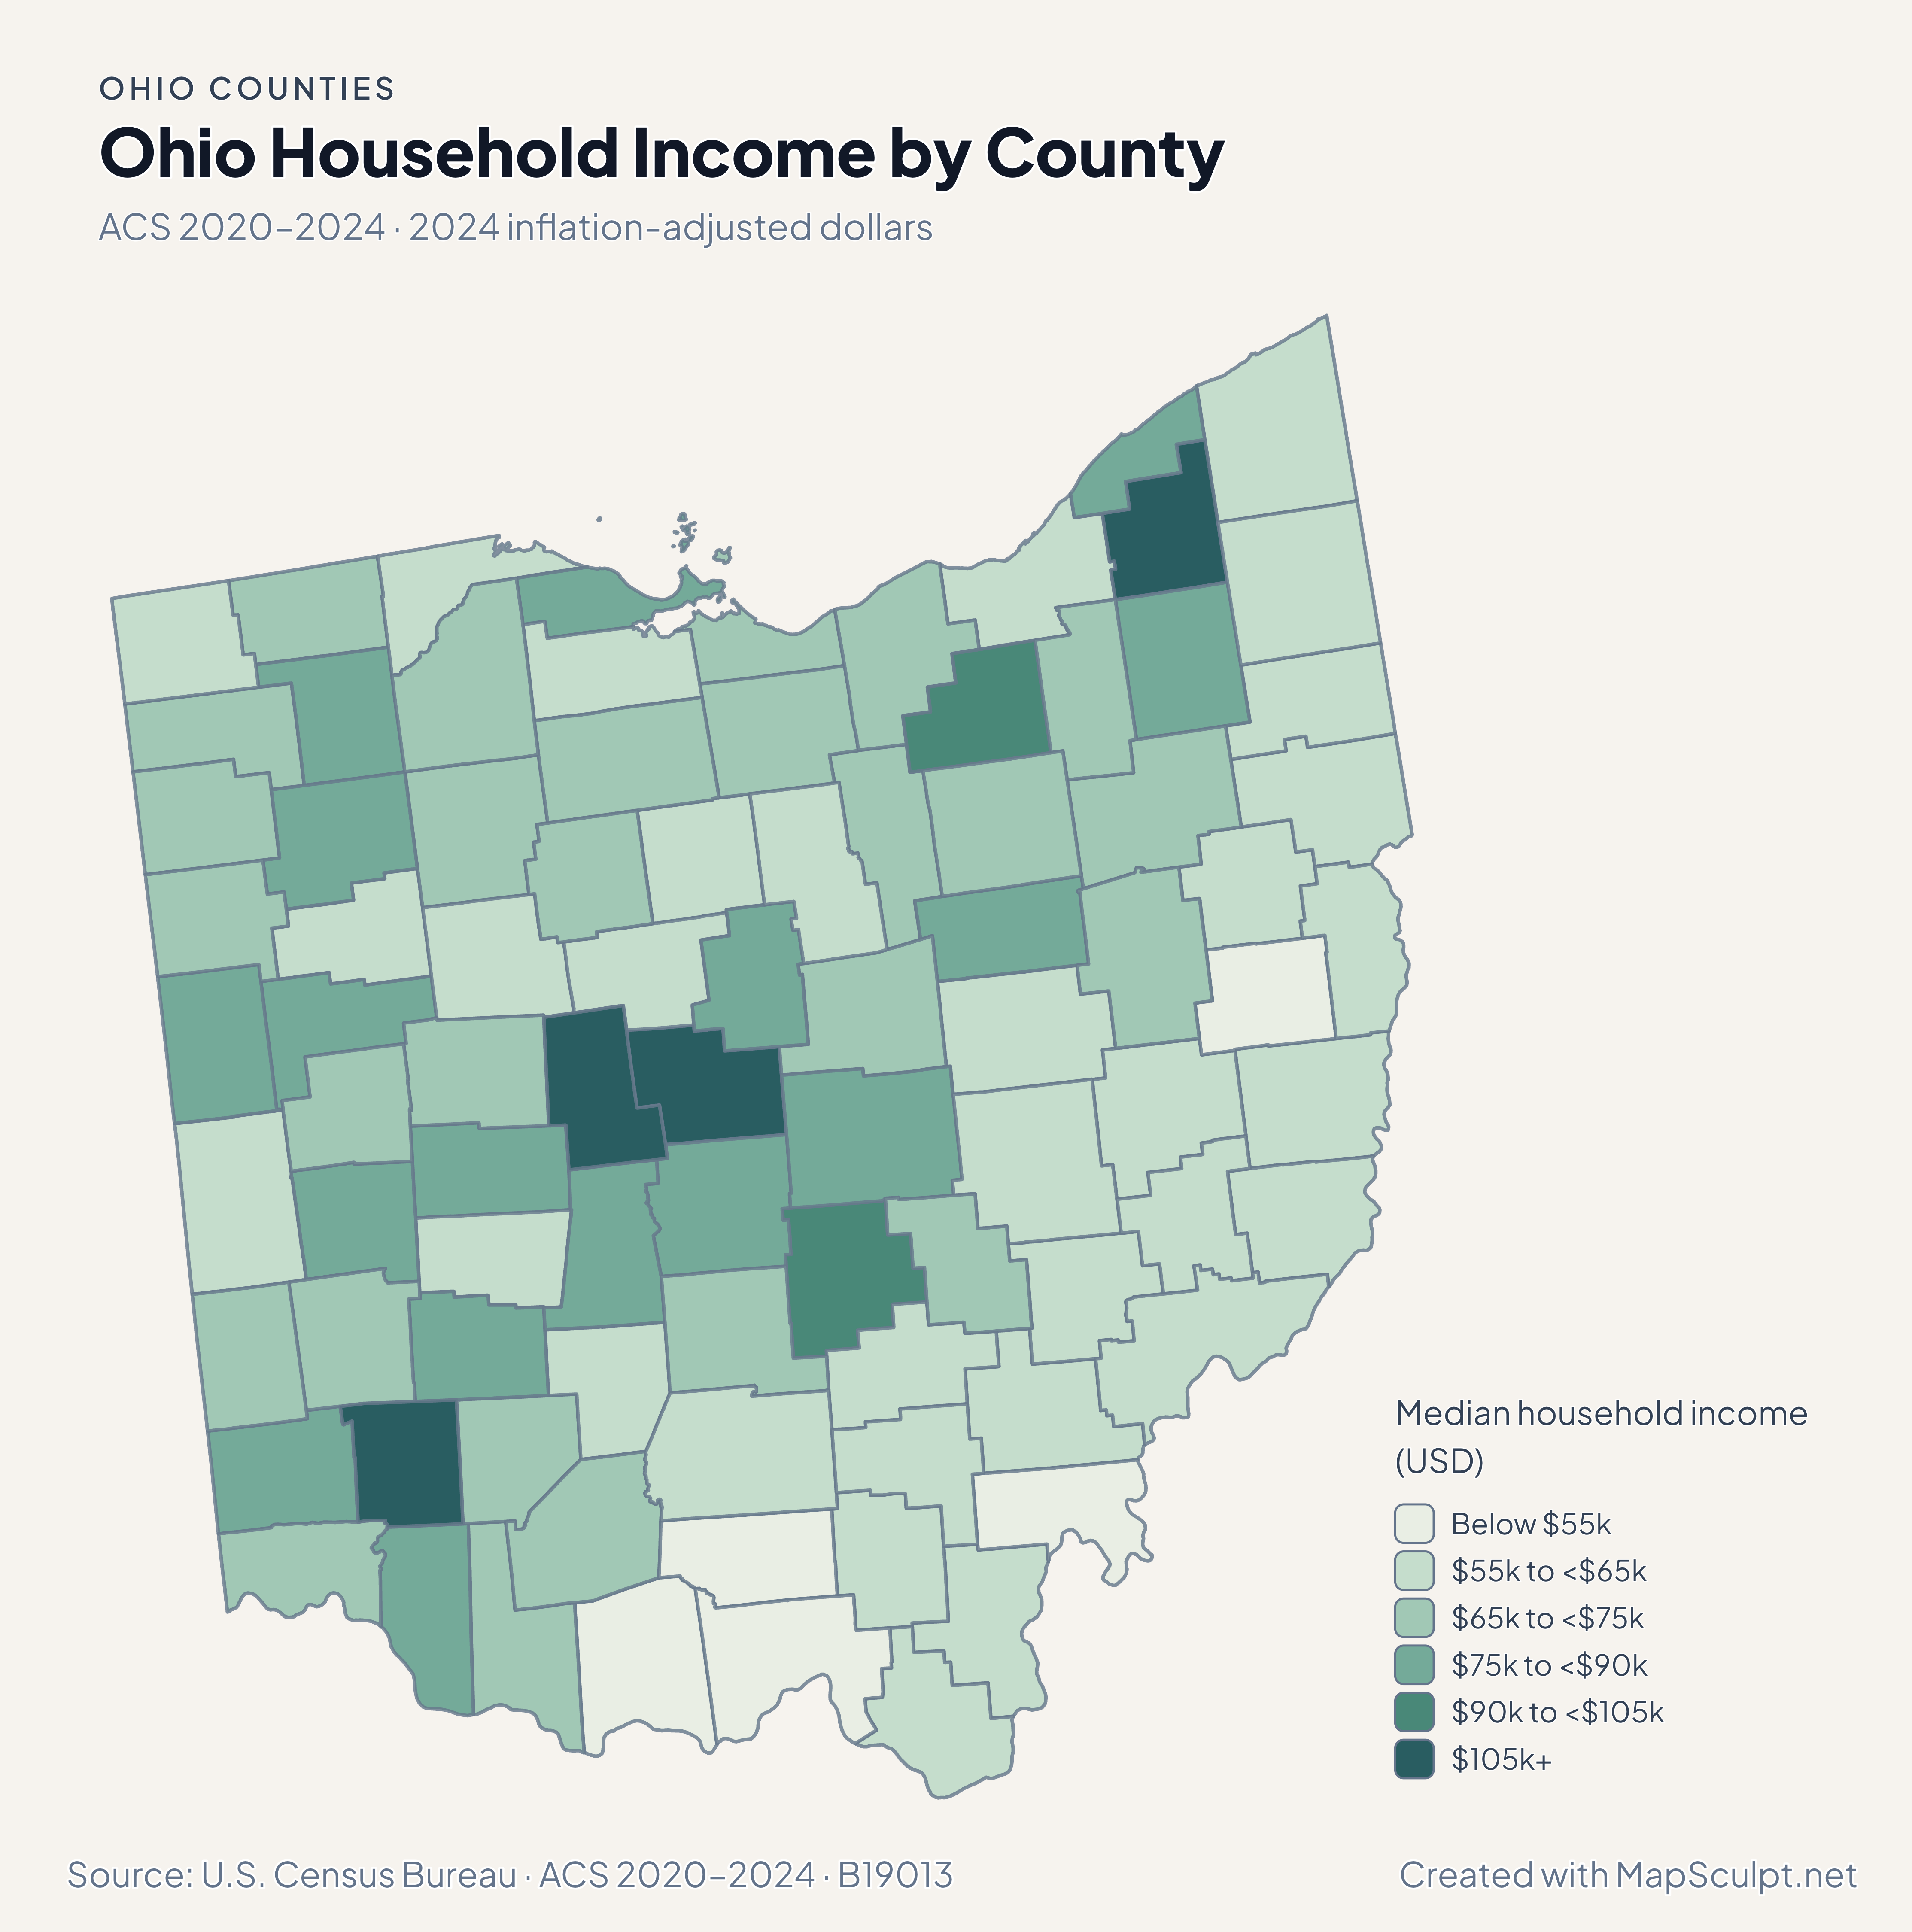
Ohio household income map with Delaware in the darkest band and Meigs in the lightest.

ACS 2020–2024 · 2024 inflation-adjusted dollars

Delaware and Meigs bracket the income estimates.

Delaware had the highest county median household income estimate at $133,540, and Meigs had the lowest at $46,873. The sequential classes show how estimates vary across the state without implying that all households inside a county earn similar amounts.

Median household income (USD)

  • Below $55k
  • $55k to <$65k
  • $65k to <$75k
  • $75k to <$90k
  • $90k to <$105k
  • $105k+

U.S. Census Bureau · ACS 2020–2024 · B19013

Download complete PNG

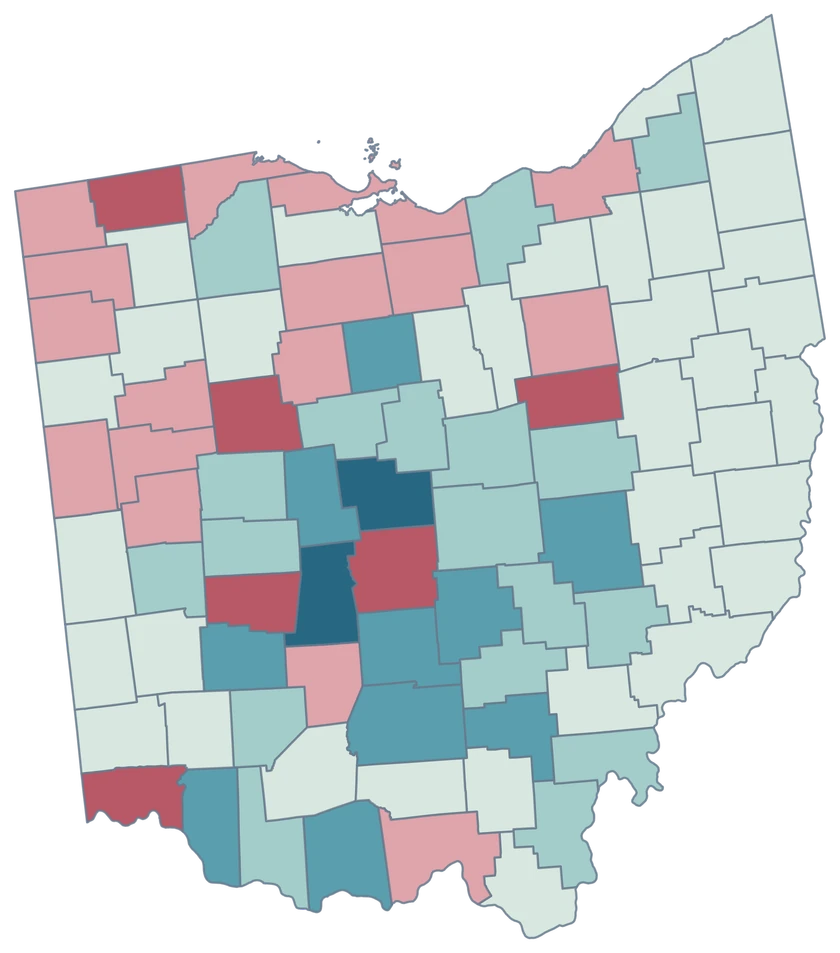
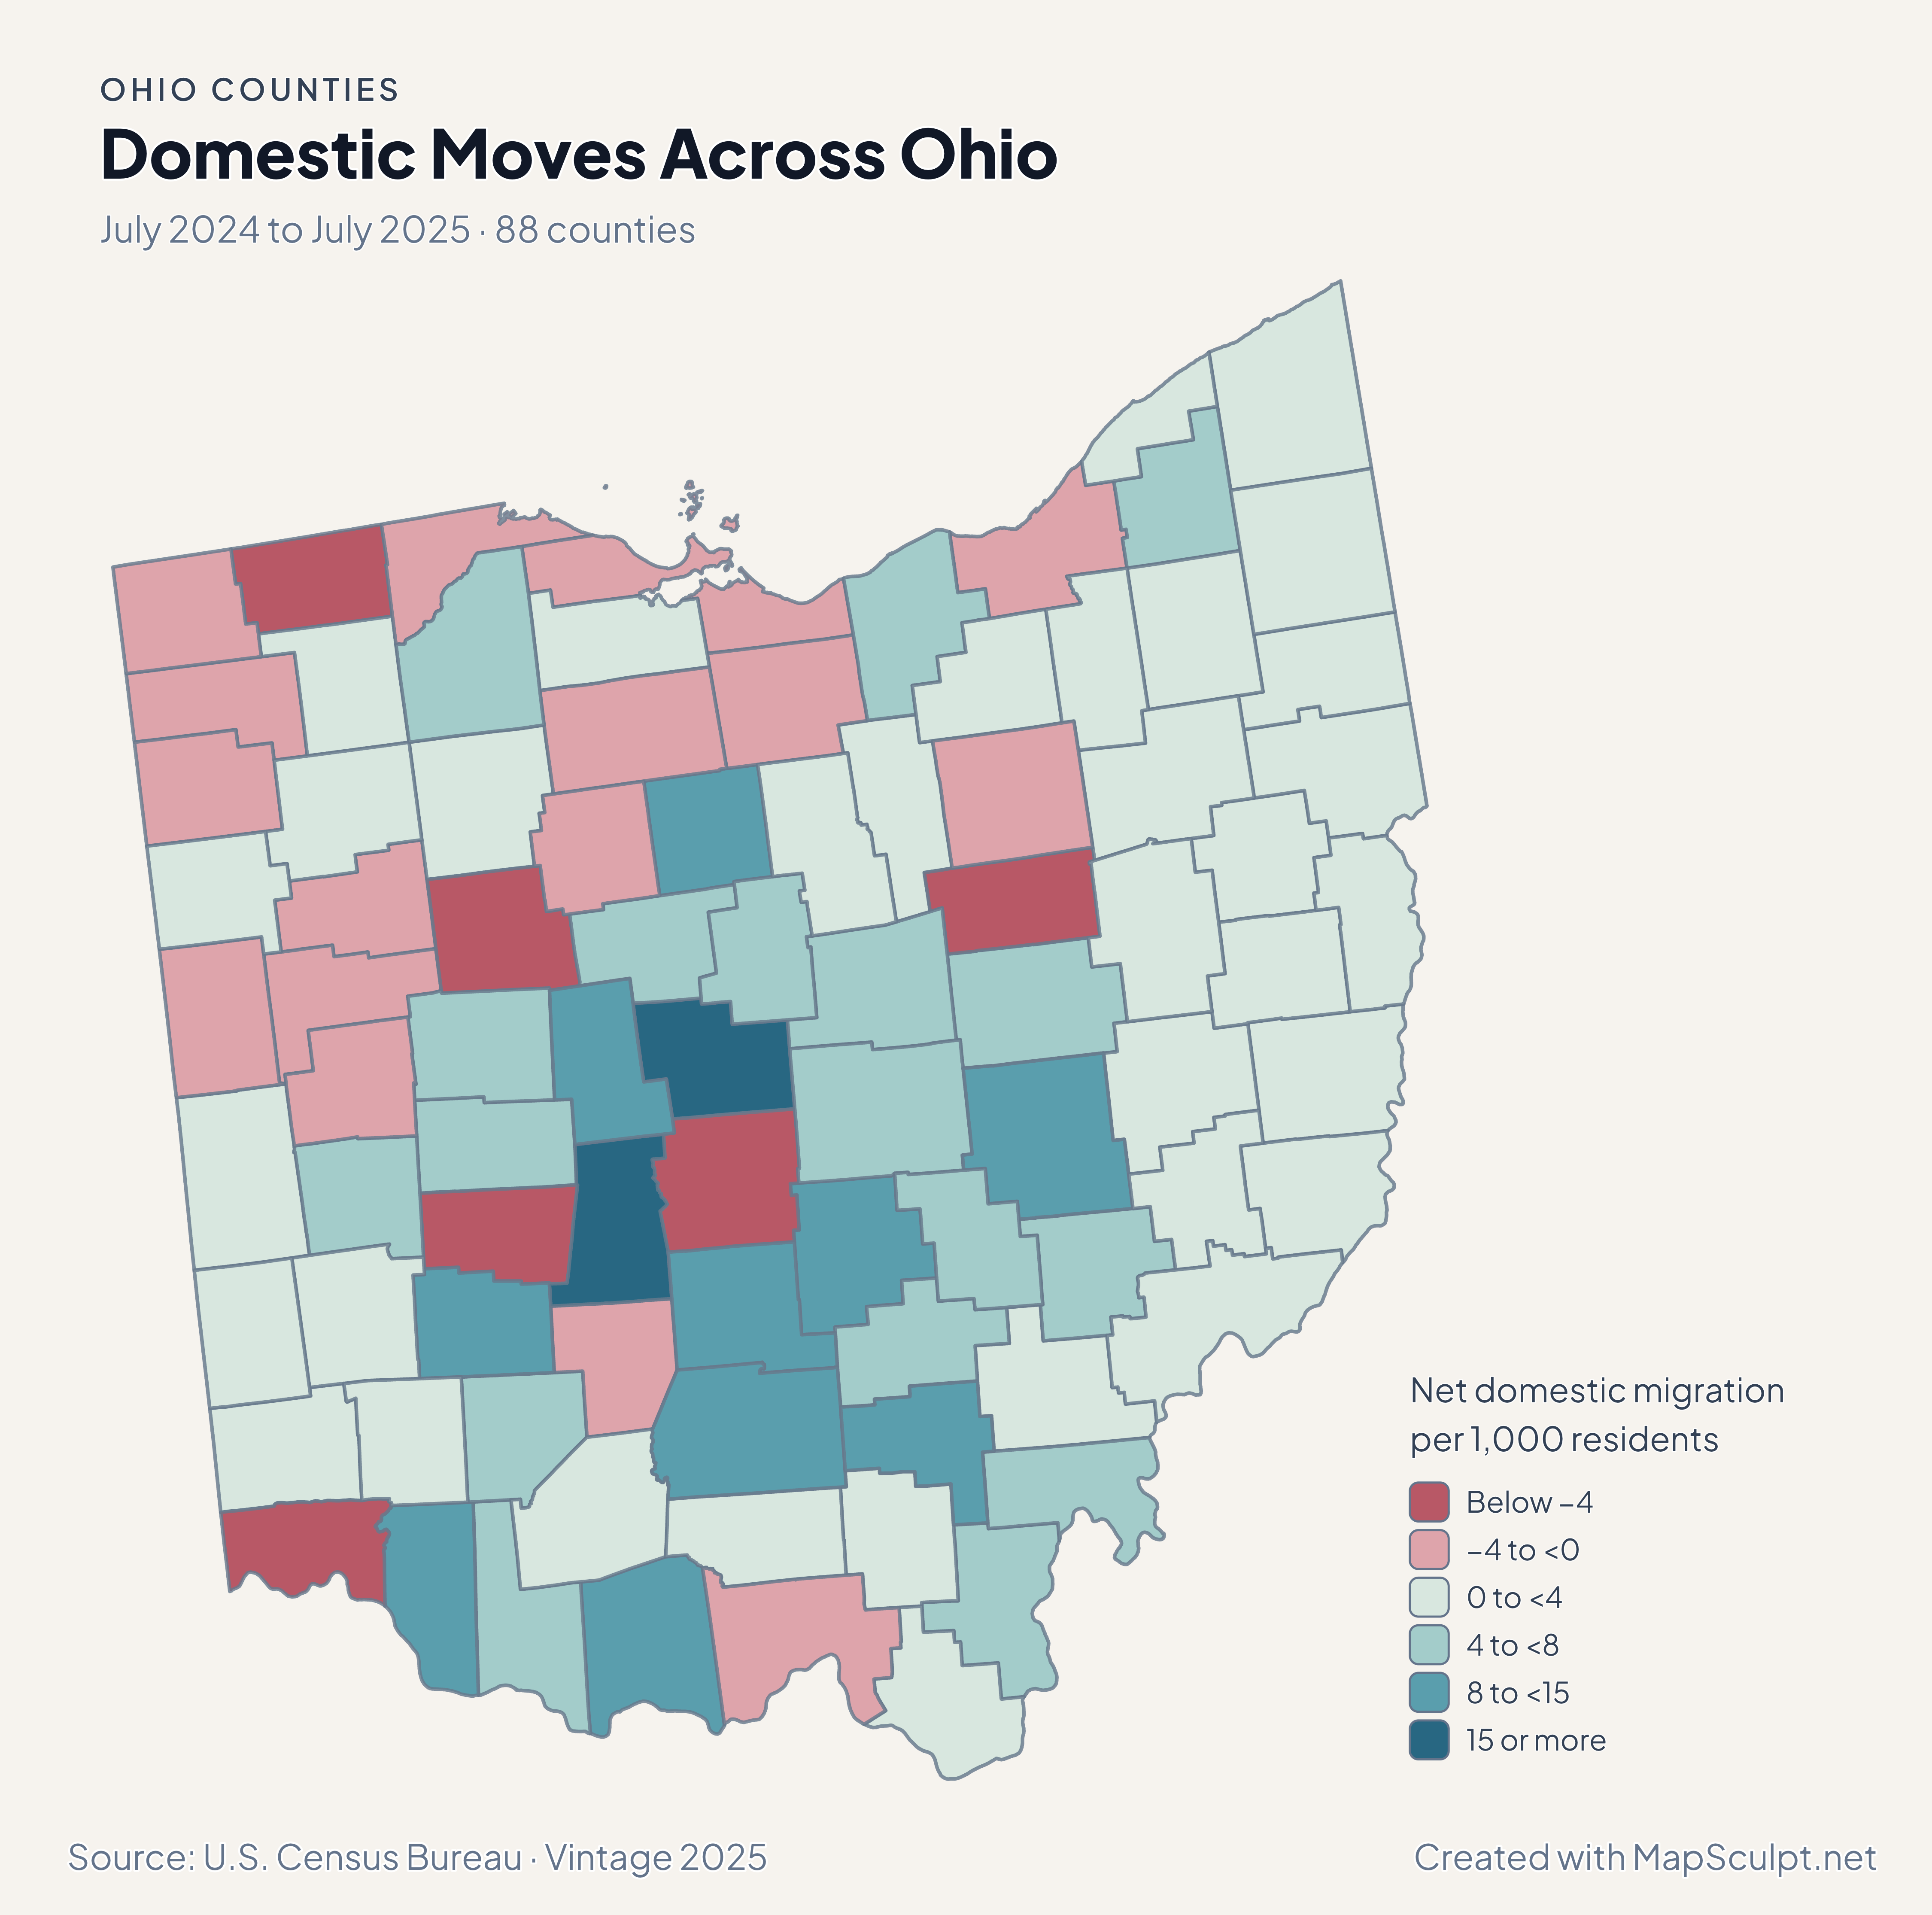
Madison, Delaware and Union each grew more than 2%. Franklin grew 0.66% while its net domestic migration rate was −5.30 per 1,000. Compare the two maps to distinguish all sources of population change from domestic moves alone. See the Census estimates ↗

MAKE IT YOURS

From county data to a finished map.

  1. Open the Ohio editor

    Start with the 88 official county features.

  2. Match county GEOIDs

    Use a dedicated five-digit county column, such as 39049 for Franklin County.

  3. Build a readable legend

    Choose class breaks that fit your measure and write the period and units beside the map.

  4. Export the finished map

    Check the full composition, then download a high-resolution PNG with your title and source.

TRY CSV IMPORT

Practice with six Ohio counties.

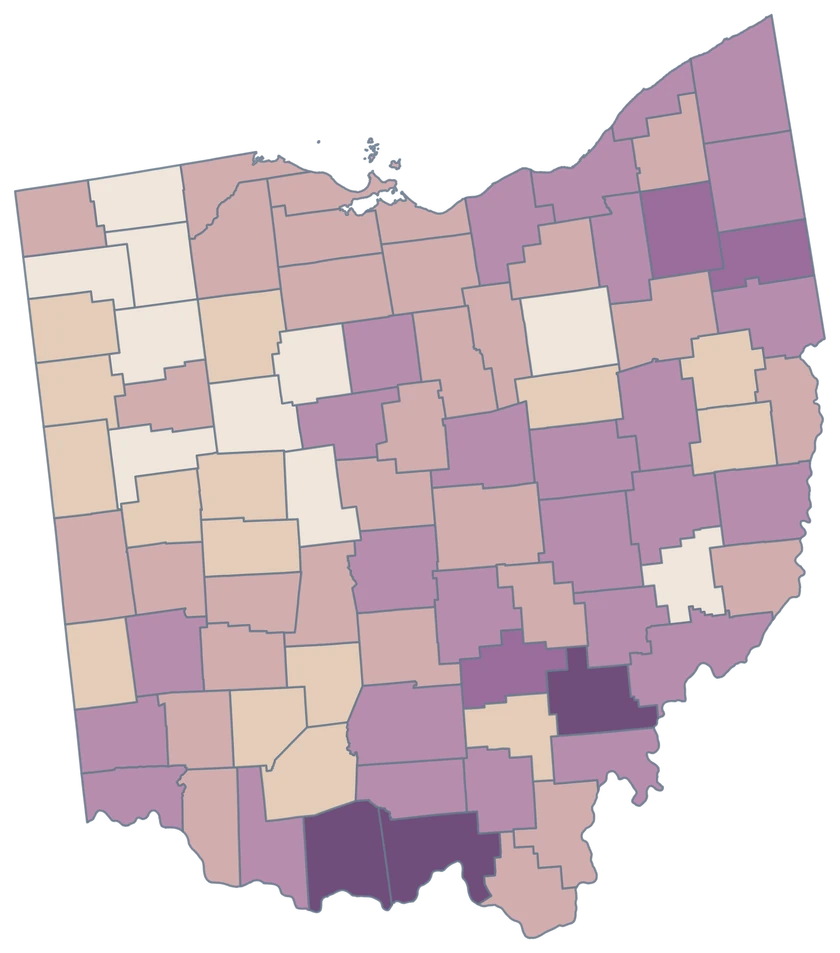
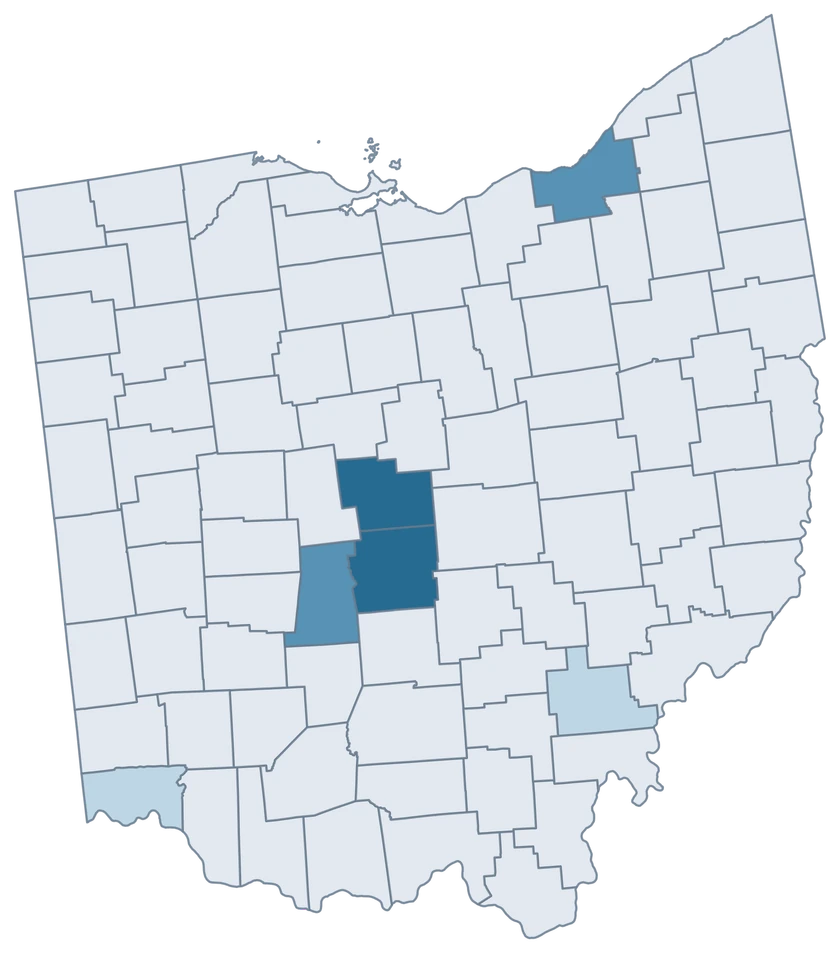
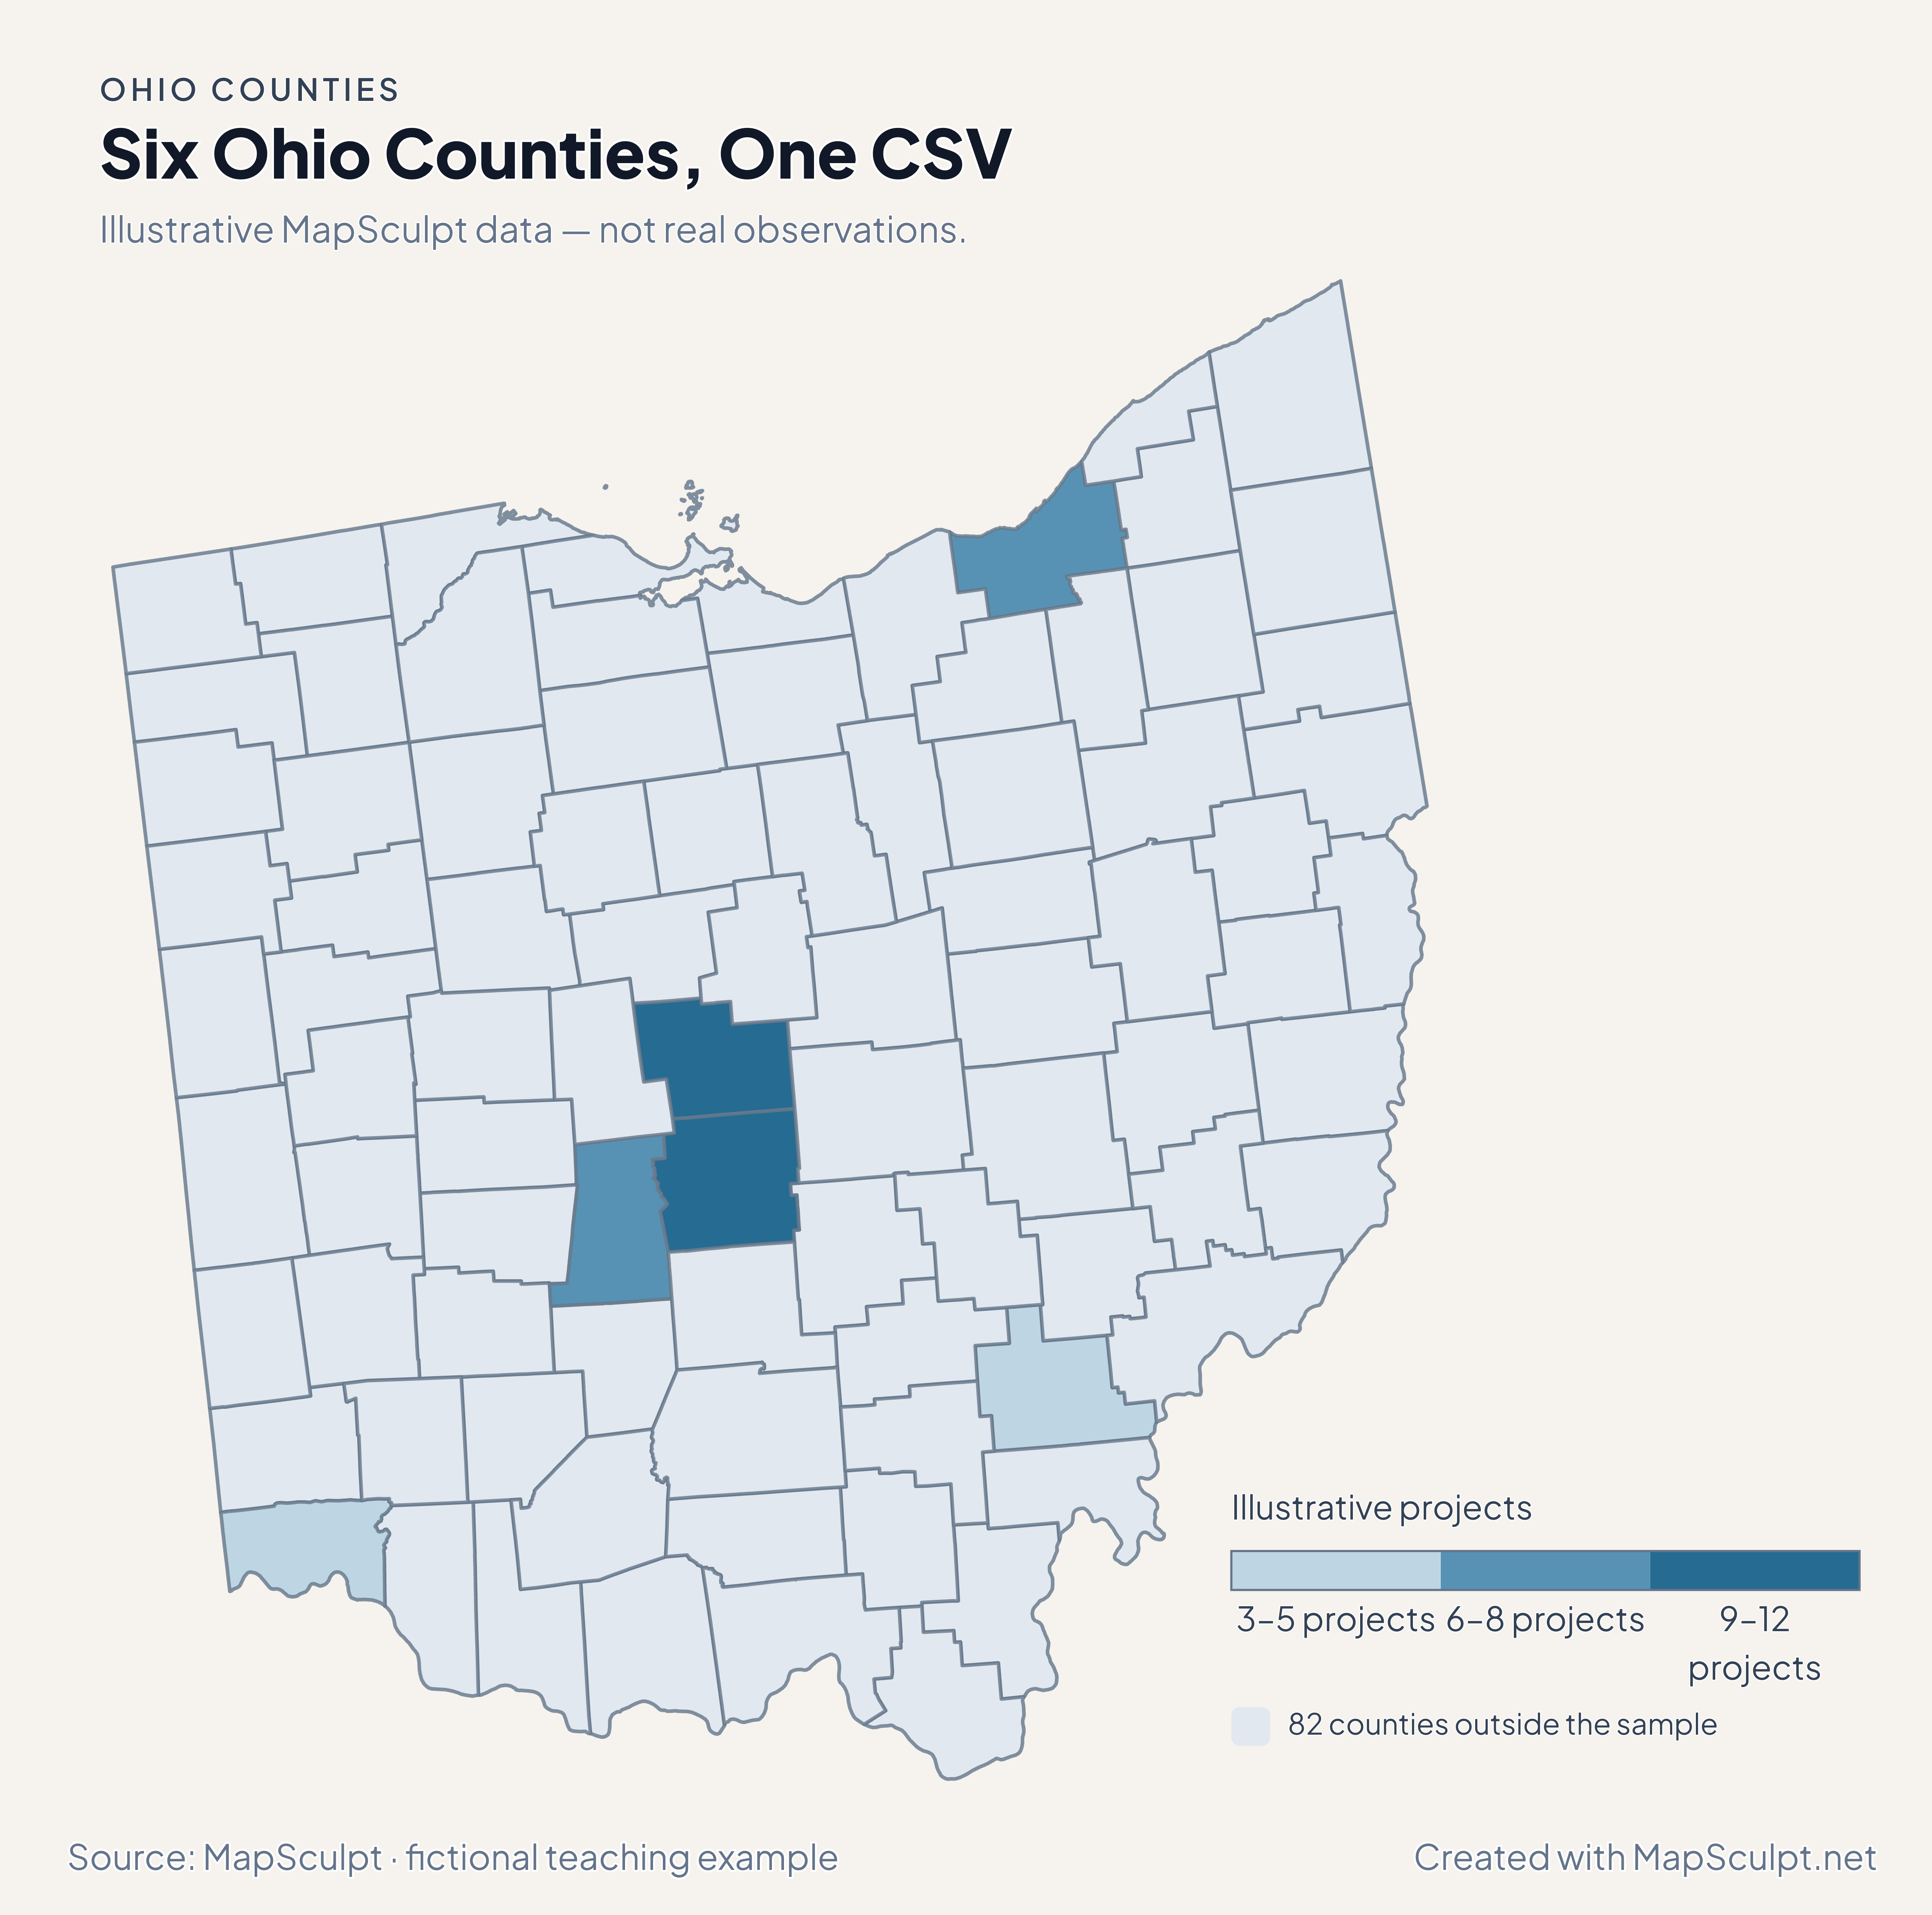
Import the fictional project counts, choose IllustrativeProjects and set numeric boundaries of 3, 6, 9 and 12. The 82 counties outside the sample share a neutral fill.

Illustrative MapSculpt data — not real observations.
CountyGEOIDProjects
Franklin County3904912
Delaware County390419
Cuyahoga County390358
Hamilton County390615
Madison County390976
Athens County390093

Keep GEOIDs as text. In this sample Franklin County is 39049 and Athens County is 39009. Use the directory when preparing a larger county join.

Download illustrative CSV ↓

Six Ohio Counties, One CSV

Illustrative MapSculpt data — not real observations.

Illustrative Ohio map highlighting six sampled counties, with the remaining 82 counties in a neutral shade.

Illustrative projects

  • 3–5 projects
  • 6–8 projects
  • 9–12 projects
  • 82 counties outside the sample
Download complete PNG

CSV → Match 6 counties → Style → Export PNG Create an Ohio map

COUNTY REFERENCE

Find all 88 Ohio county GEOIDs.

Official county names and five-digit Census GEOIDs. Search by name or code.

  1. Adams CountyGEOID 39001
  2. Allen CountyGEOID 39003
  3. Ashland CountyGEOID 39005
  4. Ashtabula CountyGEOID 39007
  5. Athens CountyGEOID 39009
  6. Auglaize CountyGEOID 39011
  7. Belmont CountyGEOID 39013
  8. Brown CountyGEOID 39015
  9. Butler CountyGEOID 39017
  10. Carroll CountyGEOID 39019
  11. Champaign CountyGEOID 39021
  12. Clark CountyGEOID 39023
  13. Clermont CountyGEOID 39025
  14. Clinton CountyGEOID 39027
  15. Columbiana CountyGEOID 39029
  16. Coshocton CountyGEOID 39031
  17. Crawford CountyGEOID 39033
  18. Cuyahoga CountyGEOID 39035
  19. Darke CountyGEOID 39037
  20. Defiance CountyGEOID 39039
  21. Delaware CountyGEOID 39041
  22. Erie CountyGEOID 39043
  23. Fairfield CountyGEOID 39045
  24. Fayette CountyGEOID 39047
  25. Franklin CountyGEOID 39049
  26. Fulton CountyGEOID 39051
  27. Gallia CountyGEOID 39053
  28. Geauga CountyGEOID 39055
  29. Greene CountyGEOID 39057
  30. Guernsey CountyGEOID 39059
  31. Hamilton CountyGEOID 39061
  32. Hancock CountyGEOID 39063
  33. Hardin CountyGEOID 39065
  34. Harrison CountyGEOID 39067
  35. Henry CountyGEOID 39069
  36. Highland CountyGEOID 39071
  37. Hocking CountyGEOID 39073
  38. Holmes CountyGEOID 39075
  39. Huron CountyGEOID 39077
  40. Jackson CountyGEOID 39079
  41. Jefferson CountyGEOID 39081
  42. Knox CountyGEOID 39083
  43. Lake CountyGEOID 39085
  44. Lawrence CountyGEOID 39087
  45. Licking CountyGEOID 39089
  46. Logan CountyGEOID 39091
  47. Lorain CountyGEOID 39093
  48. Lucas CountyGEOID 39095
  49. Madison CountyGEOID 39097
  50. Mahoning CountyGEOID 39099
  51. Marion CountyGEOID 39101
  52. Medina CountyGEOID 39103
  53. Meigs CountyGEOID 39105
  54. Mercer CountyGEOID 39107
  55. Miami CountyGEOID 39109
  56. Monroe CountyGEOID 39111
  57. Montgomery CountyGEOID 39113
  58. Morgan CountyGEOID 39115
  59. Morrow CountyGEOID 39117
  60. Muskingum CountyGEOID 39119
  61. Noble CountyGEOID 39121
  62. Ottawa CountyGEOID 39123
  63. Paulding CountyGEOID 39125
  64. Perry CountyGEOID 39127
  65. Pickaway CountyGEOID 39129
  66. Pike CountyGEOID 39131
  67. Portage CountyGEOID 39133
  68. Preble CountyGEOID 39135
  69. Putnam CountyGEOID 39137
  70. Richland CountyGEOID 39139
  71. Ross CountyGEOID 39141
  72. Sandusky CountyGEOID 39143
  73. Scioto CountyGEOID 39145
  74. Seneca CountyGEOID 39147
  75. Shelby CountyGEOID 39149
  76. Stark CountyGEOID 39151
  77. Summit CountyGEOID 39153
  78. Trumbull CountyGEOID 39155
  79. Tuscarawas CountyGEOID 39157
  80. Union CountyGEOID 39159
  81. Van Wert CountyGEOID 39161
  82. Vinton CountyGEOID 39163
  83. Warren CountyGEOID 39165
  84. Washington CountyGEOID 39167
  85. Wayne CountyGEOID 39169
  86. Williams CountyGEOID 39171
  87. Wood CountyGEOID 39173
  88. Wyandot CountyGEOID 39175

U.S. Census Bureau · 2025 Cartographic Boundary Files

COMMON QUESTIONS

Ohio county map questions.

Can I compare Franklin and Delaware separately?

Yes. Franklin is 39049 and Delaware is 39041. Their separate features let you test how a central Ohio pattern looks at county scale.

Does the Lake Erie outline include islands?

The map shows the islands retained by the existing 2025 Census cartographic boundaries. Where a county has multiple pieces, those pieces share one county identifier.

Which county GEOID should I use for Cleveland area data?

Use 39035 when the observation covers Cuyahoga County. City of Cleveland data requires checking its coverage before joining it to a county feature.

Why do the growth and domestic migration maps differ near Columbus?

The population map includes total change, while domestic migration counts net moves within the United States. Franklin had positive total change and negative net domestic migration.

What does a darker income shade in Delaware mean?

It identifies the class of the county’s estimated median household income in 2024 dollars. It does not show individual salaries or the cost of living.

Can I show counties on both sides of the Ohio River?

Use the national county editor to combine Ohio with counties in Kentucky or West Virginia. State and county digits together identify the correct records.

YOUR NEXT MAP STARTS HERE

Map the Ohio comparison you want to make.

Compare central Ohio counties, highlight a river corridor or map all 88 counties with your own values.

Create an Ohio map