World
Global markets, international operations and worldwide comparisons.


MAPS FOR PRESENTATIONS
Create custom maps, highlight regions and visualise data. Export high-resolution PNGs for PowerPoint, Google Slides and Keynote.
Free online editor · No sign-up required
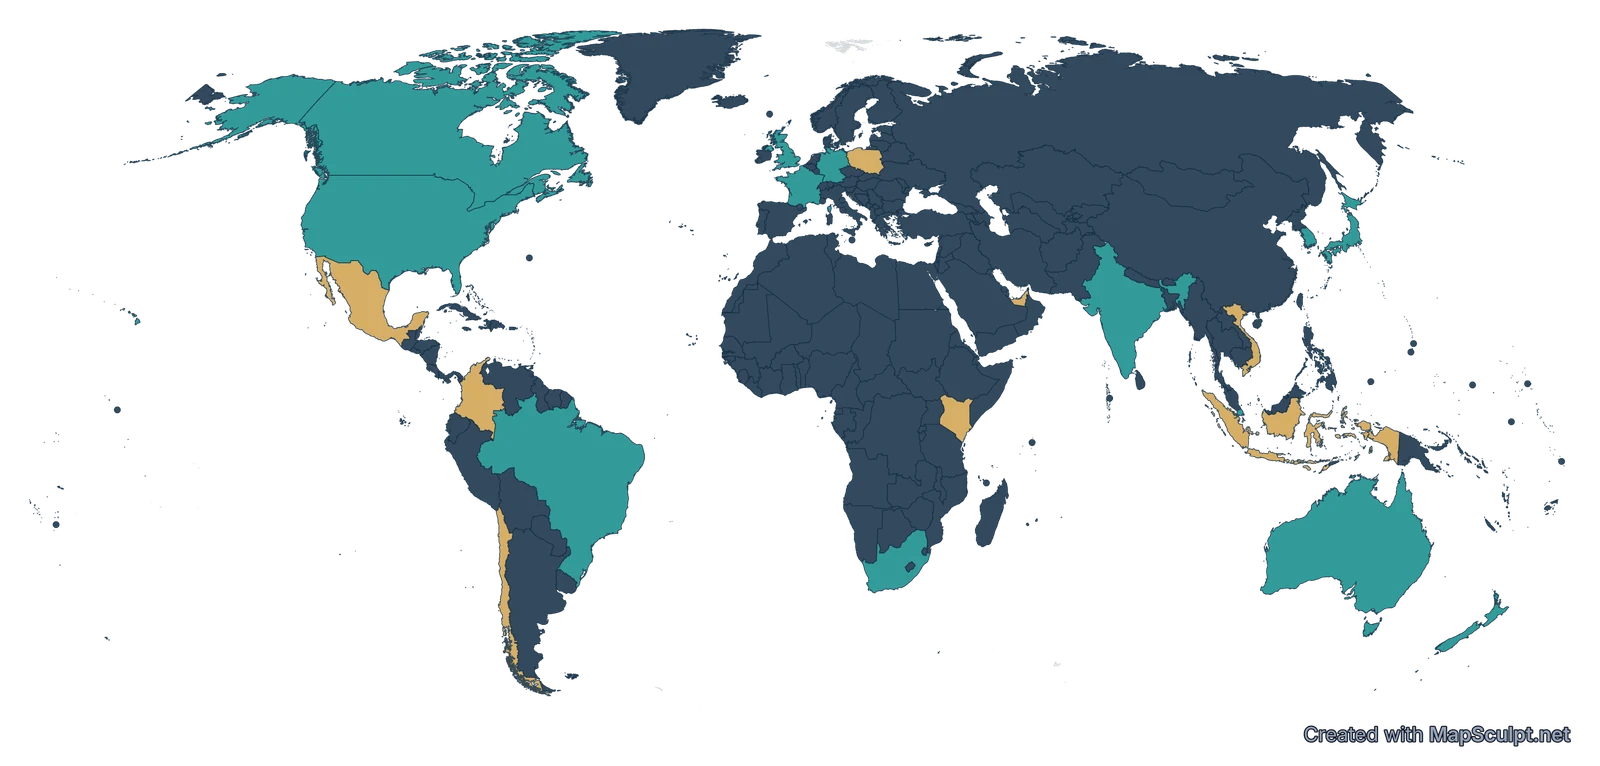
Established markets and expansion opportunities
01 / CHOOSE YOUR MAP
Choose a geography, then customise your map for your presentation.
02 / MADE WITH MAPSCULPT
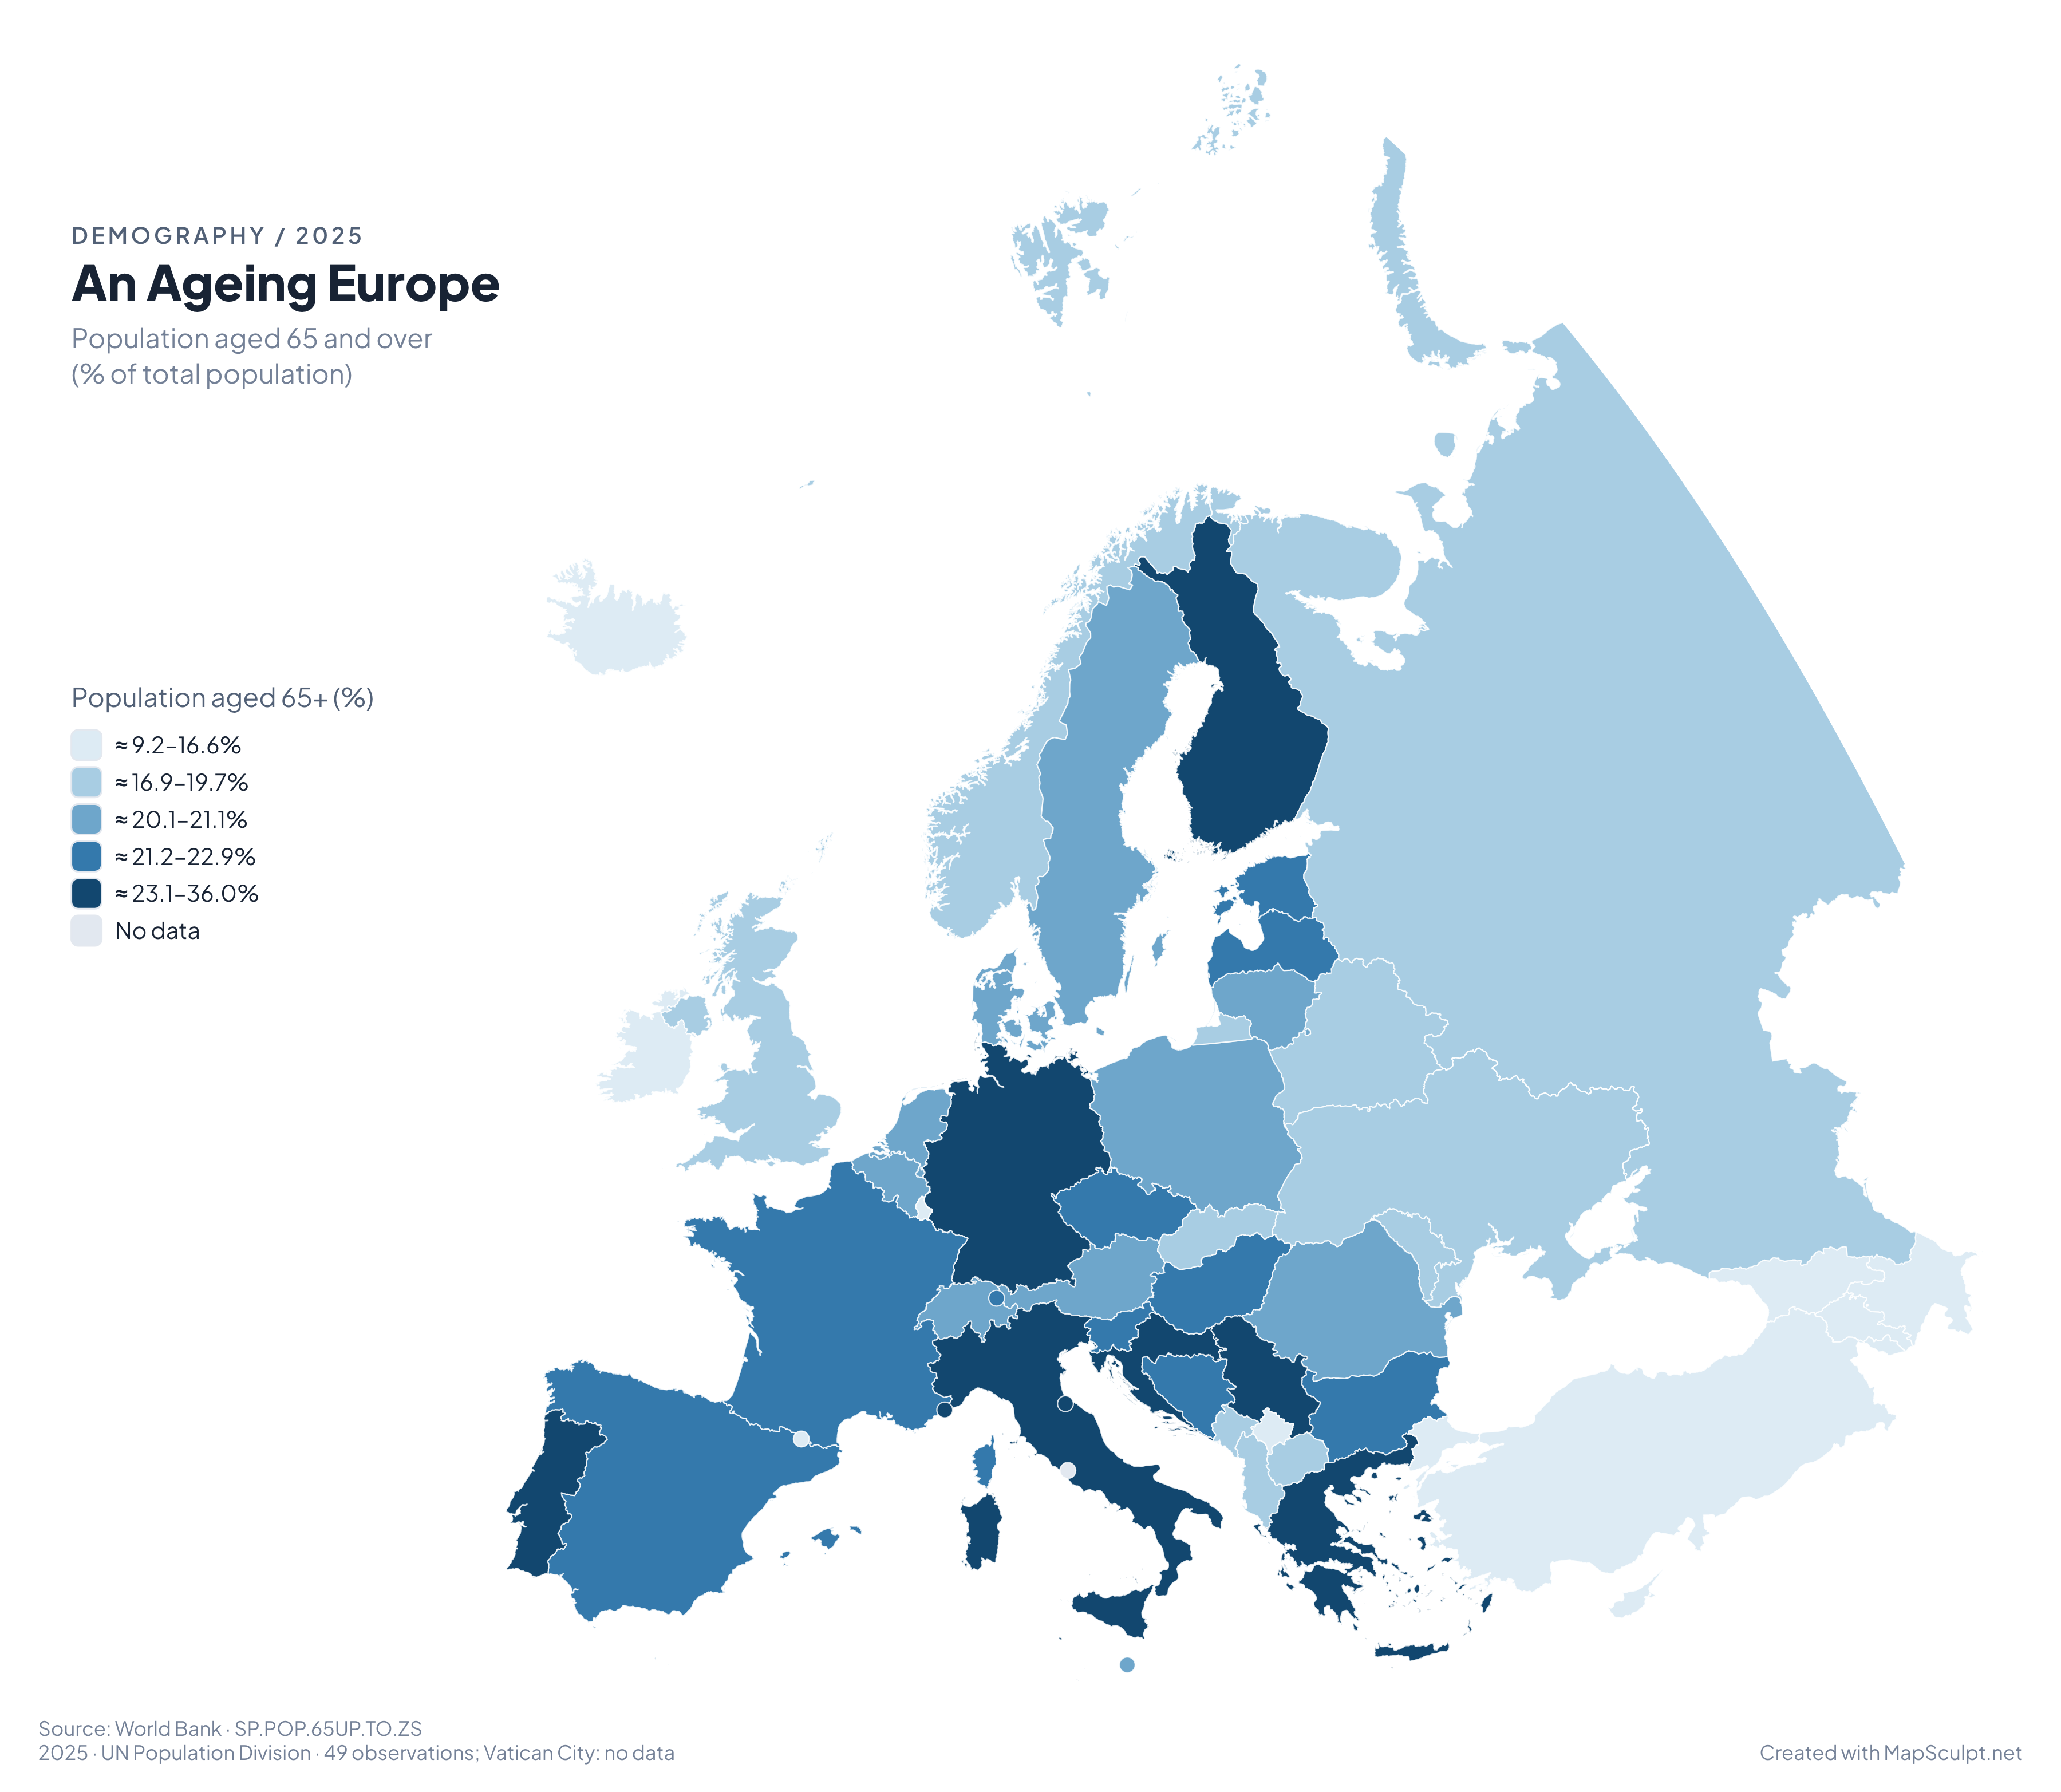
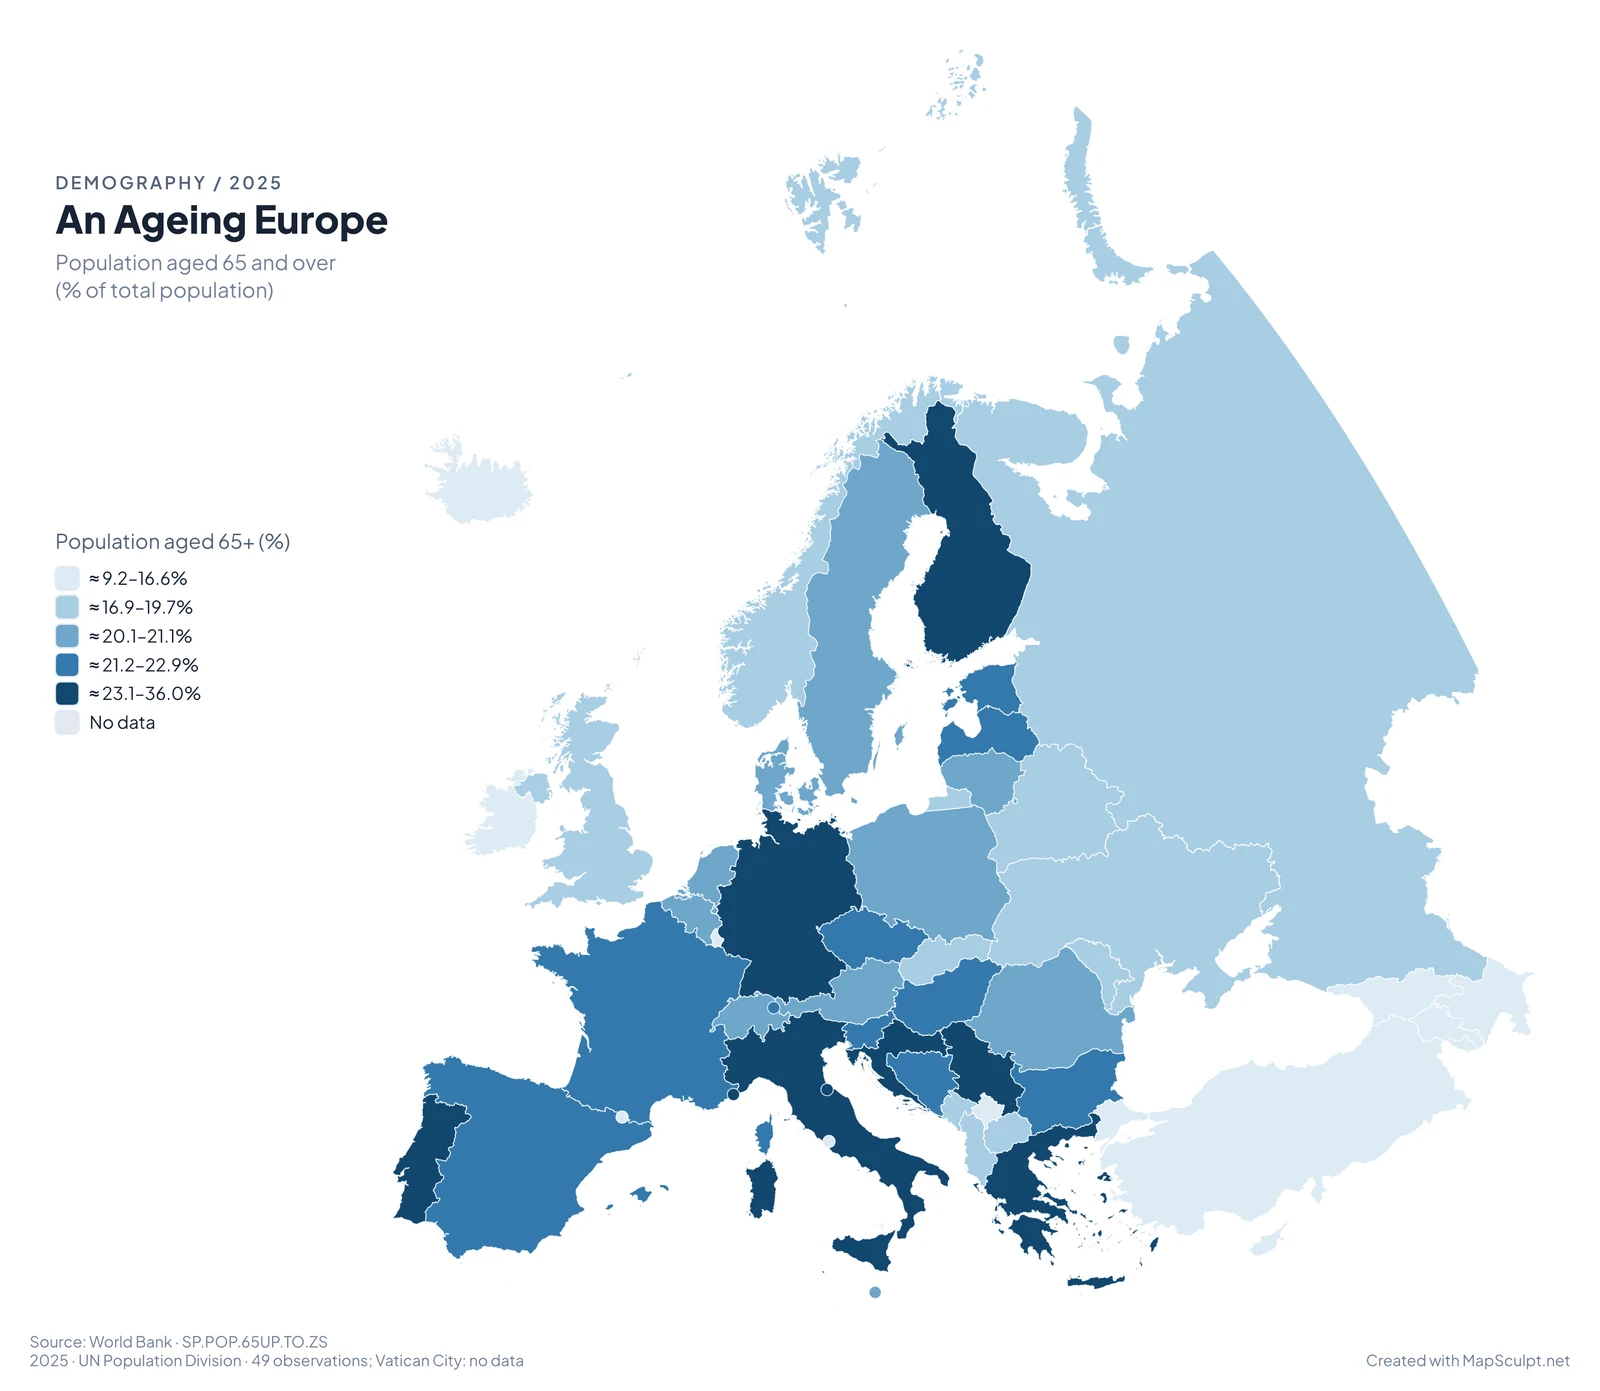
Import geographic data to visualise patterns across European countries. This example shows the share of the population aged 65 and over using 2025 World Bank estimates.
49 observations · Vatican City: No data.
Imported, matched and classified in MapSculpt.
Adjust colours, labels and source context in the editor.
TWO MORE WAYS TO PRESENT GEOGRAPHY
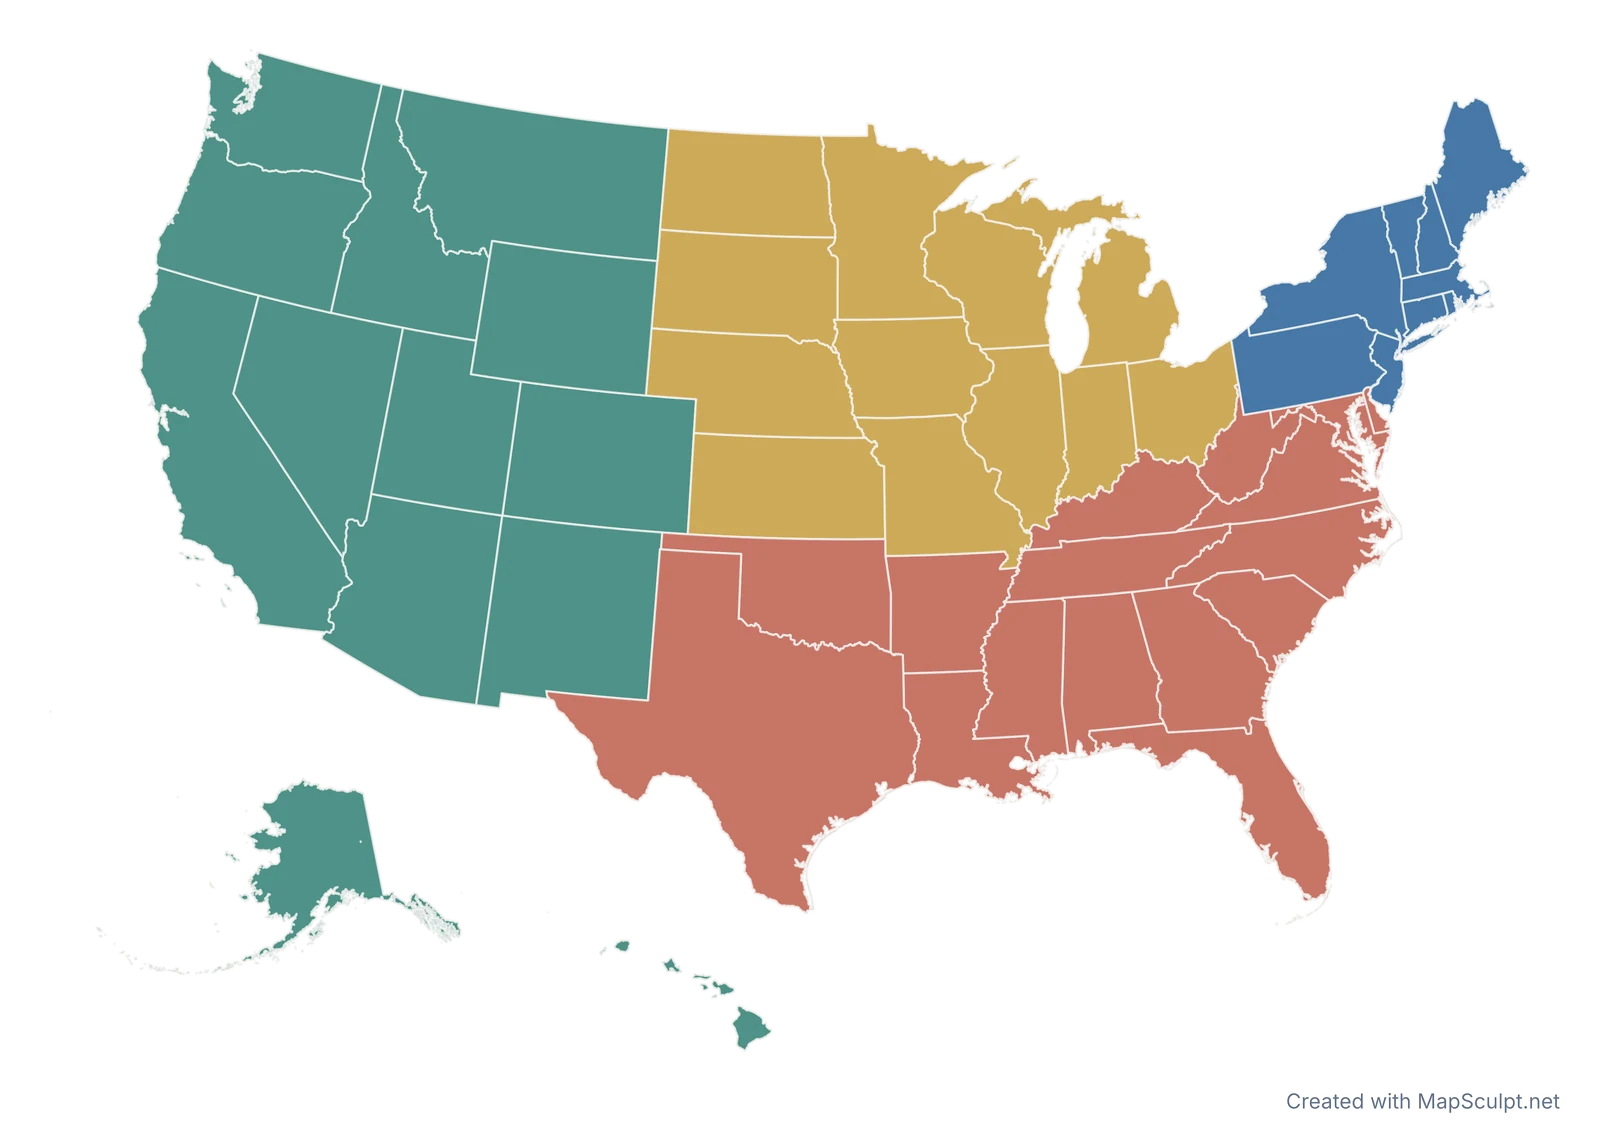
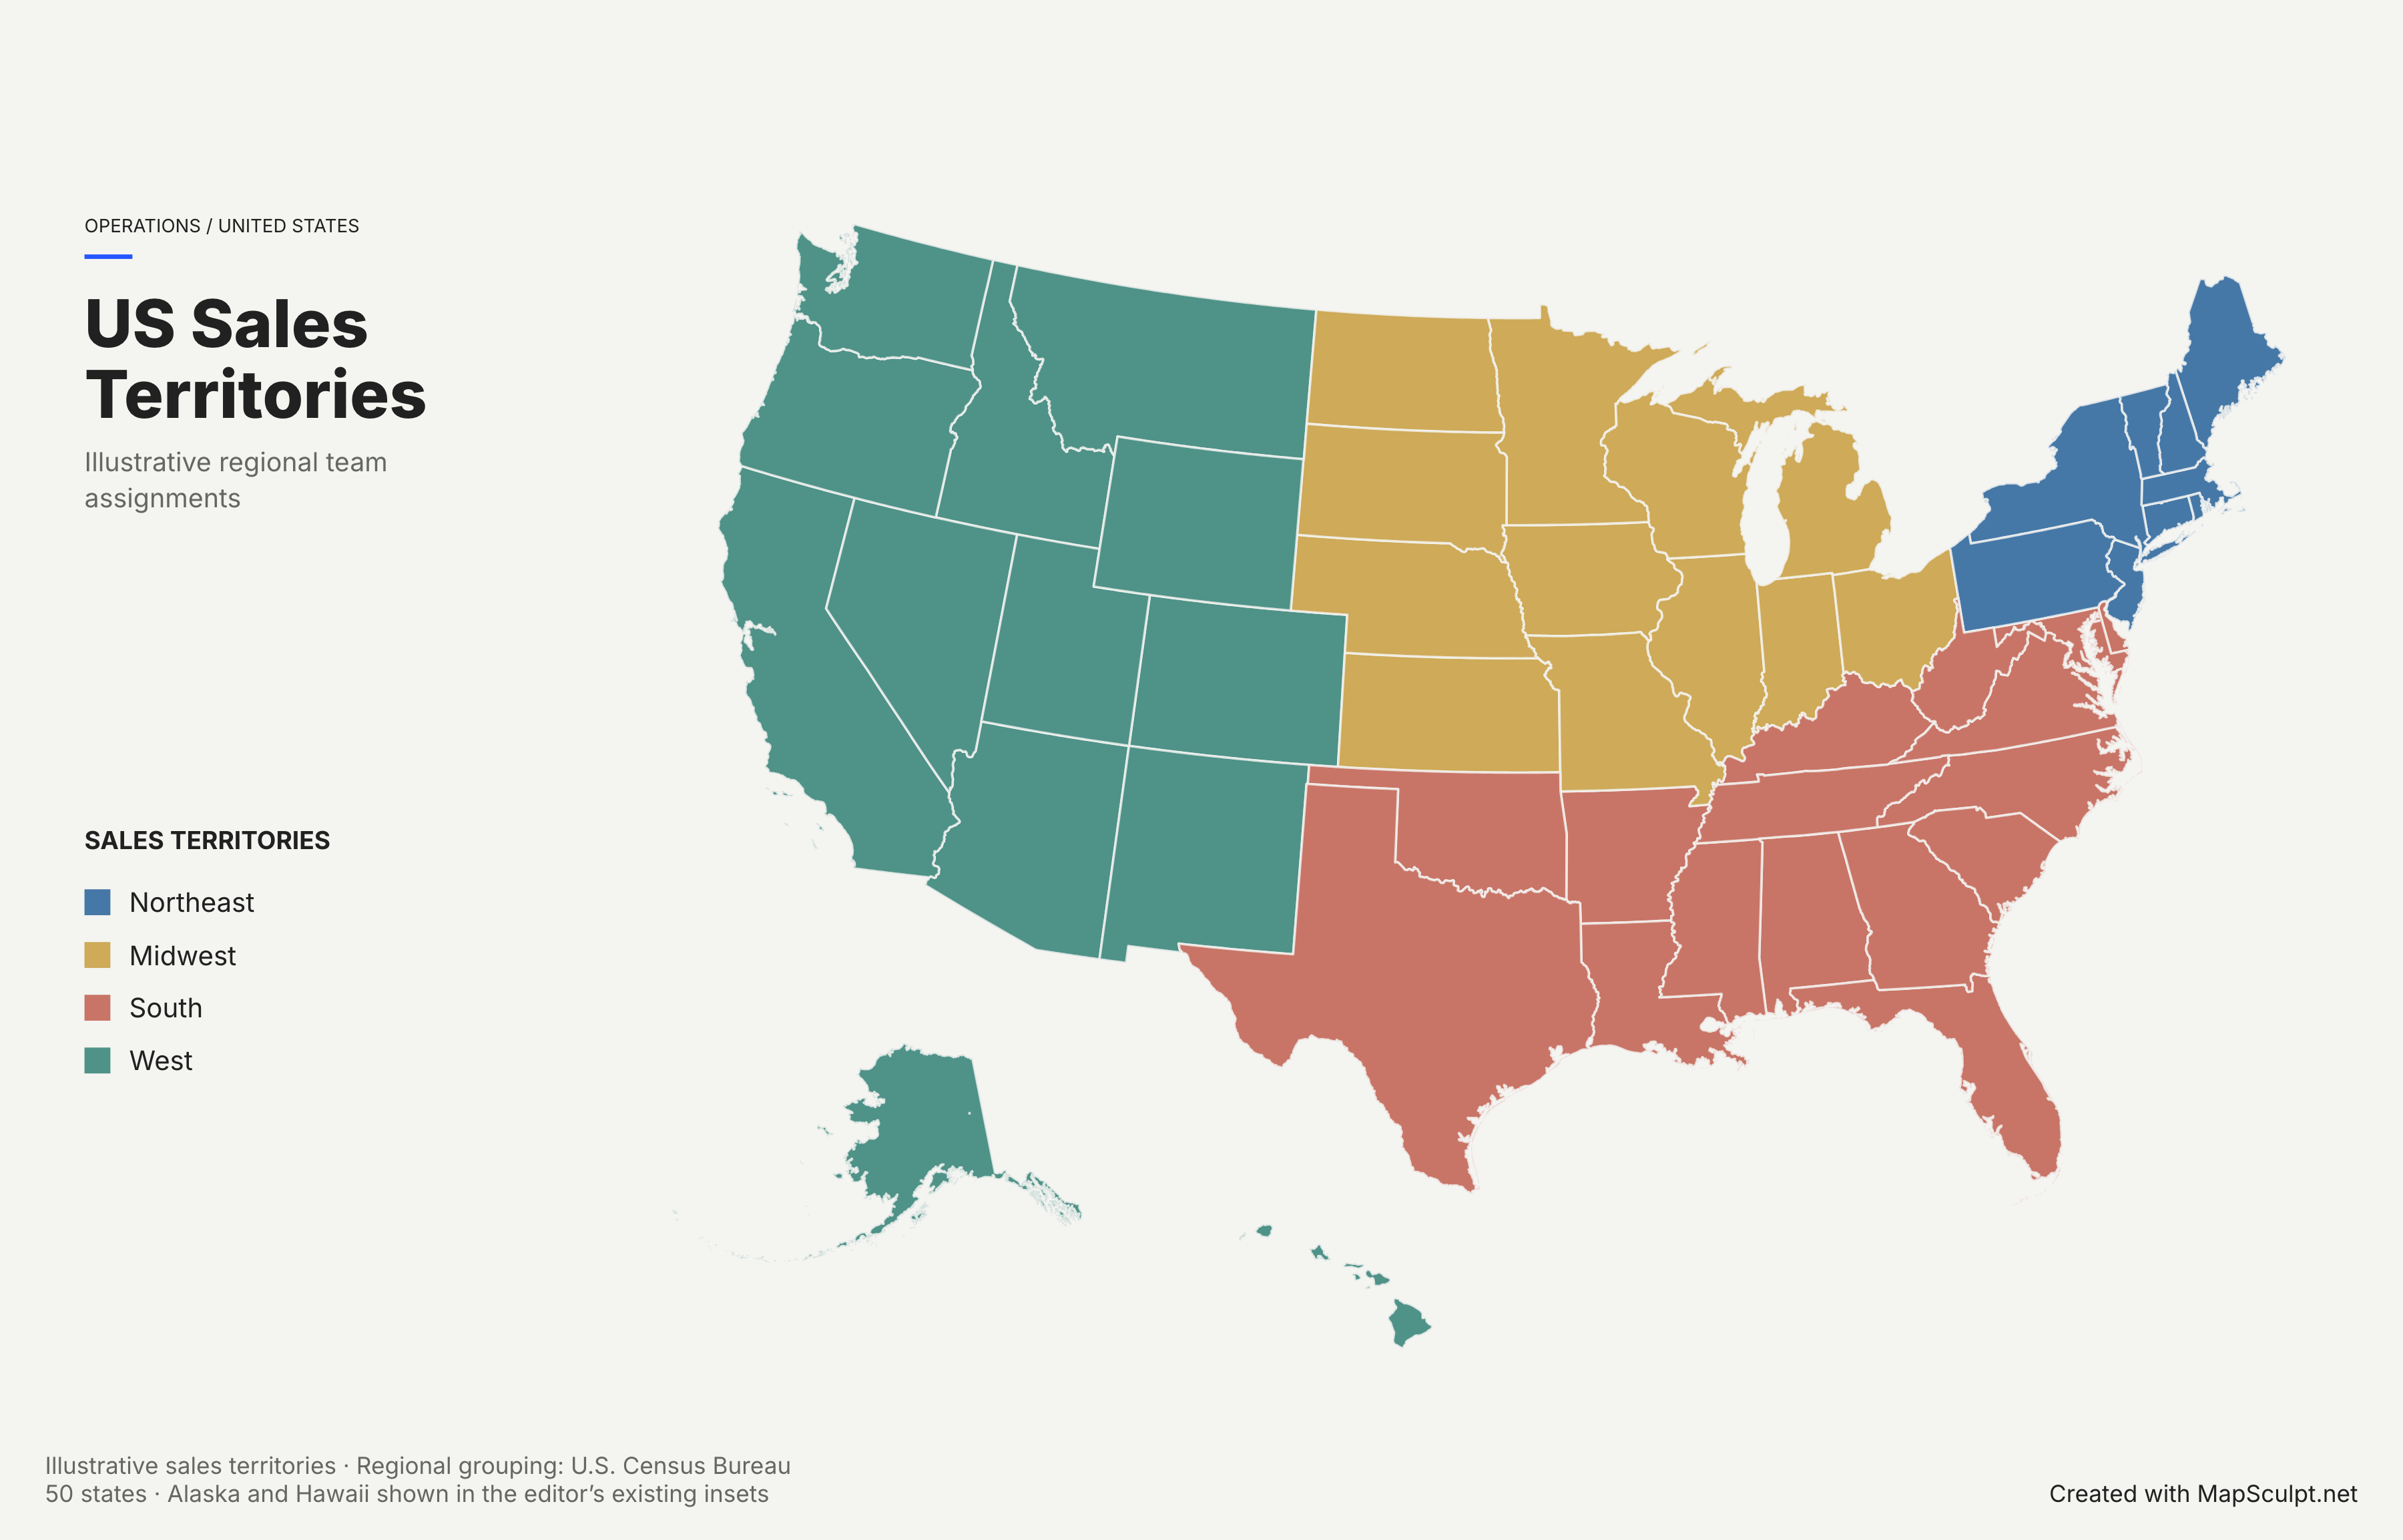
See how custom geographic categories can clarify operational responsibilities and regional sales coverage.
Illustrative territories · Based on US Census regions
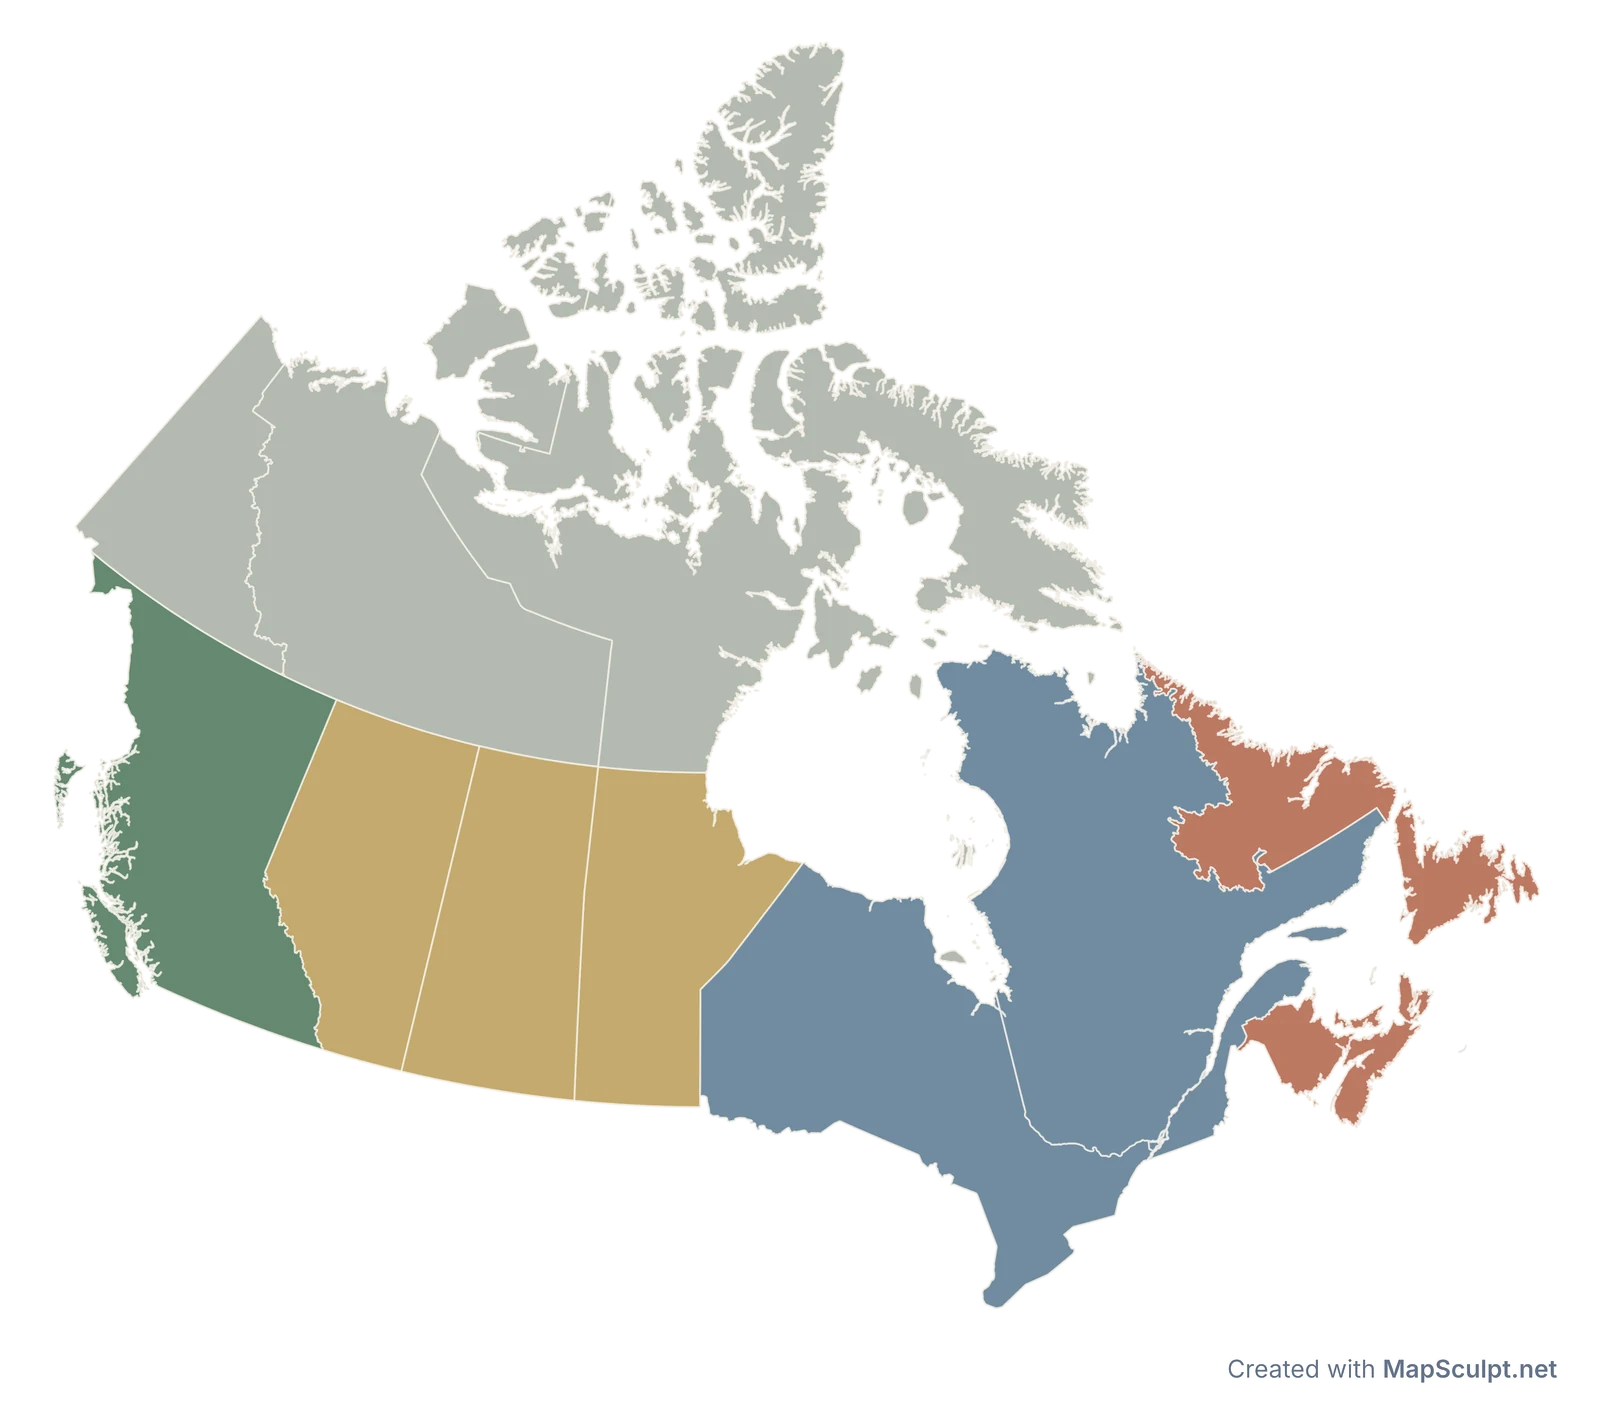
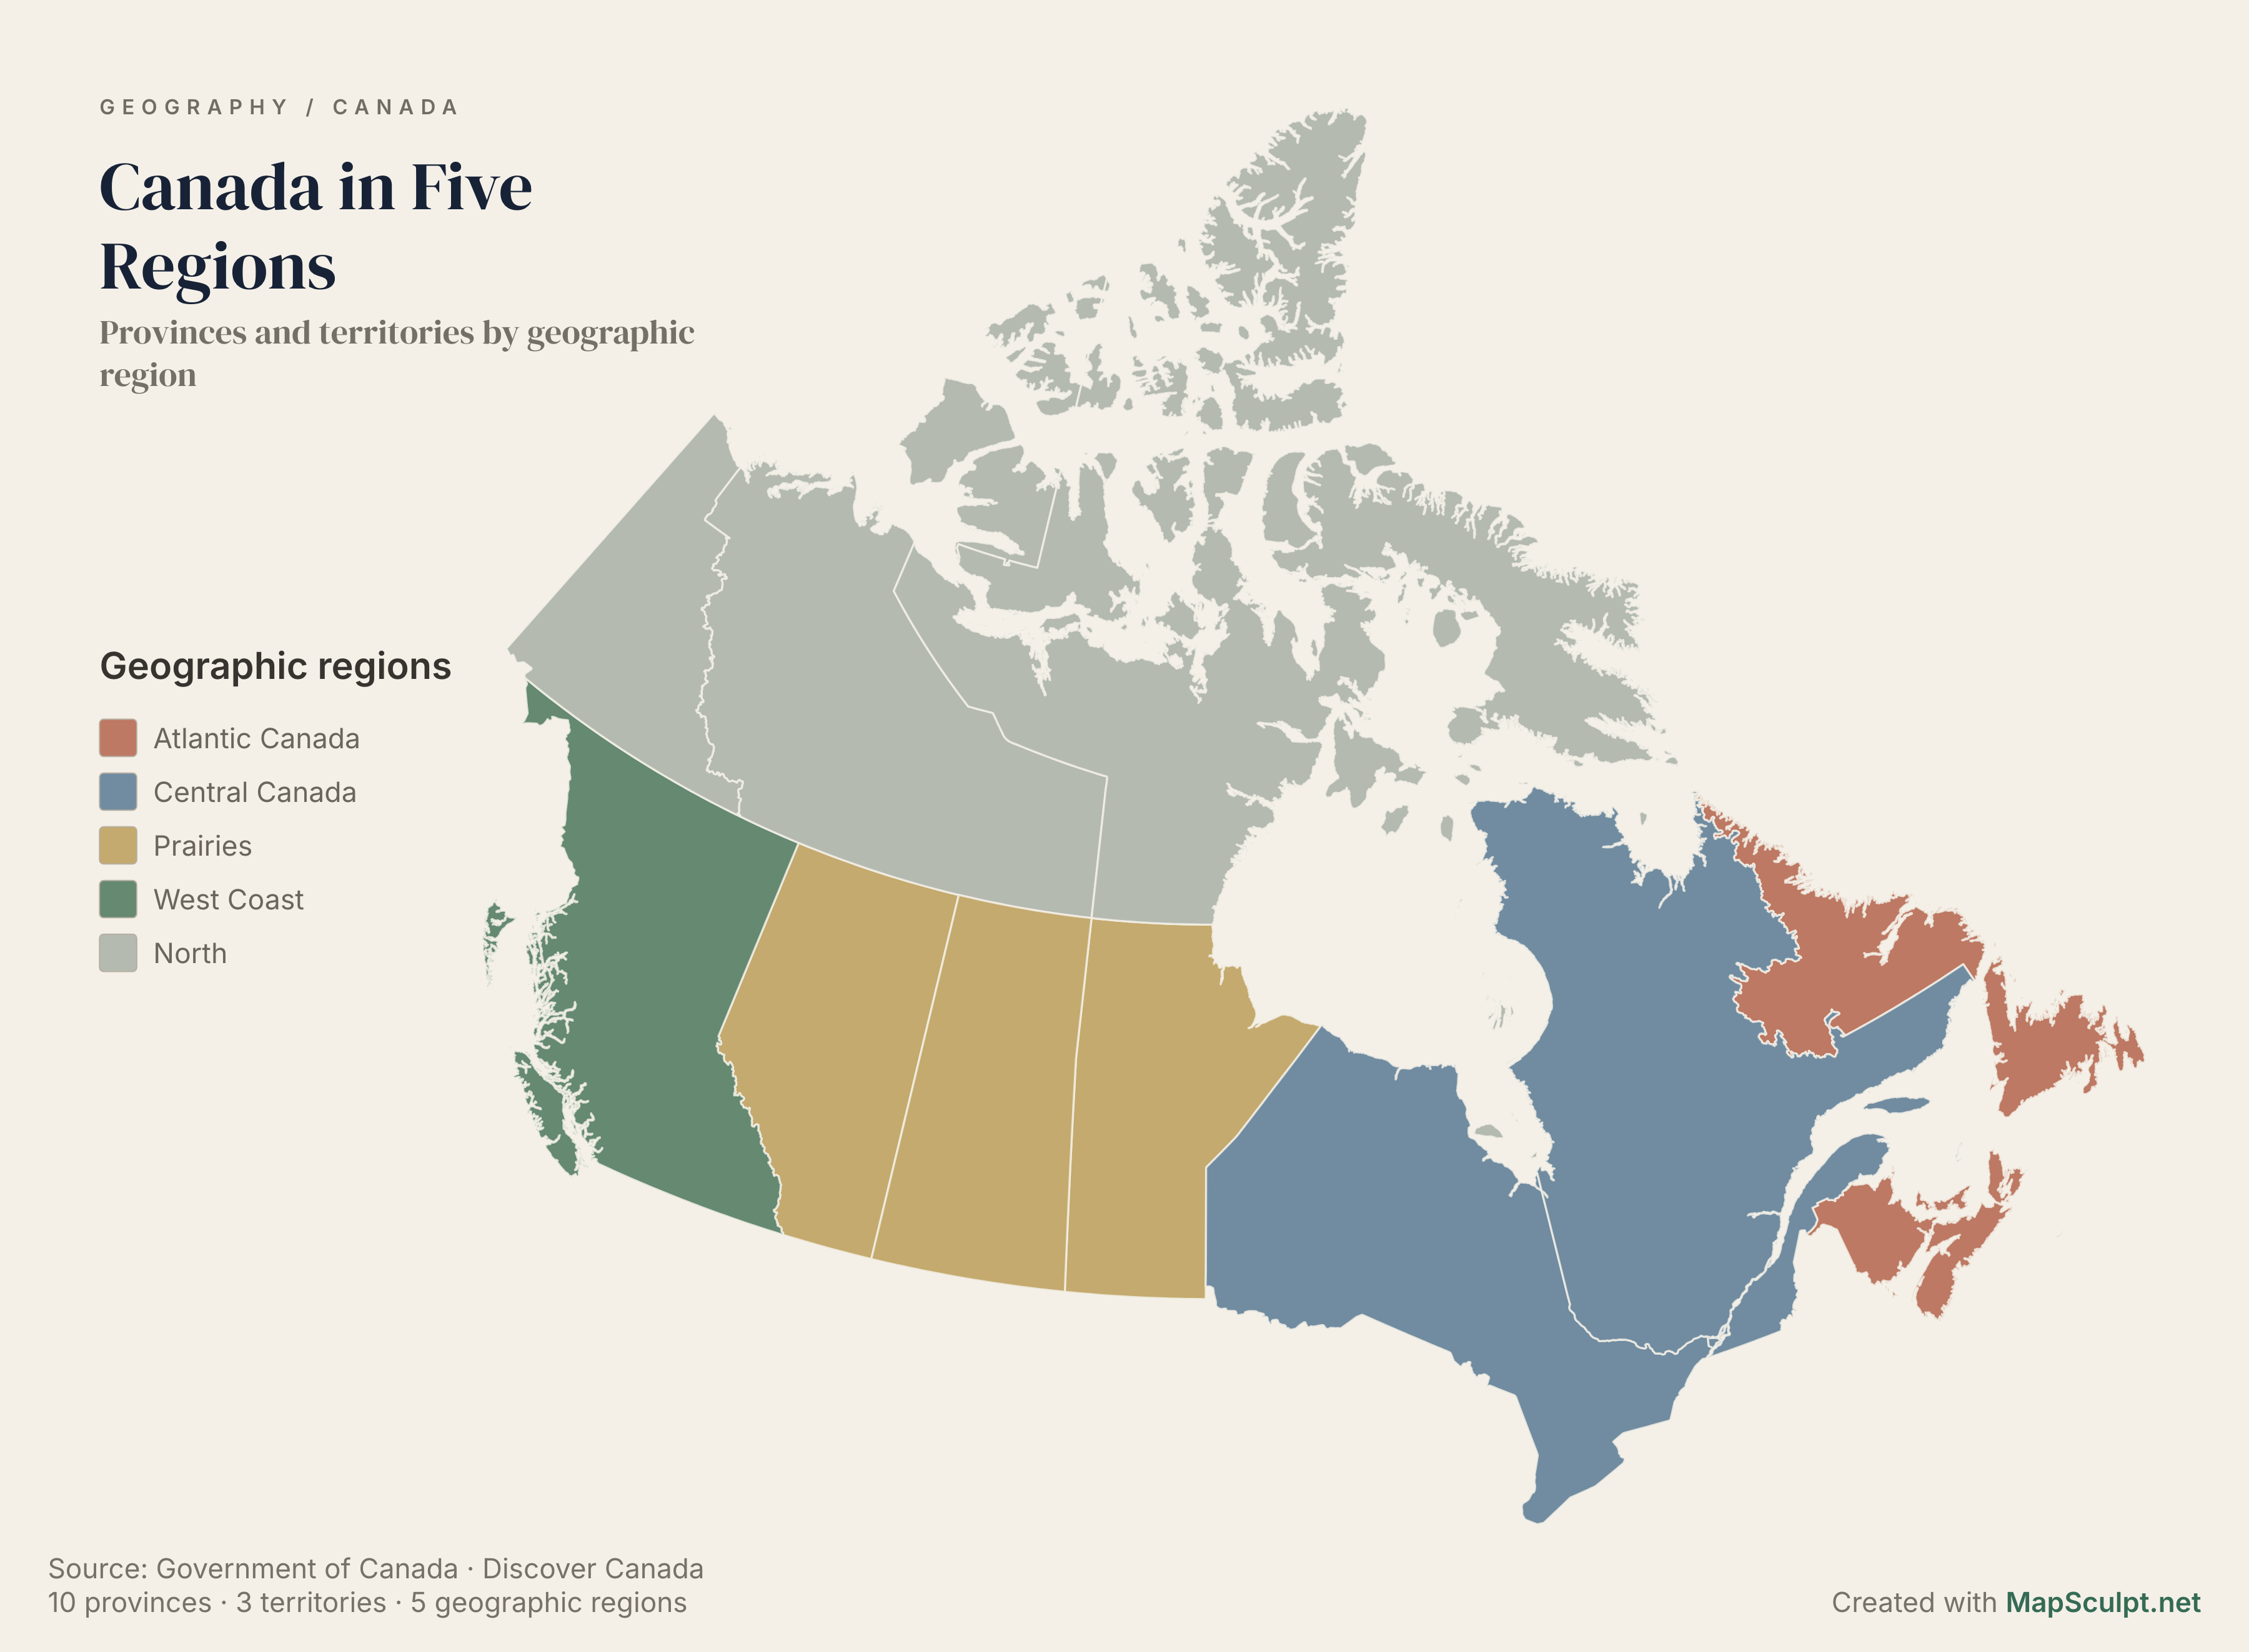
Organise provinces and territories into clear geographic regions for educational and professional presentations.
5 regions · All 13 provinces and territories
MAKE IT YOURS
Select a world, continent, country or regional map.
Highlight countries or regions, or import CSV data.
Use titles, legends and annotations.
Download a high-resolution PNG and place it in your slides.
03 / BUILT FOR YOUR SLIDES
Three simple ways to use your MapSculpt export in a presentation.
Give the geography centre stage. Best for overviews.
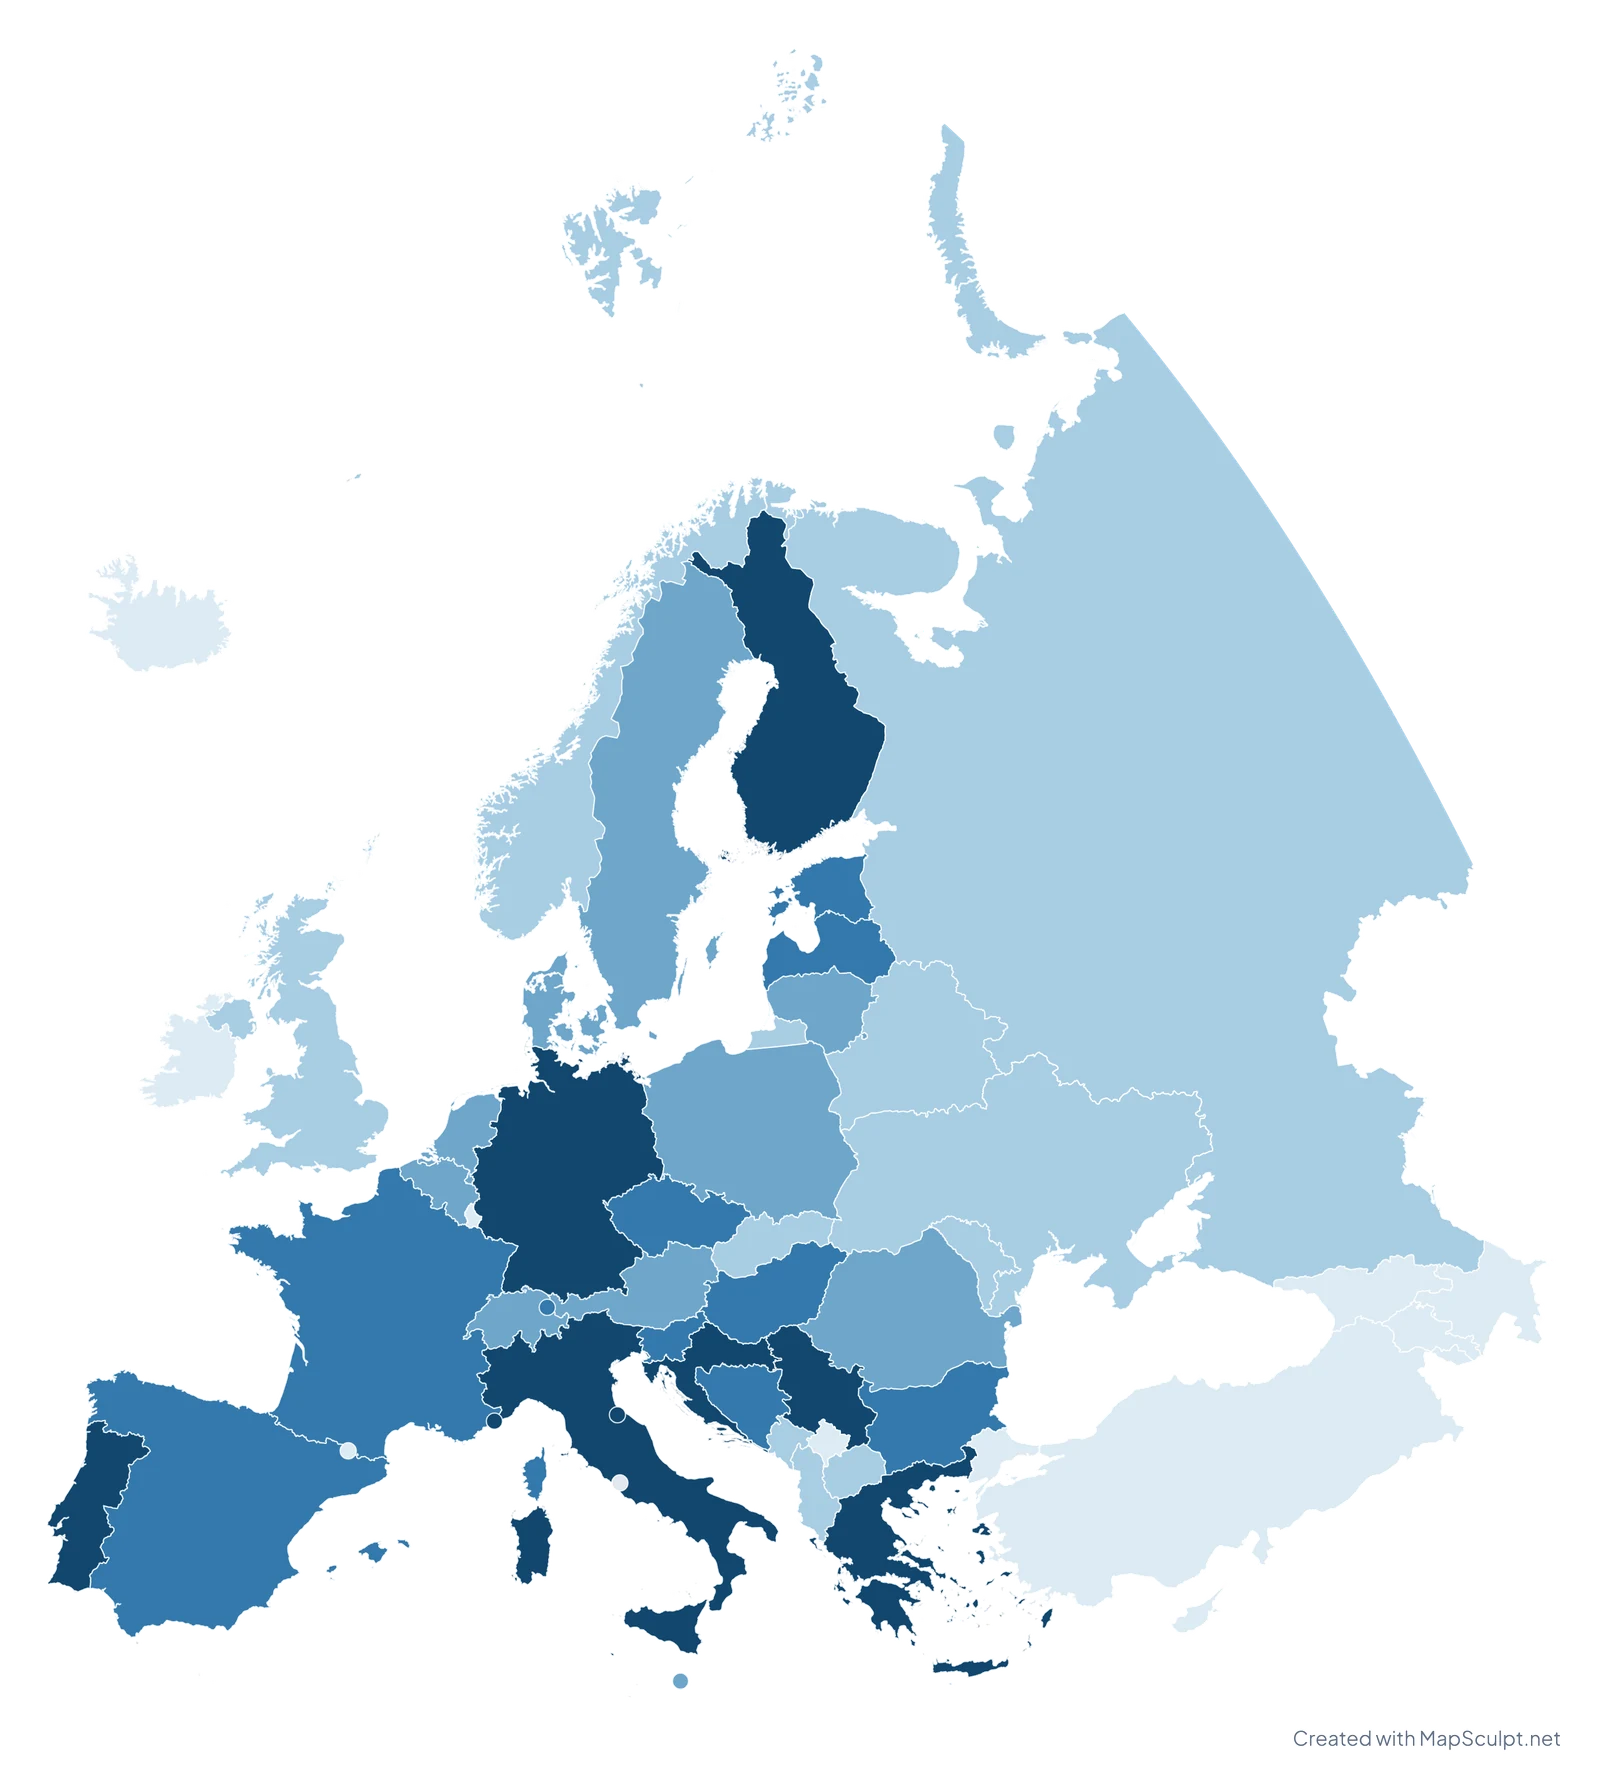
Population aged 65+ (%) · 2025
World Bank · 49 observations Vatican City: No data
Pair a map with the figures or insights that explain it.
REGIONAL RESEARCH / 01
Canada in Five RegionsGovernment of Canada Discover Canada
Place a transparent map on your presentation background.
Slide layouts are illustrations. PNG exports remain images, not editable PowerPoint shapes.
04 / PRESENT WITH CLARITY
Choose clear colour differences, readable labels and concise legends.
Add a meaningful title, measurement units and source attribution for data.
Use high-resolution PNGs; transparent backgrounds work with your own slides.
COMMON QUESTIONS
Choose a map, colour the regions you need, add a title and legend, then export a PNG and insert it in PowerPoint.
Yes. Download your map as a PNG, then use Insert → Image in Google Slides. You can also place the image in Keynote or other presentation software.
Yes. You can create, customise and export maps for free, with no sign-up required.
Yes. Choose a transparent background in the editor before exporting your PNG. This lets you place the map on your own slide background.
Yes. Return to the MapSculpt editor to change your map and export a new image. The exported PNG itself is a finished image, not editable map shapes.
Yes. Import a CSV in a supported editor, match your geographic identifiers, review the values and classification, then apply the data to your map.
No. MapSculpt exports PNG images that you can insert into PowerPoint, Google Slides and Keynote. It does not export native PPTX files or editable PowerPoint map shapes.
YOUR NEXT PRESENTATION STARTS HERE
Choose a geography, make it yours, and create a map that brings your presentation to life.