Skip to content
MapSculpt

GEOGRAPHIC MAP MAKER / OKLAHOMA

Oklahoma
Counties Map Maker

Compare population growth around Oklahoma City with the west and Panhandle. Then use the same 77 Census county units to map your own data.

Free online editor · No sign-up required

77counties
individually editable

Population Change in Oklahoma

July 2024 to July 2025 · 77 counties

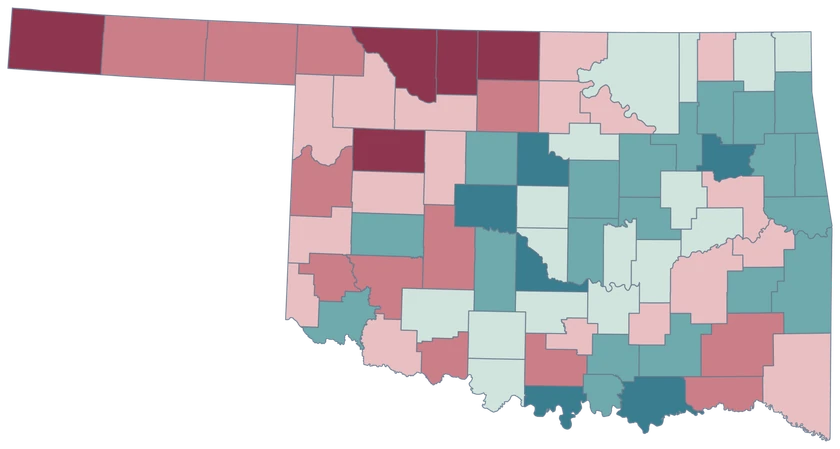
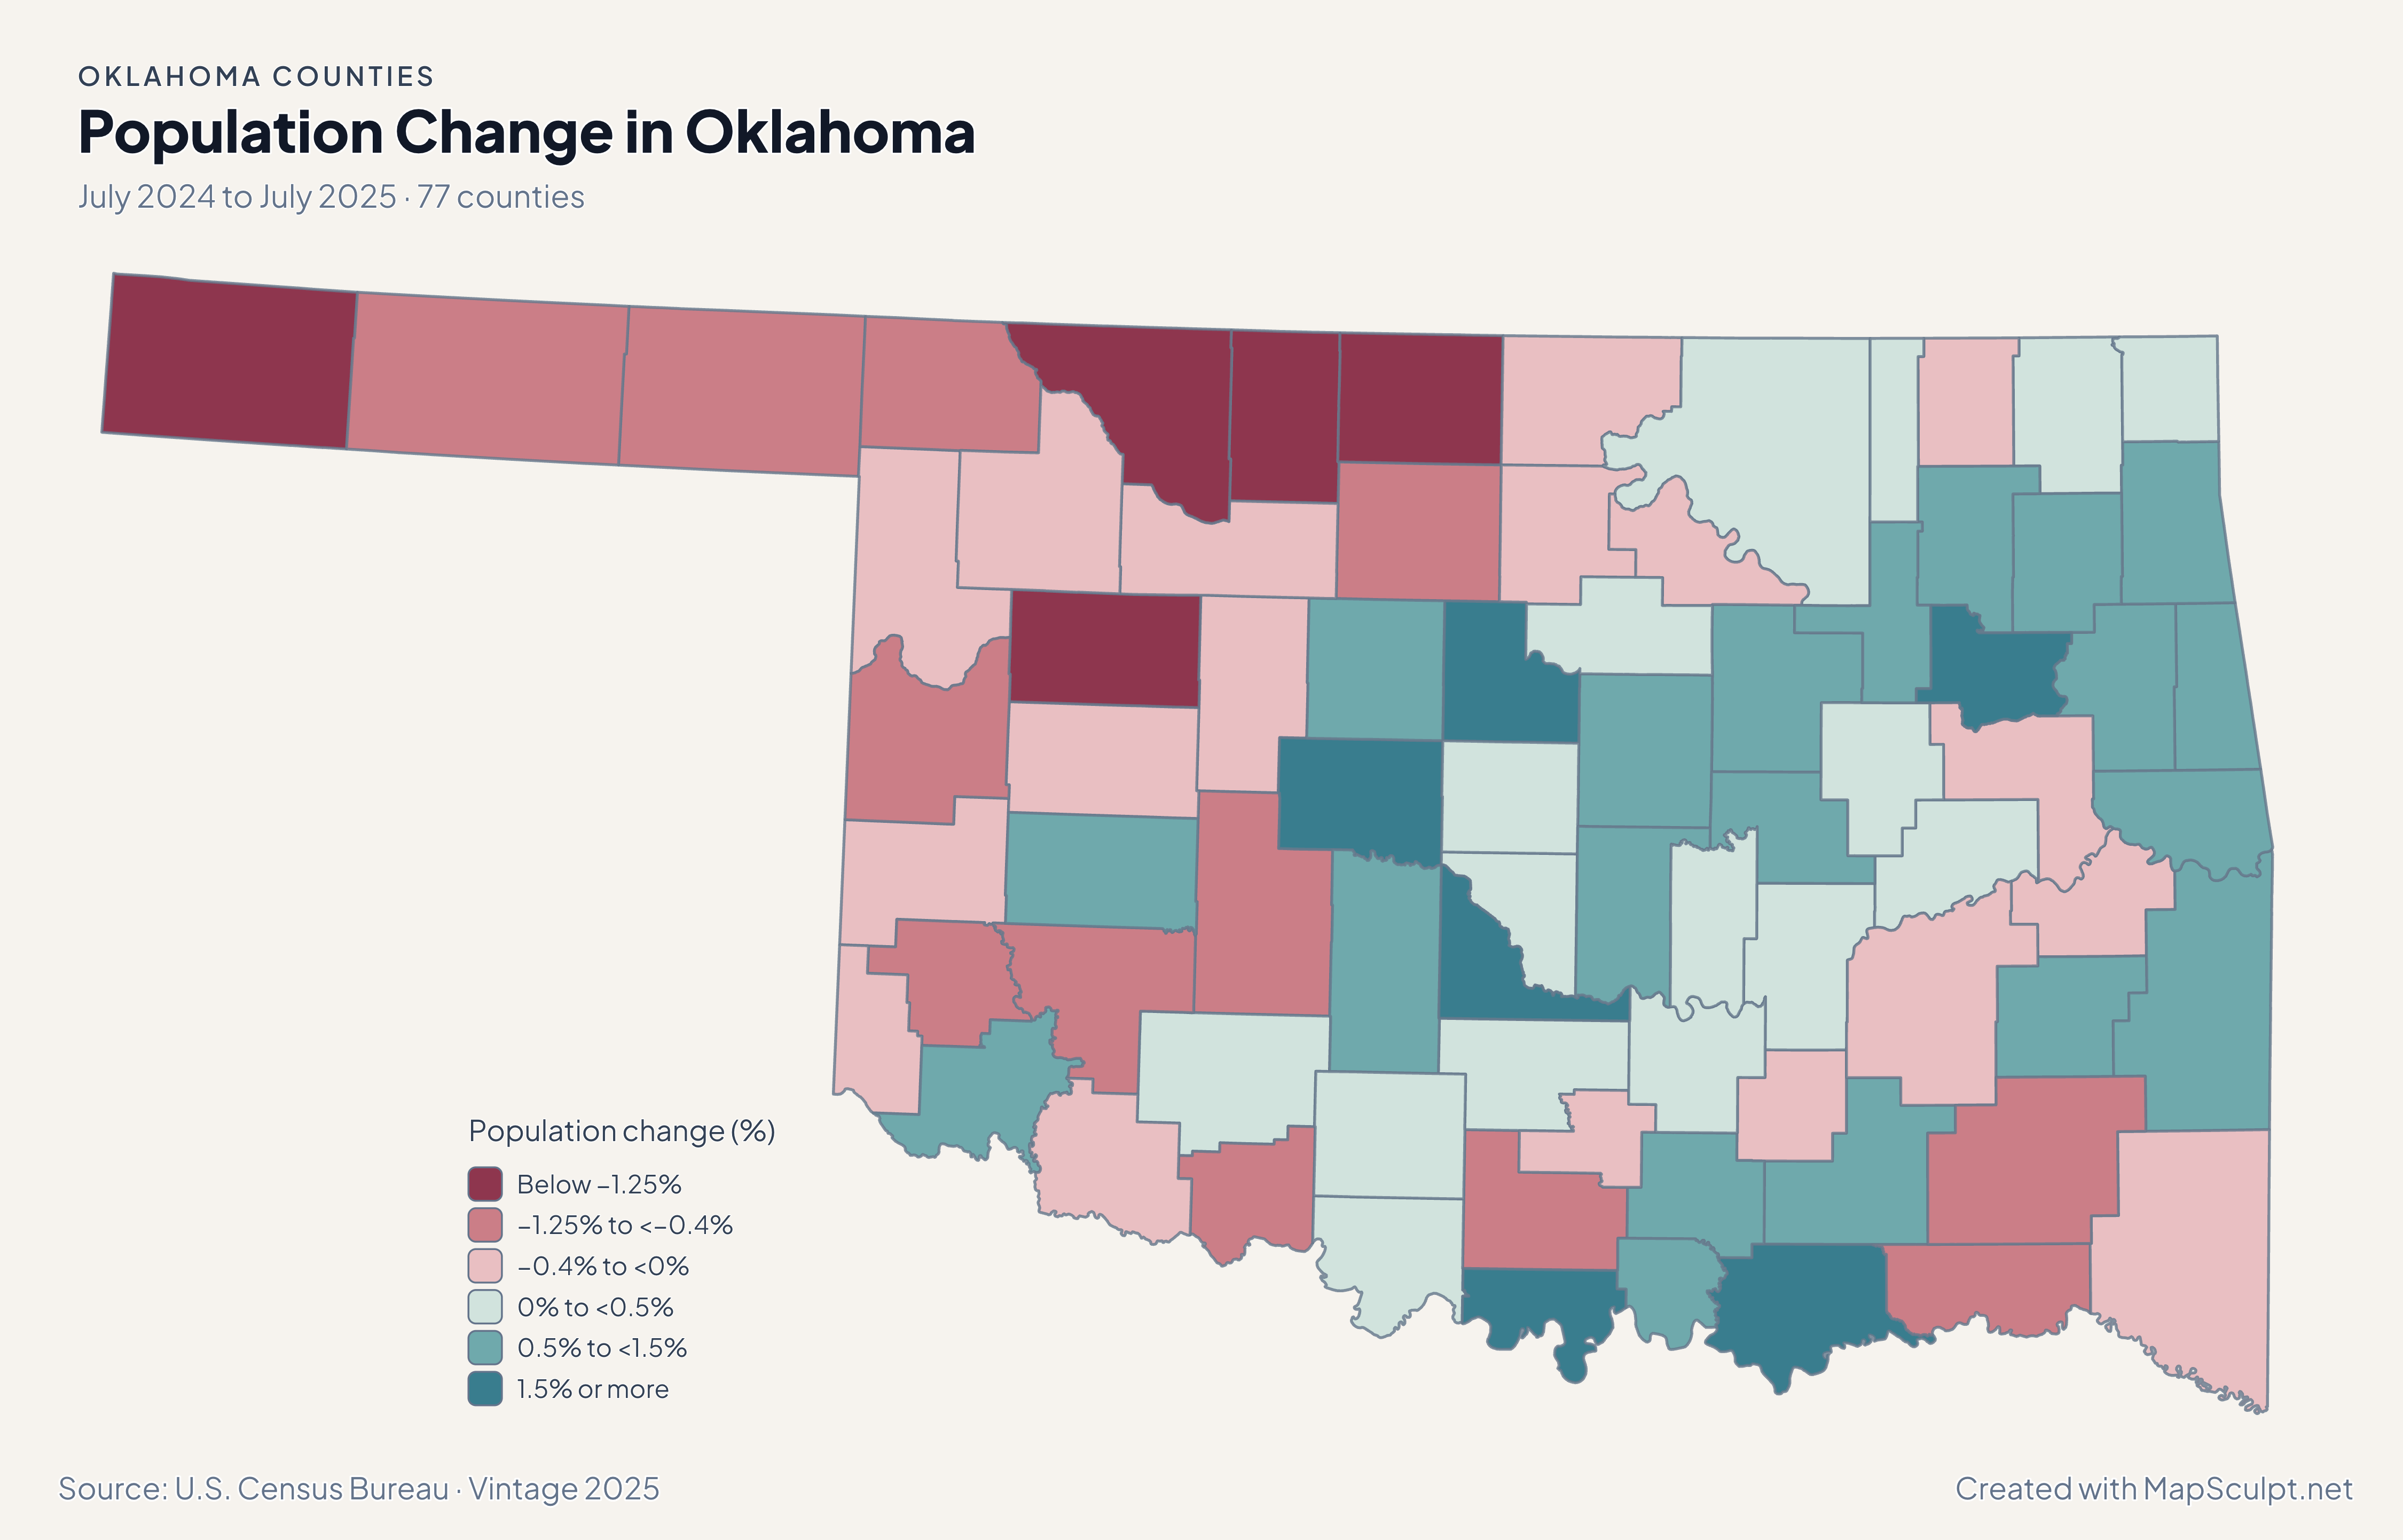
Oklahoma county population change with stronger growth around Canadian, Logan and McClain and a decline in Cimarron.

Population change (%)

  • Below −1.25%
  • −1.25% to <−0.4%
  • −0.4% to <0%
  • 0% to <0.5%
  • 0.5% to <1.5%
  • 1.5% or more
U.S. Census Bureau · Vintage 2025Download complete PNG Percentage change uses each area’s July 2024 population as the starting point.

KNOW YOUR GEOGRAPHY

County lines across Oklahoma, including the Panhandle.

The county inventory covers the Panhandle through southeastern Oklahoma, with separate shapes for Oklahoma, Tulsa and Cleveland counties.

Oklahoma’s county boundaries and Tribal jurisdictions are different geographic layers. Use an authoritative Tribal boundary source for Tribal lands or jurisdictional analysis.

Browse all county GEOIDs ↗

2025 Census boundaries

OFFICIAL DATA

Growth around Oklahoma City and contrasts farther west.

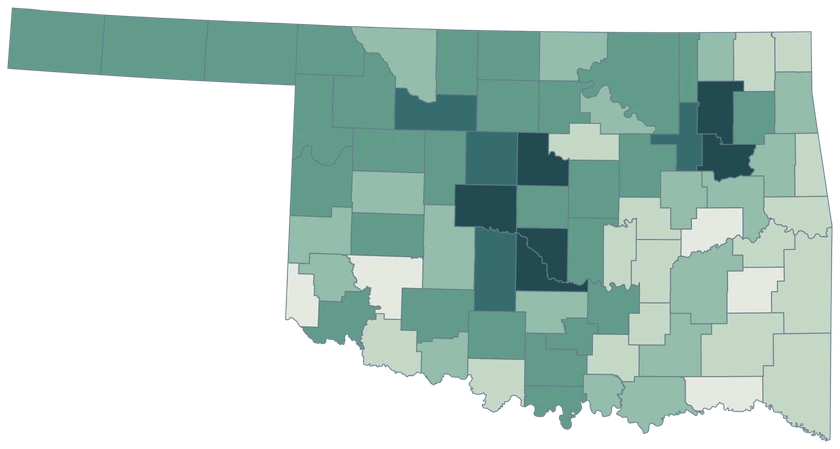
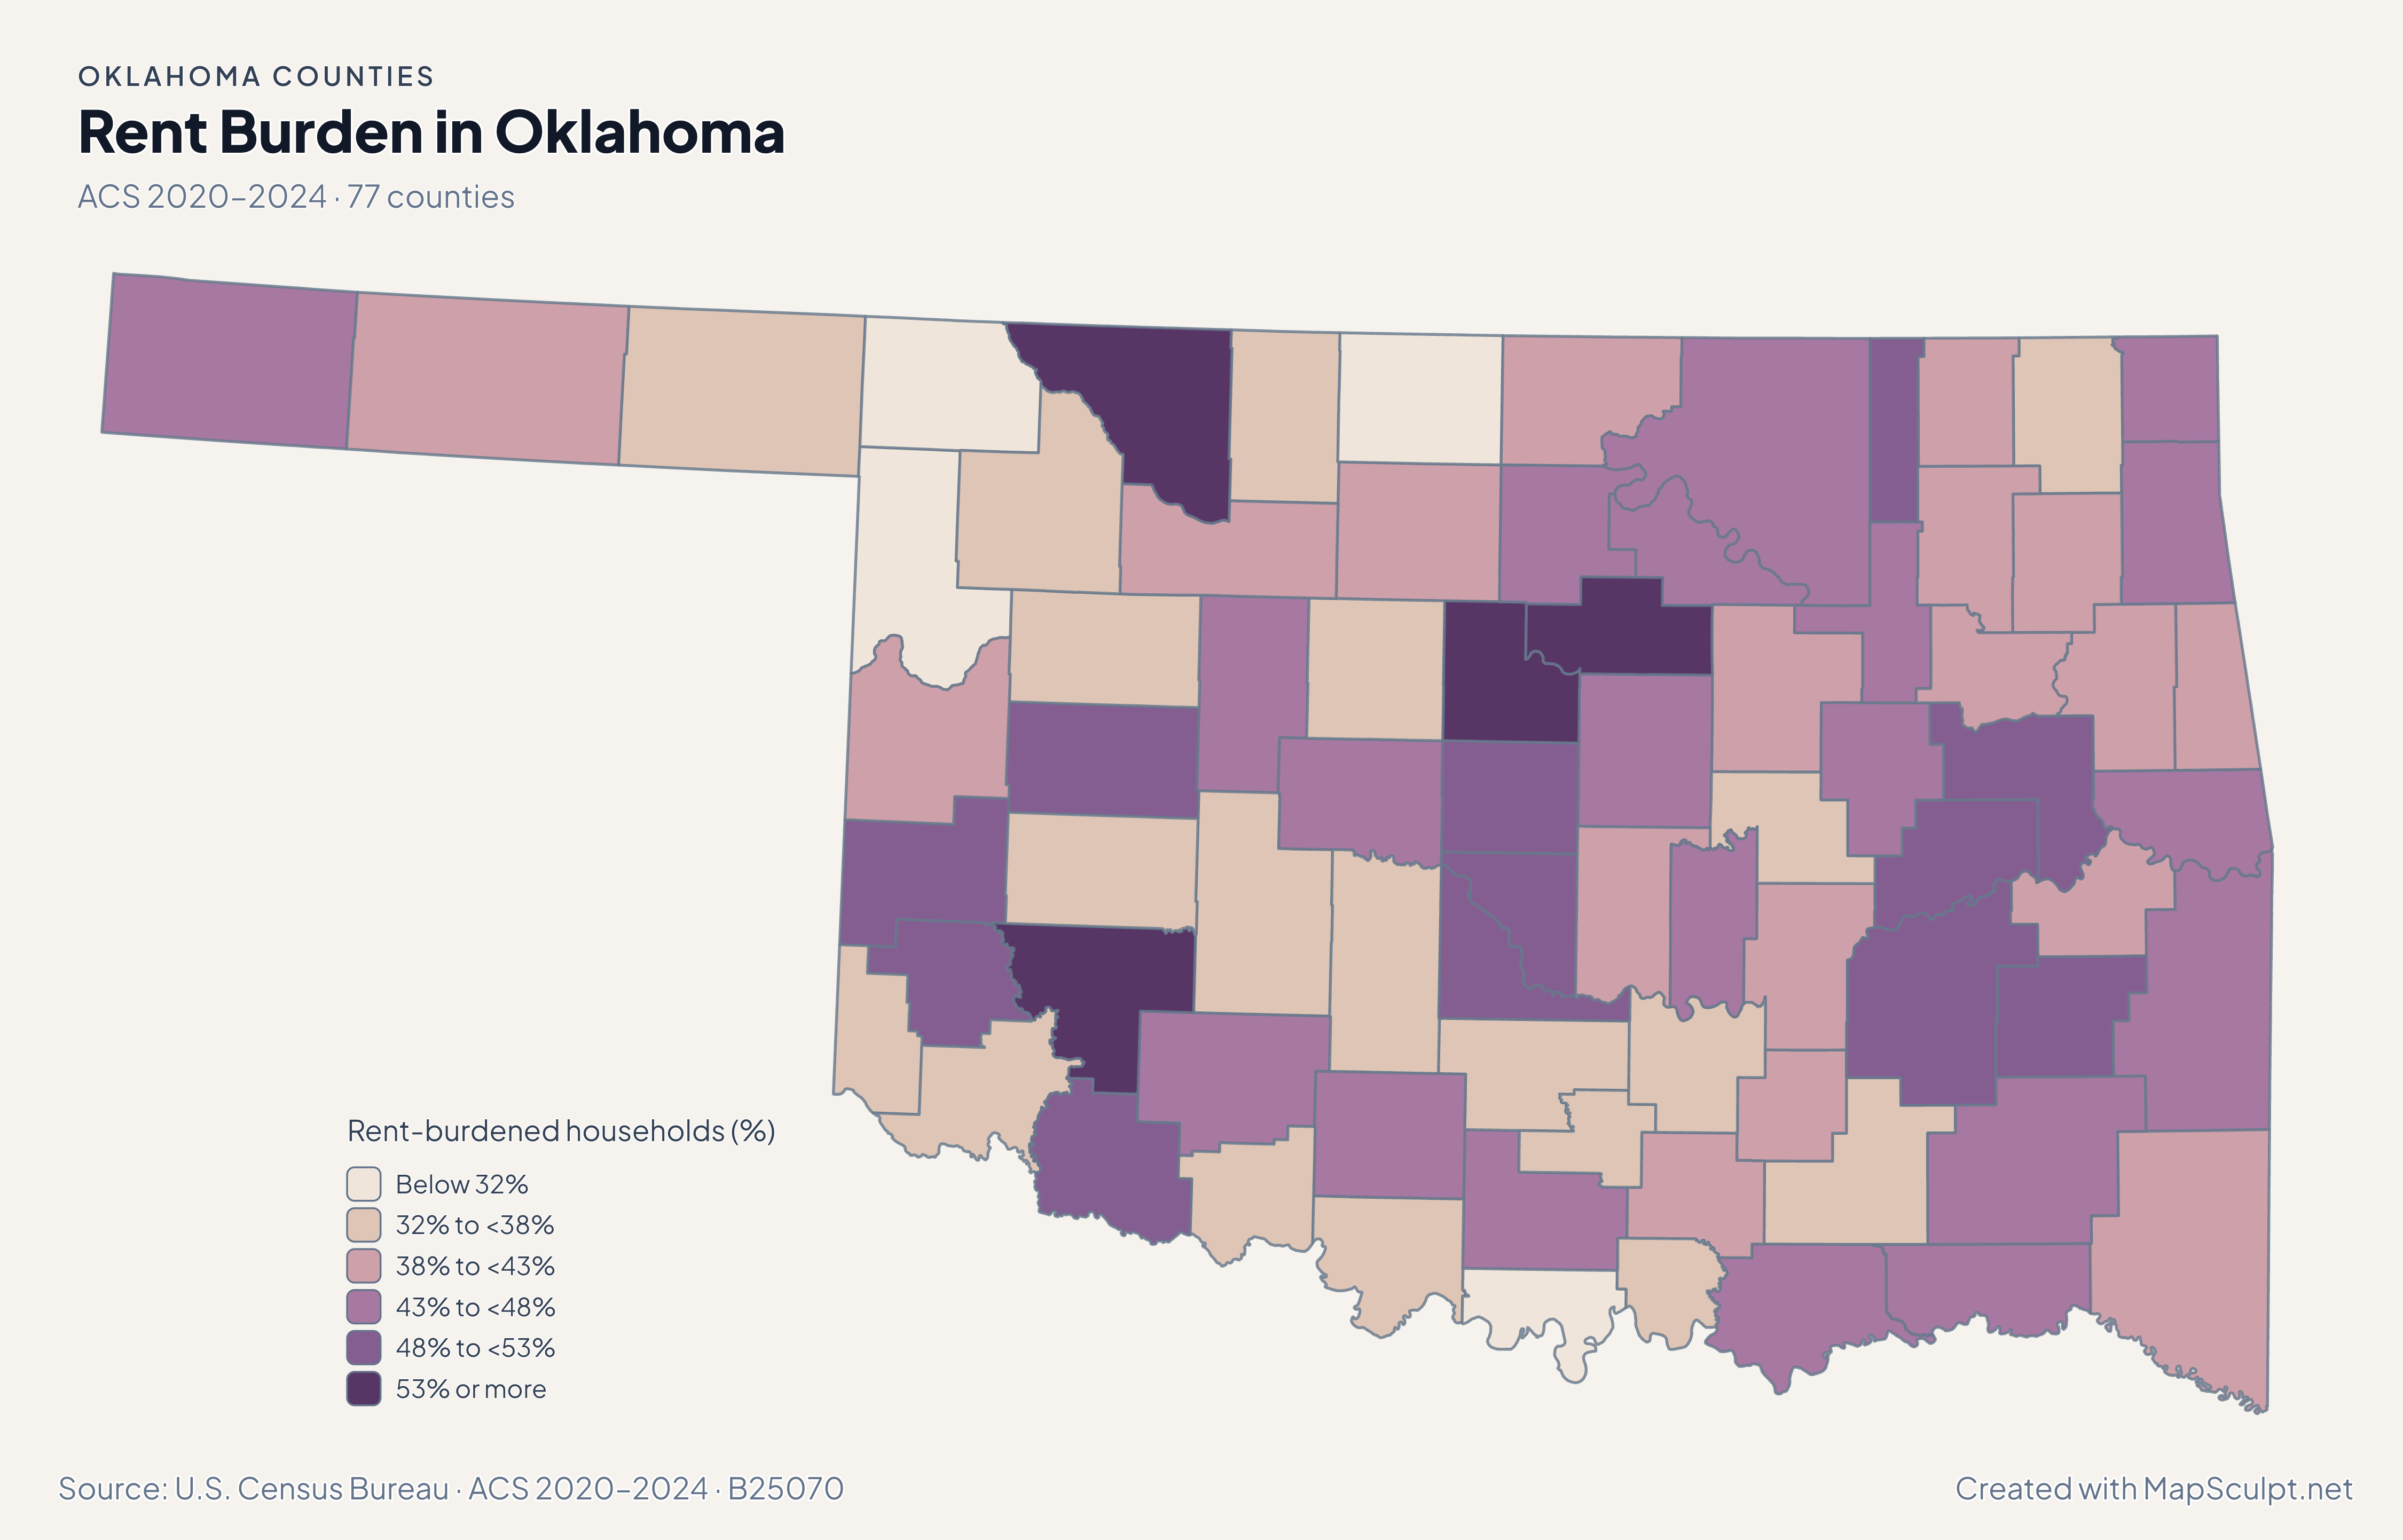
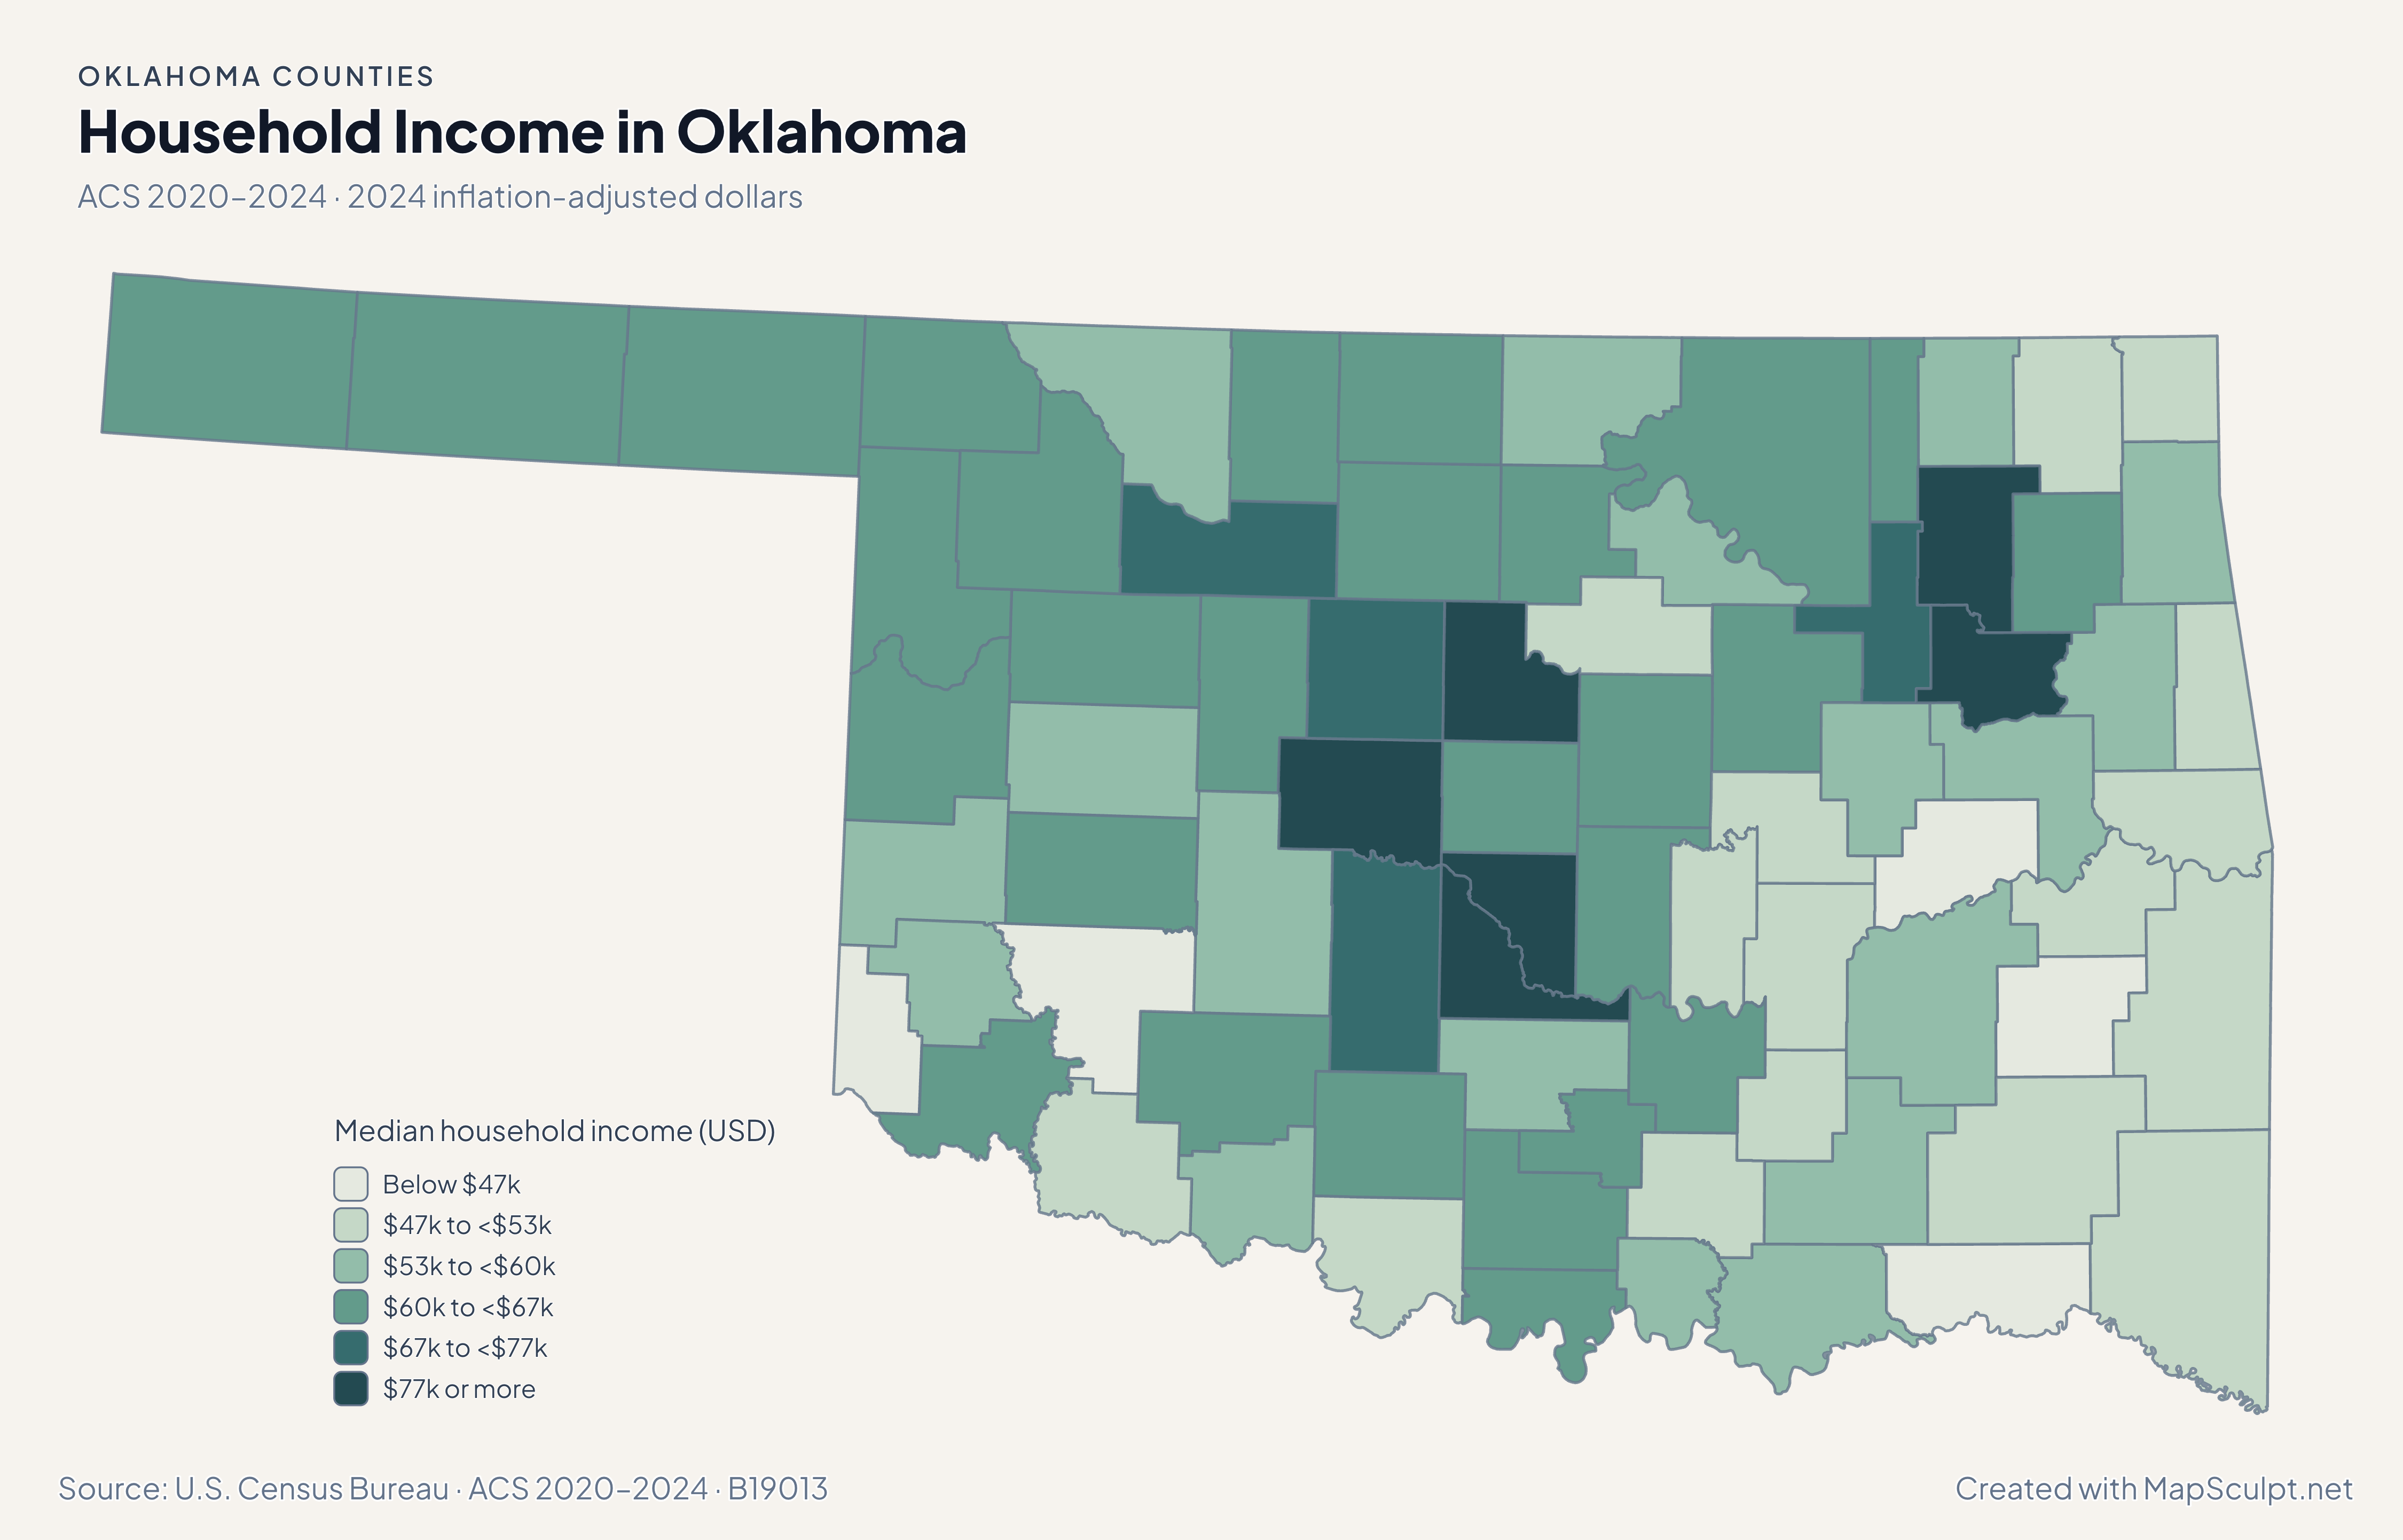
Population and domestic moves use the July 2024–July 2025 estimates. Income and renter costs use the 2020–2024 American Community Survey.

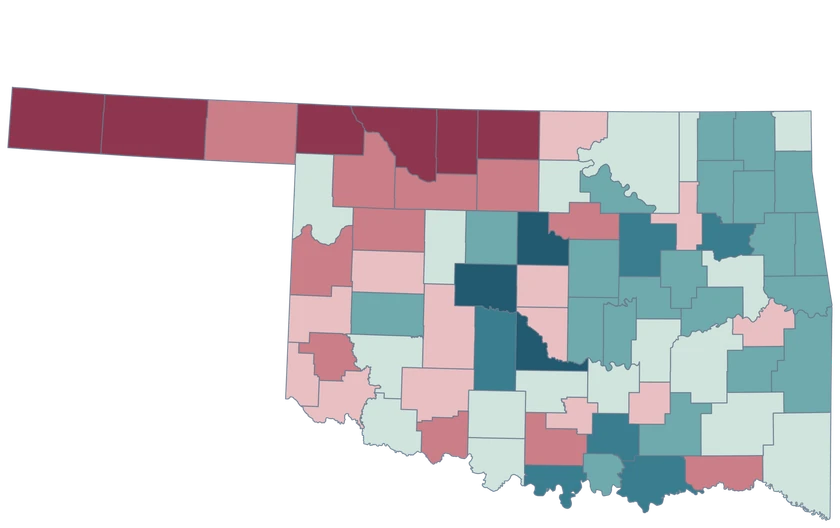
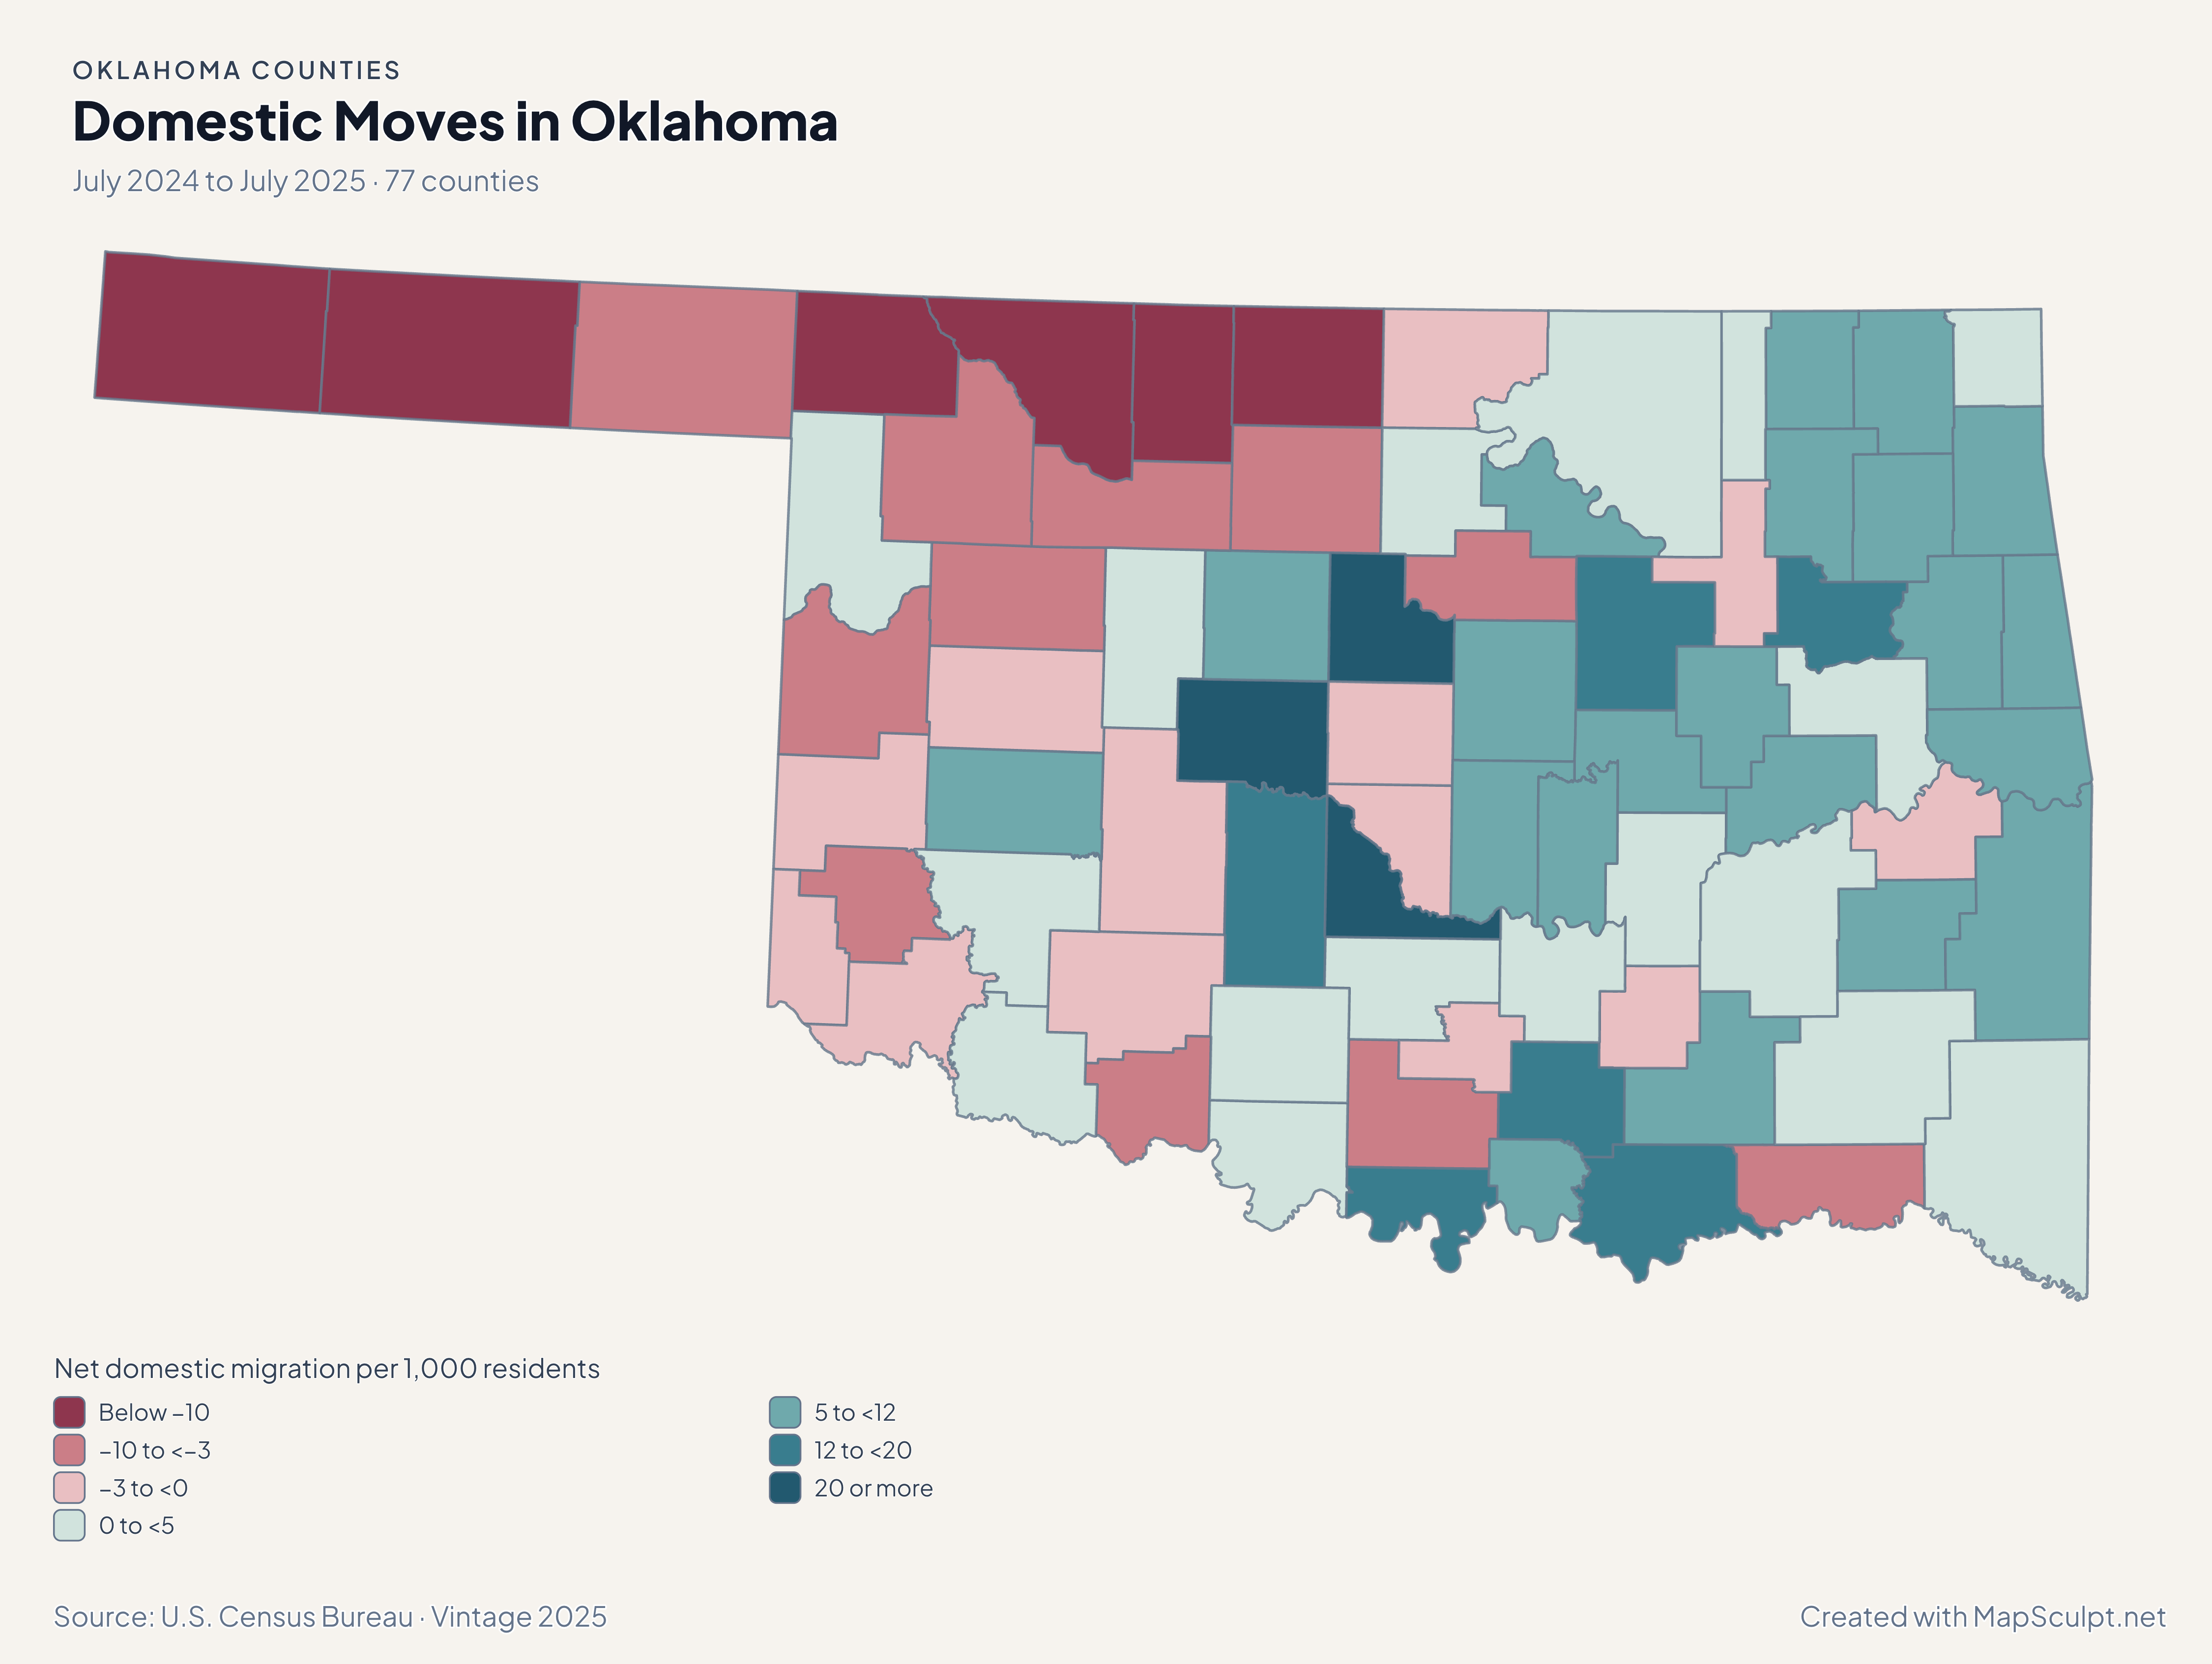
Oklahoma net domestic migration, contrasting Canadian County gains with losses in Oklahoma and Cleveland counties.

July 2024 to July 2025 · 77 counties

Domestic moves sharpen the metro contrast.

Canadian recorded +25.29 net domestic movers per 1,000 residents, while Oklahoma County recorded −1.35 and Cleveland recorded −1.92. All three grew overall.

Net domestic migration per 1,000 residents

  • Below −10
  • −10 to <−3
  • −3 to <0
  • 0 to <5
  • 5 to <12
  • 12 to <20
  • 20 or more

U.S. Census Bureau · Vintage 2025

Download complete PNG

Canadian grew 3.05%, Logan 2.73% and McClain 2.30% from July 2024 to July 2025. Oklahoma County grew 0.48%, Tulsa grew 0.59%, and Cimarron in the Panhandle declined 2.92%. See the Census estimates ↗

MAKE IT YOURS

From county data to a finished map.

  1. Open the Oklahoma editor

    Start with all 77 selectable counties.

  2. Match your county records

    Use 40109 for Oklahoma County. Review the match list before applying colors.

  3. Choose a scale

    Use a palette and class boundaries suited to the units in your data.

  4. Export with a legend

    Include the source and reference period alongside a complete high-resolution PNG.

TRY CSV IMPORT

Try six Oklahoma records.

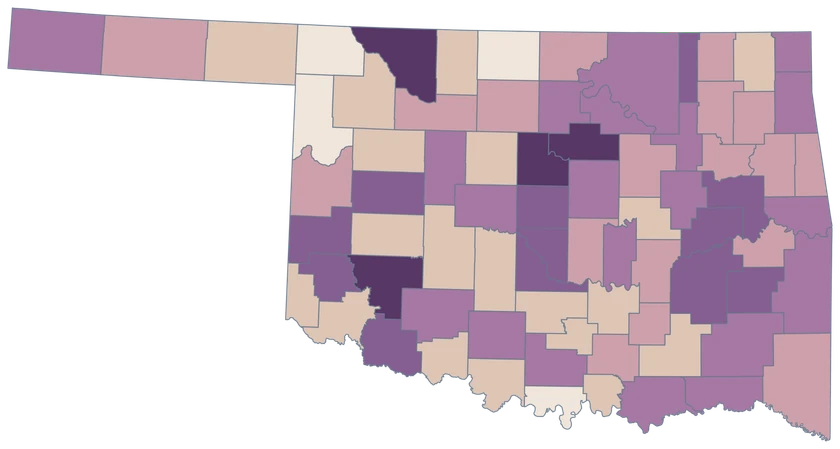
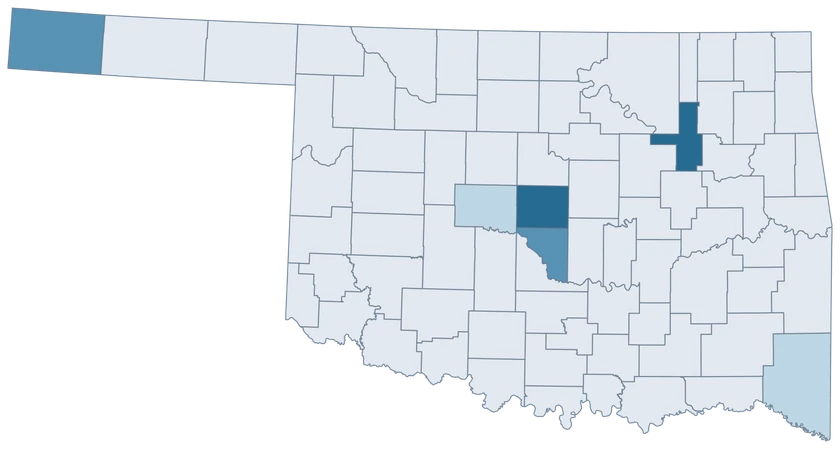
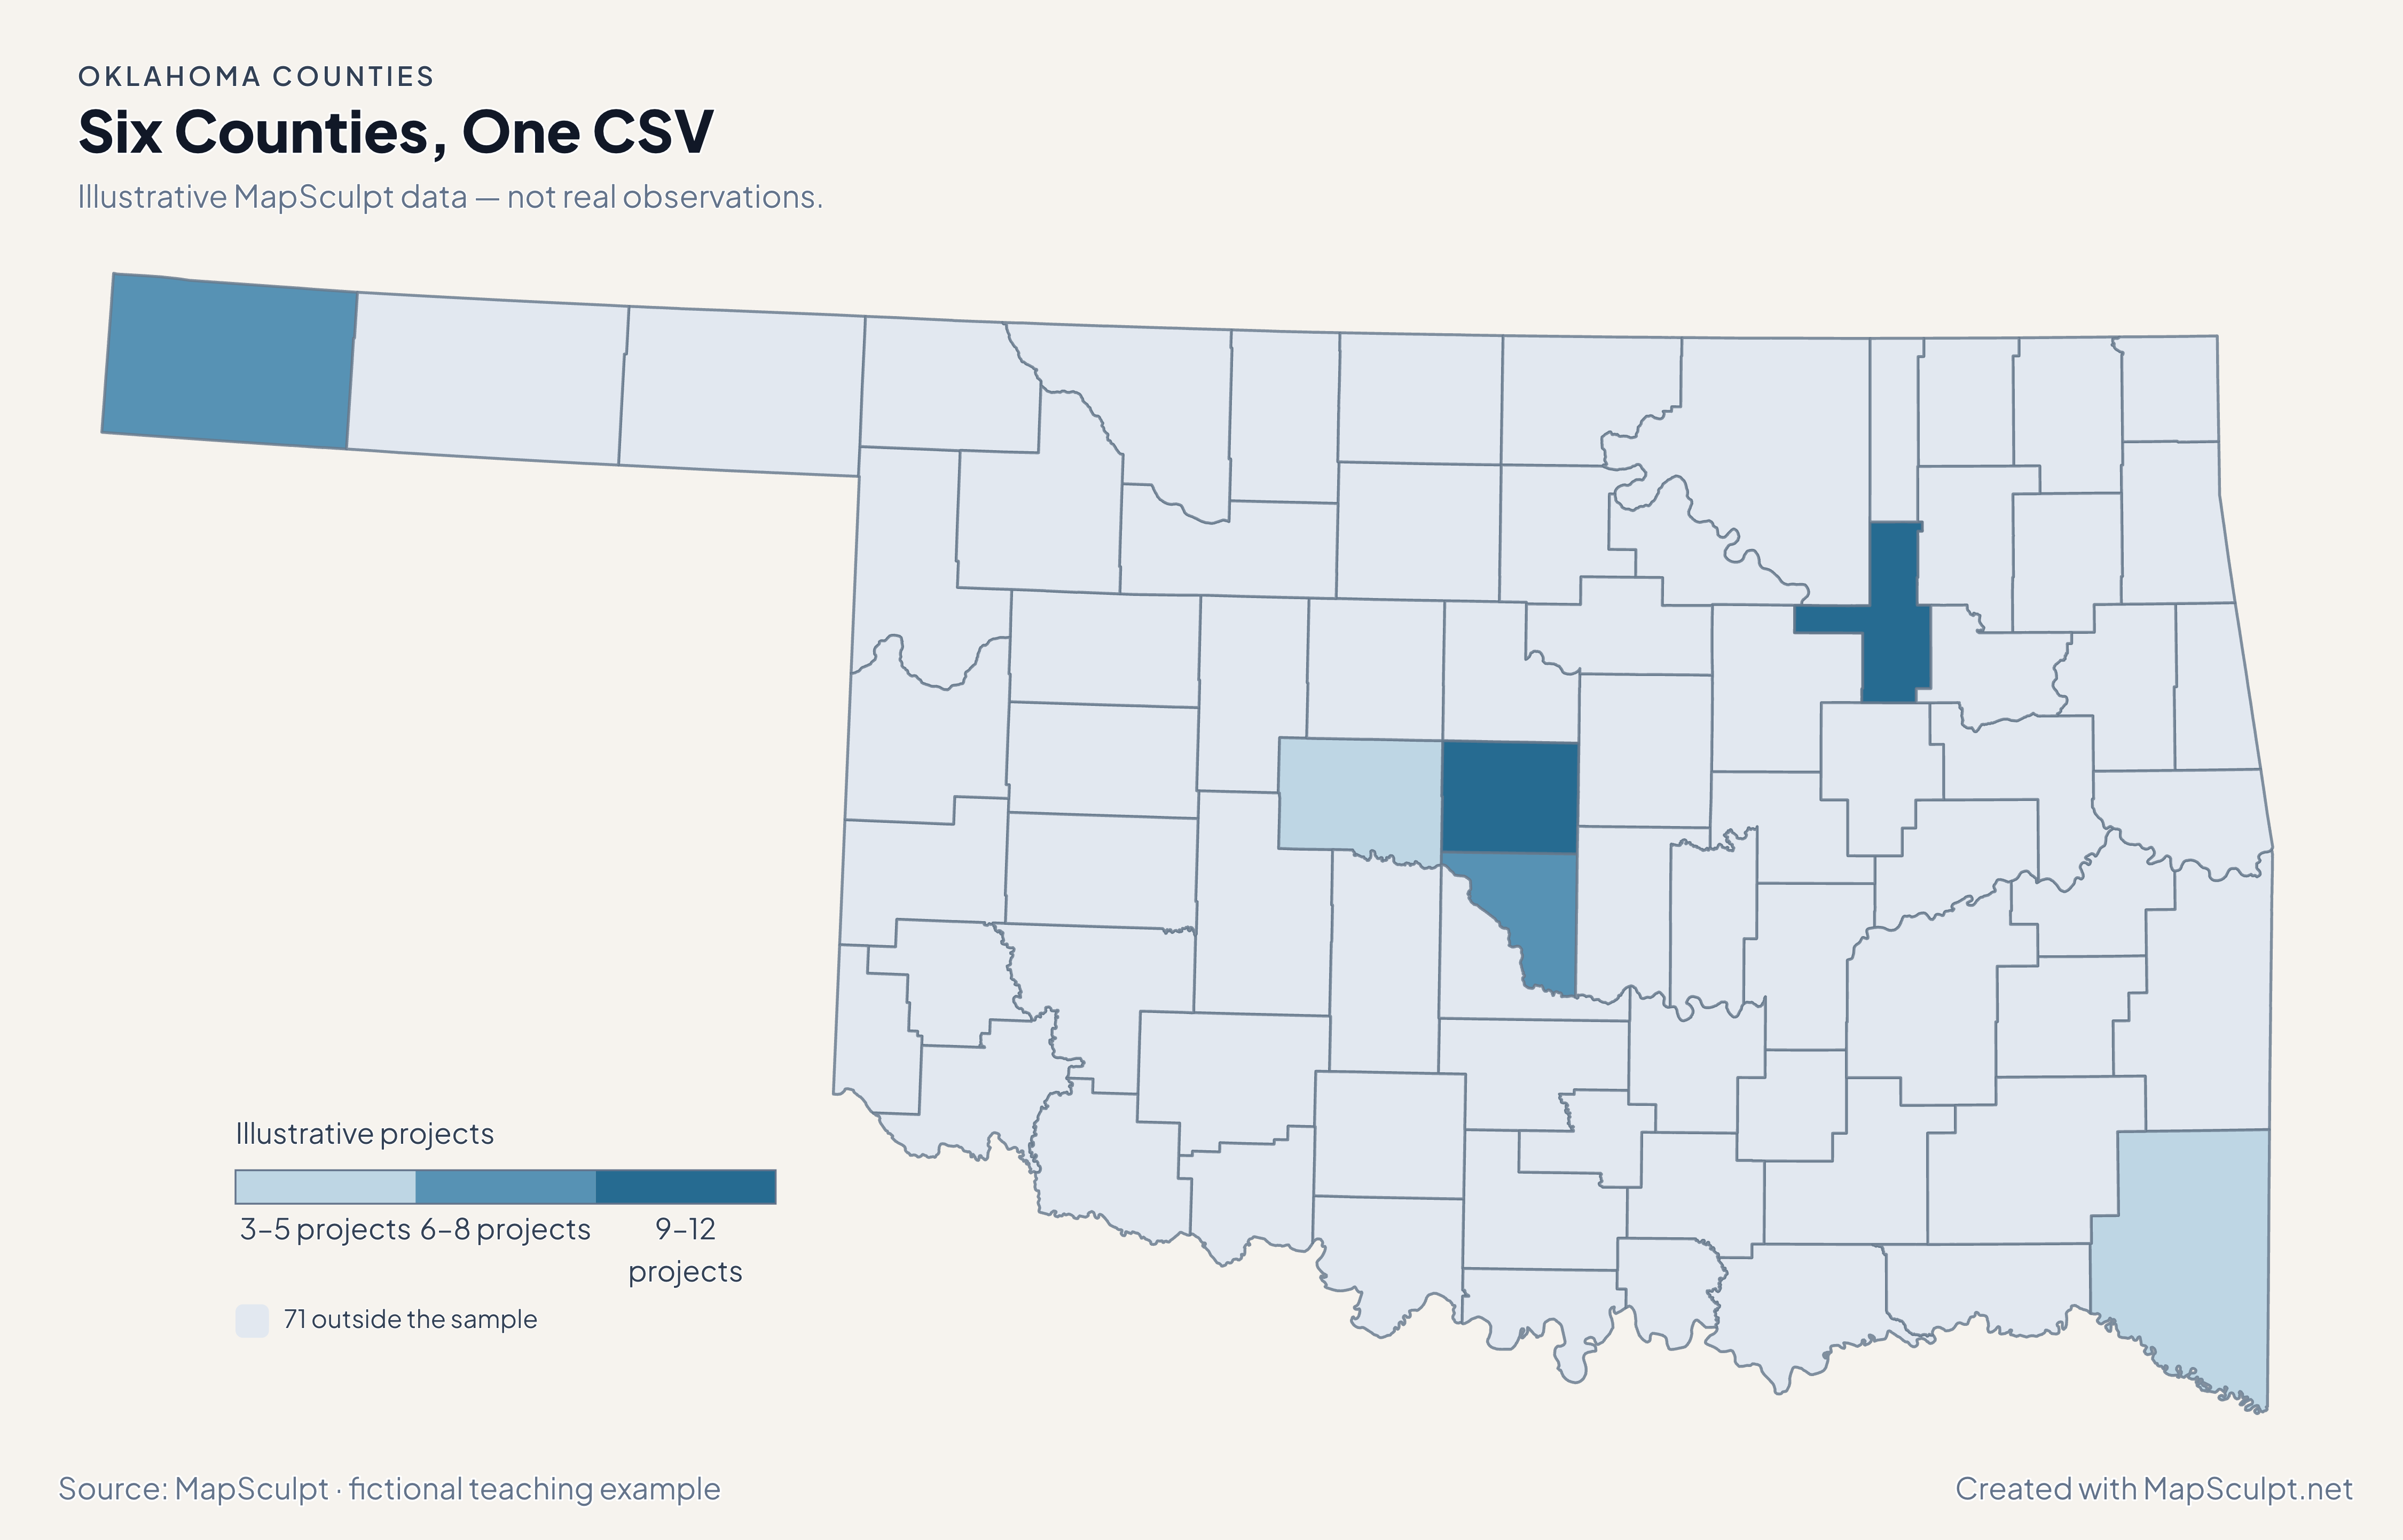
Import the fictional project counts and apply three custom classes. The other 71 counties stay neutral.

Illustrative MapSculpt data — not real observations.
CountyGEOIDProjects
Oklahoma County4010912
Tulsa County401439
Cleveland County400277
Canadian County400173
Cimarron County400258
McCurtain County400895

Keep five-digit GEOIDs as text. The sample uses 40109 for Oklahoma County.

Download illustrative CSV ↓

Six Counties, One CSV

Illustrative MapSculpt data — not real observations.

Oklahoma illustrative project counts for six counties; 71 counties remain neutral.

Illustrative projects

  • 3–5 projects
  • 6–8 projects
  • 9–12 projects
  • 71 outside the sample
Download complete PNG

CSV → Match 6 counties → Style → Export PNG Create a Oklahoma map

COUNTY REFERENCE

All 77 Oklahoma counties and GEOIDs.

Official county names and five-digit Census GEOIDs. Search by name or code.

  1. Adair CountyGEOID 40001
  2. Alfalfa CountyGEOID 40003
  3. Atoka CountyGEOID 40005
  4. Beaver CountyGEOID 40007
  5. Beckham CountyGEOID 40009
  6. Blaine CountyGEOID 40011
  7. Bryan CountyGEOID 40013
  8. Caddo CountyGEOID 40015
  9. Canadian CountyGEOID 40017
  10. Carter CountyGEOID 40019
  11. Cherokee CountyGEOID 40021
  12. Choctaw CountyGEOID 40023
  13. Cimarron CountyGEOID 40025
  14. Cleveland CountyGEOID 40027
  15. Coal CountyGEOID 40029
  16. Comanche CountyGEOID 40031
  17. Cotton CountyGEOID 40033
  18. Craig CountyGEOID 40035
  19. Creek CountyGEOID 40037
  20. Custer CountyGEOID 40039
  21. Delaware CountyGEOID 40041
  22. Dewey CountyGEOID 40043
  23. Ellis CountyGEOID 40045
  24. Garfield CountyGEOID 40047
  25. Garvin CountyGEOID 40049
  26. Grady CountyGEOID 40051
  27. Grant CountyGEOID 40053
  28. Greer CountyGEOID 40055
  29. Harmon CountyGEOID 40057
  30. Harper CountyGEOID 40059
  31. Haskell CountyGEOID 40061
  32. Hughes CountyGEOID 40063
  33. Jackson CountyGEOID 40065
  34. Jefferson CountyGEOID 40067
  35. Johnston CountyGEOID 40069
  36. Kay CountyGEOID 40071
  37. Kingfisher CountyGEOID 40073
  38. Kiowa CountyGEOID 40075
  39. Latimer CountyGEOID 40077
  40. Le Flore CountyGEOID 40079
  41. Lincoln CountyGEOID 40081
  42. Logan CountyGEOID 40083
  43. Love CountyGEOID 40085
  44. Major CountyGEOID 40093
  45. Marshall CountyGEOID 40095
  46. Mayes CountyGEOID 40097
  47. McClain CountyGEOID 40087
  48. McCurtain CountyGEOID 40089
  49. McIntosh CountyGEOID 40091
  50. Murray CountyGEOID 40099
  51. Muskogee CountyGEOID 40101
  52. Noble CountyGEOID 40103
  53. Nowata CountyGEOID 40105
  54. Okfuskee CountyGEOID 40107
  55. Oklahoma CountyGEOID 40109
  56. Okmulgee CountyGEOID 40111
  57. Osage CountyGEOID 40113
  58. Ottawa CountyGEOID 40115
  59. Pawnee CountyGEOID 40117
  60. Payne CountyGEOID 40119
  61. Pittsburg CountyGEOID 40121
  62. Pontotoc CountyGEOID 40123
  63. Pottawatomie CountyGEOID 40125
  64. Pushmataha CountyGEOID 40127
  65. Roger Mills CountyGEOID 40129
  66. Rogers CountyGEOID 40131
  67. Seminole CountyGEOID 40133
  68. Sequoyah CountyGEOID 40135
  69. Stephens CountyGEOID 40137
  70. Texas CountyGEOID 40139
  71. Tillman CountyGEOID 40141
  72. Tulsa CountyGEOID 40143
  73. Wagoner CountyGEOID 40145
  74. Washington CountyGEOID 40147
  75. Washita CountyGEOID 40149
  76. Woods CountyGEOID 40151
  77. Woodward CountyGEOID 40153

U.S. Census Bureau · 2025 Cartographic Boundary Files

COMMON QUESTIONS

Oklahoma county map questions.

What is the GEOID for Oklahoma County?

Use 40109 for Oklahoma County. Oklahoma City crosses county boundaries, so use a county-wide observation when joining to this map.

Can I distinguish Tulsa and Cleveland counties?

Yes. Tulsa uses 40143 and Cleveland uses 40027. Both have separate selectable boundaries.

Which parts of the Panhandle can I color?

Cimarron, Texas and Beaver counties are individually selectable. Their county names should be paired with Oklahoma GEOIDs in multi-state data.

Does this map identify Tribal jurisdictions?

Use authoritative Tribal boundary data for that purpose. The borders here are the Census county layer.

Why can a county grow while domestic migration is negative?

Population change combines domestic moves with other components, including international migration and births minus deaths.

Can I add data for Texas County without confusing it with the state of Texas?

Use the Oklahoma county GEOID 40139 in the region column. Keep all five digits when preparing the file.

YOUR NEXT MAP STARTS HERE

Build your own Oklahoma map.

Join your records by GEOID, check the counties that matched, and export with a legend and source.

Create a Oklahoma map