Skip to content
MapSculpt

GEOGRAPHIC MAP MAKER / PENNSYLVANIA

Pennsylvania
Counties Map Maker

Map Pennsylvania from the Delaware Valley to the Ohio River. See where county populations edged up or down, then use the same boundaries to map your own observations.

Free online editor · No sign-up required

67counties
individually editable

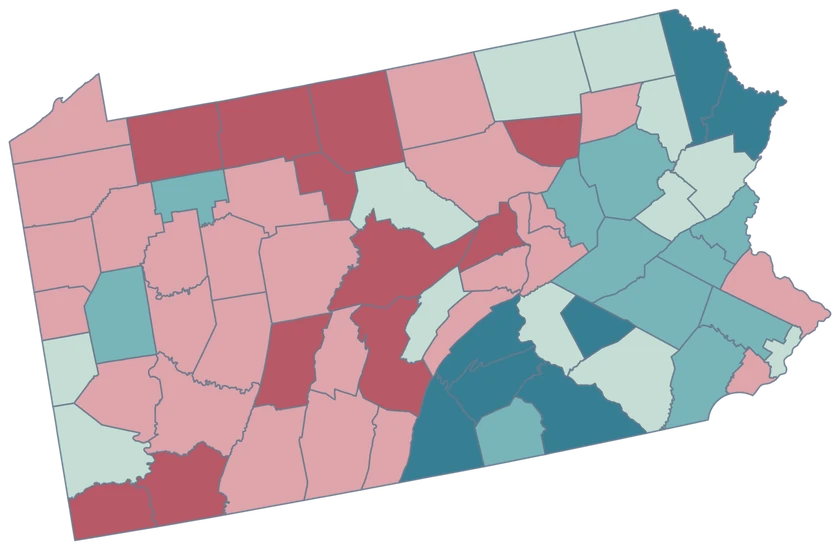
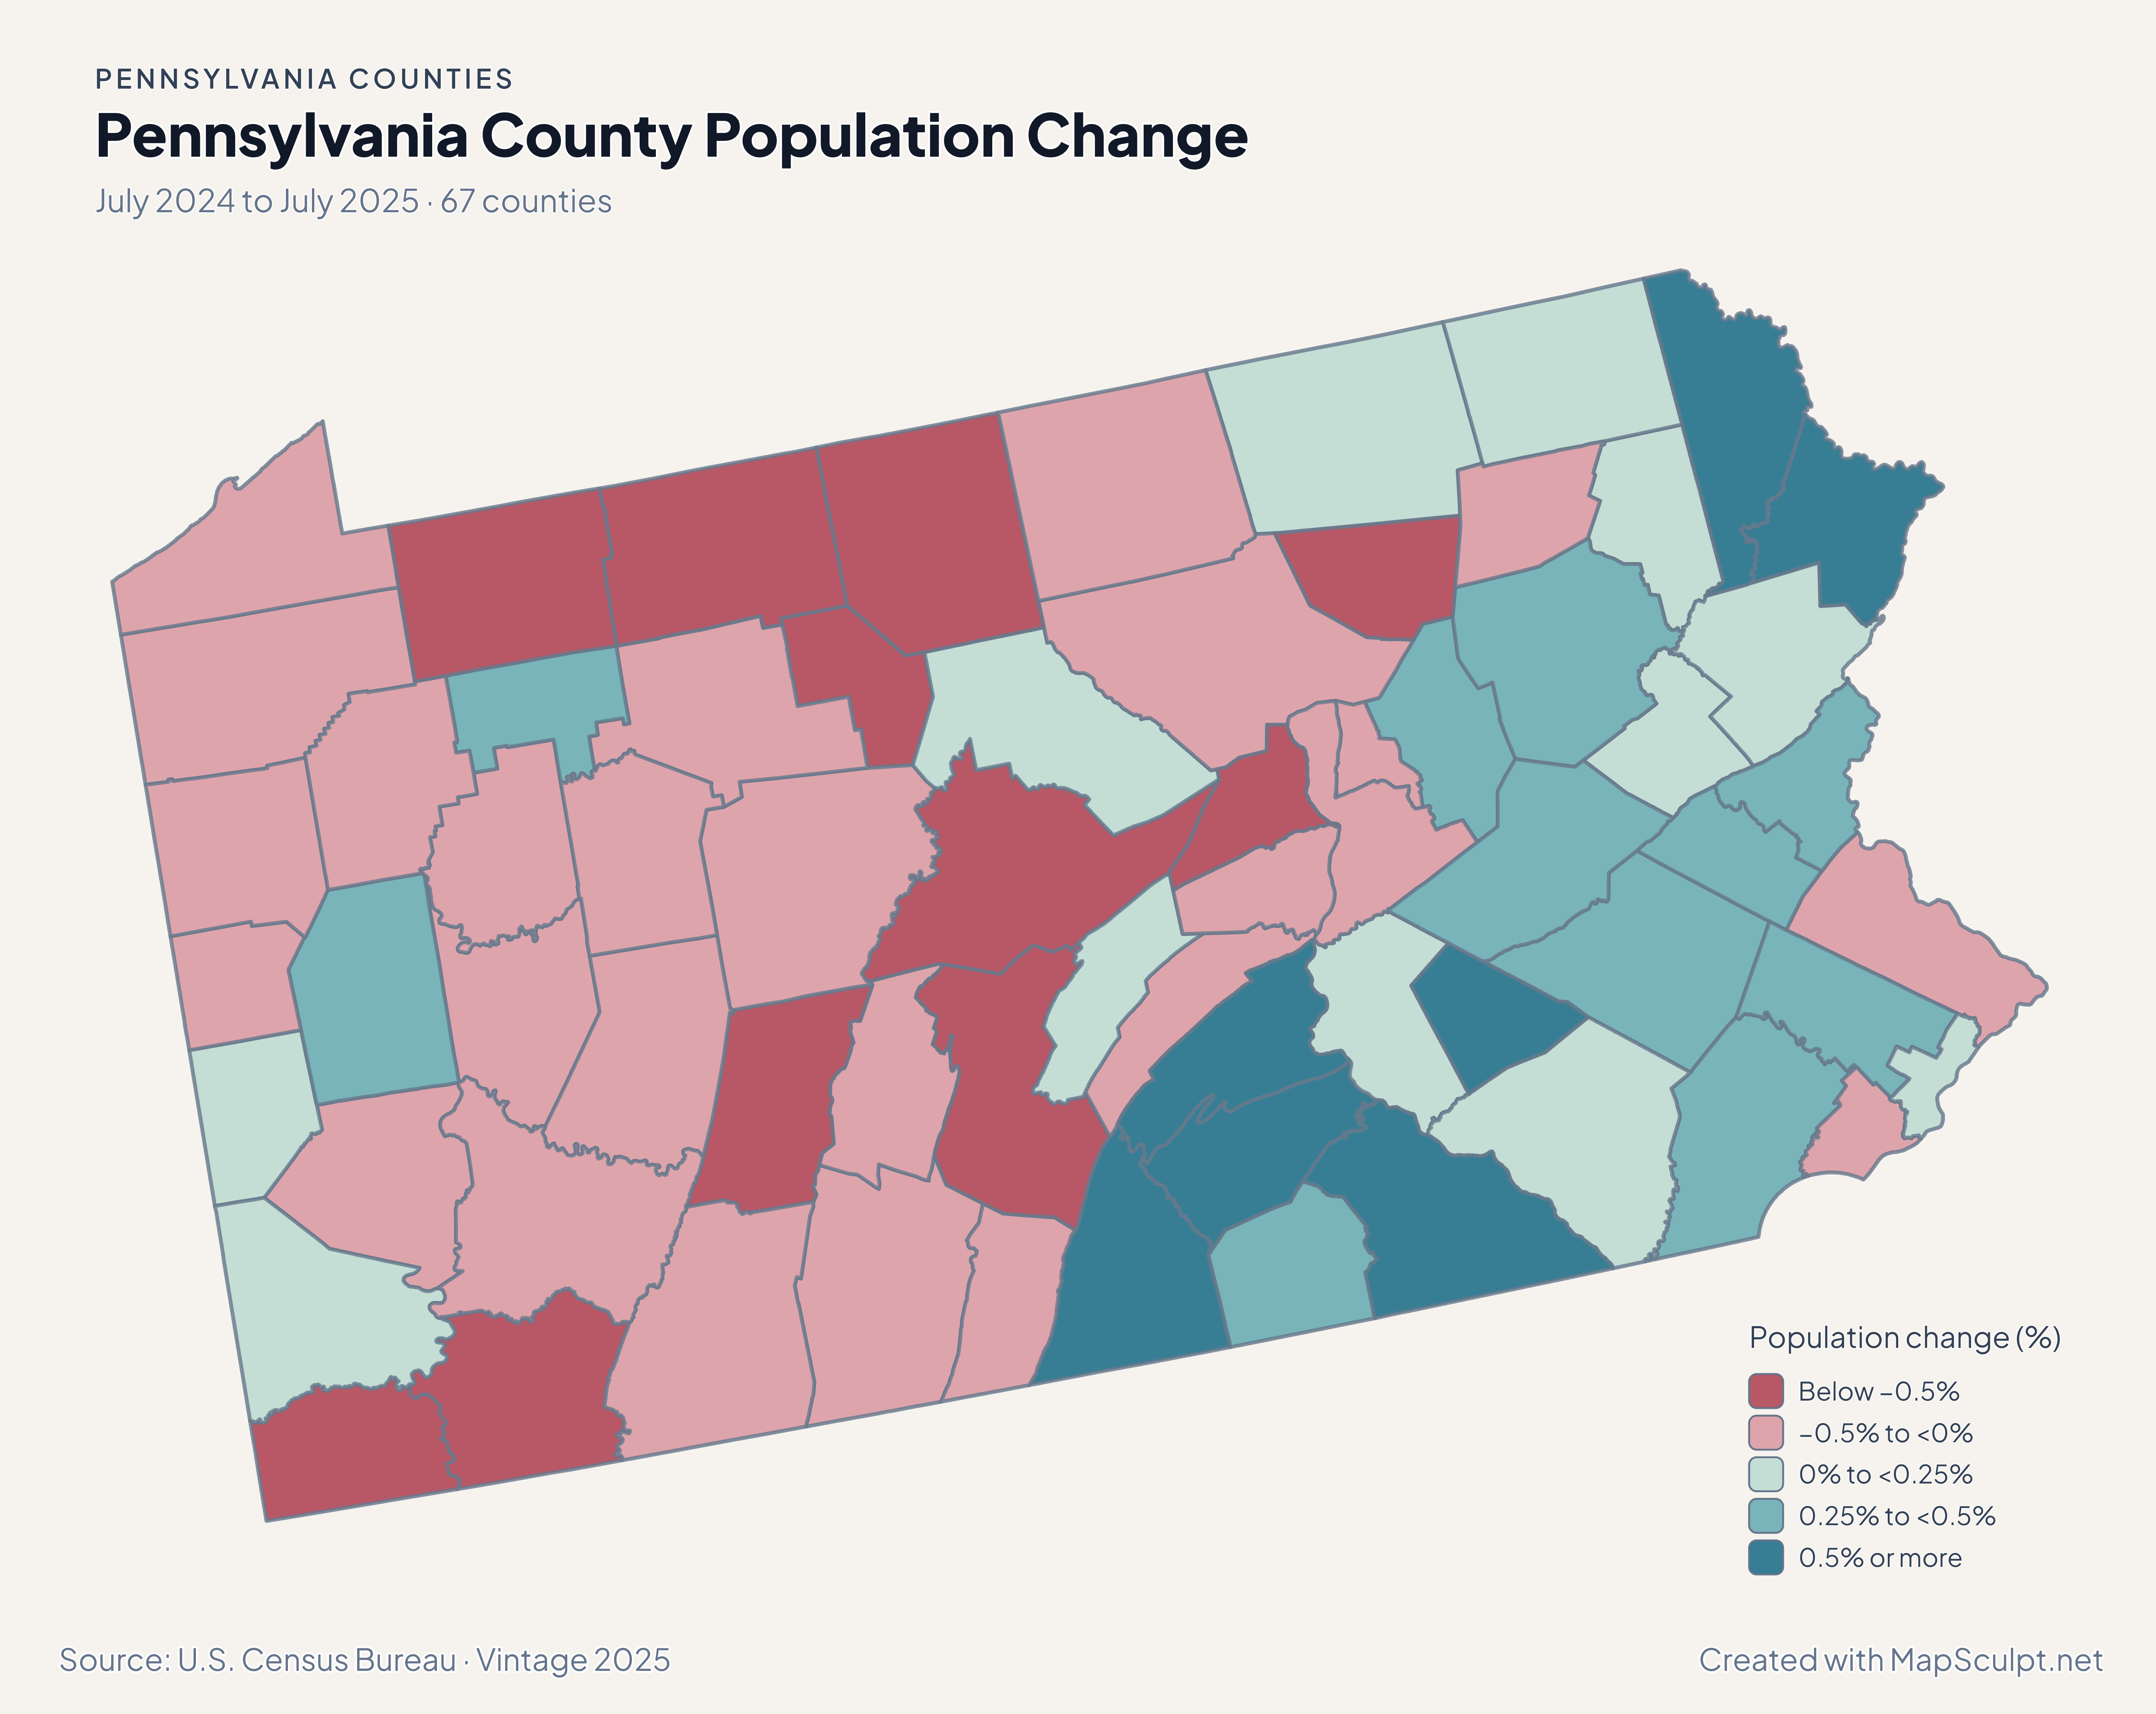
Pennsylvania County Population Change

July 2024 to July 2025 · 67 counties

Pennsylvania population change by county, with rose for declines and teal for gains. Cumberland lies in the highest growth band.

Population change (%)

  • Below −0.5%
  • −0.5% to <0%
  • 0% to <0.25%
  • 0.25% to <0.5%
  • 0.5% or more
U.S. Census Bureau · Vintage 2025Download complete PNG July-to-July population change uses each county’s 2024 population as its baseline.

KNOW YOUR GEOGRAPHY

From Philadelphia to the western river valleys.

Pennsylvania’s counties take in Lake Erie frontage, Appalachian ridges and the Delaware River corridor. The map uses county boundaries, so Philadelphia is one selectable county and Pittsburgh is within Allegheny County.

Townships, boroughs and municipalities are finer geographies. Use this map for comparable county-level observations, and check the county directory before joining records labeled with a city or township name.

Browse all county GEOIDs ↗

2025 Census boundaries

OFFICIAL DATA

Small changes across a varied county map.

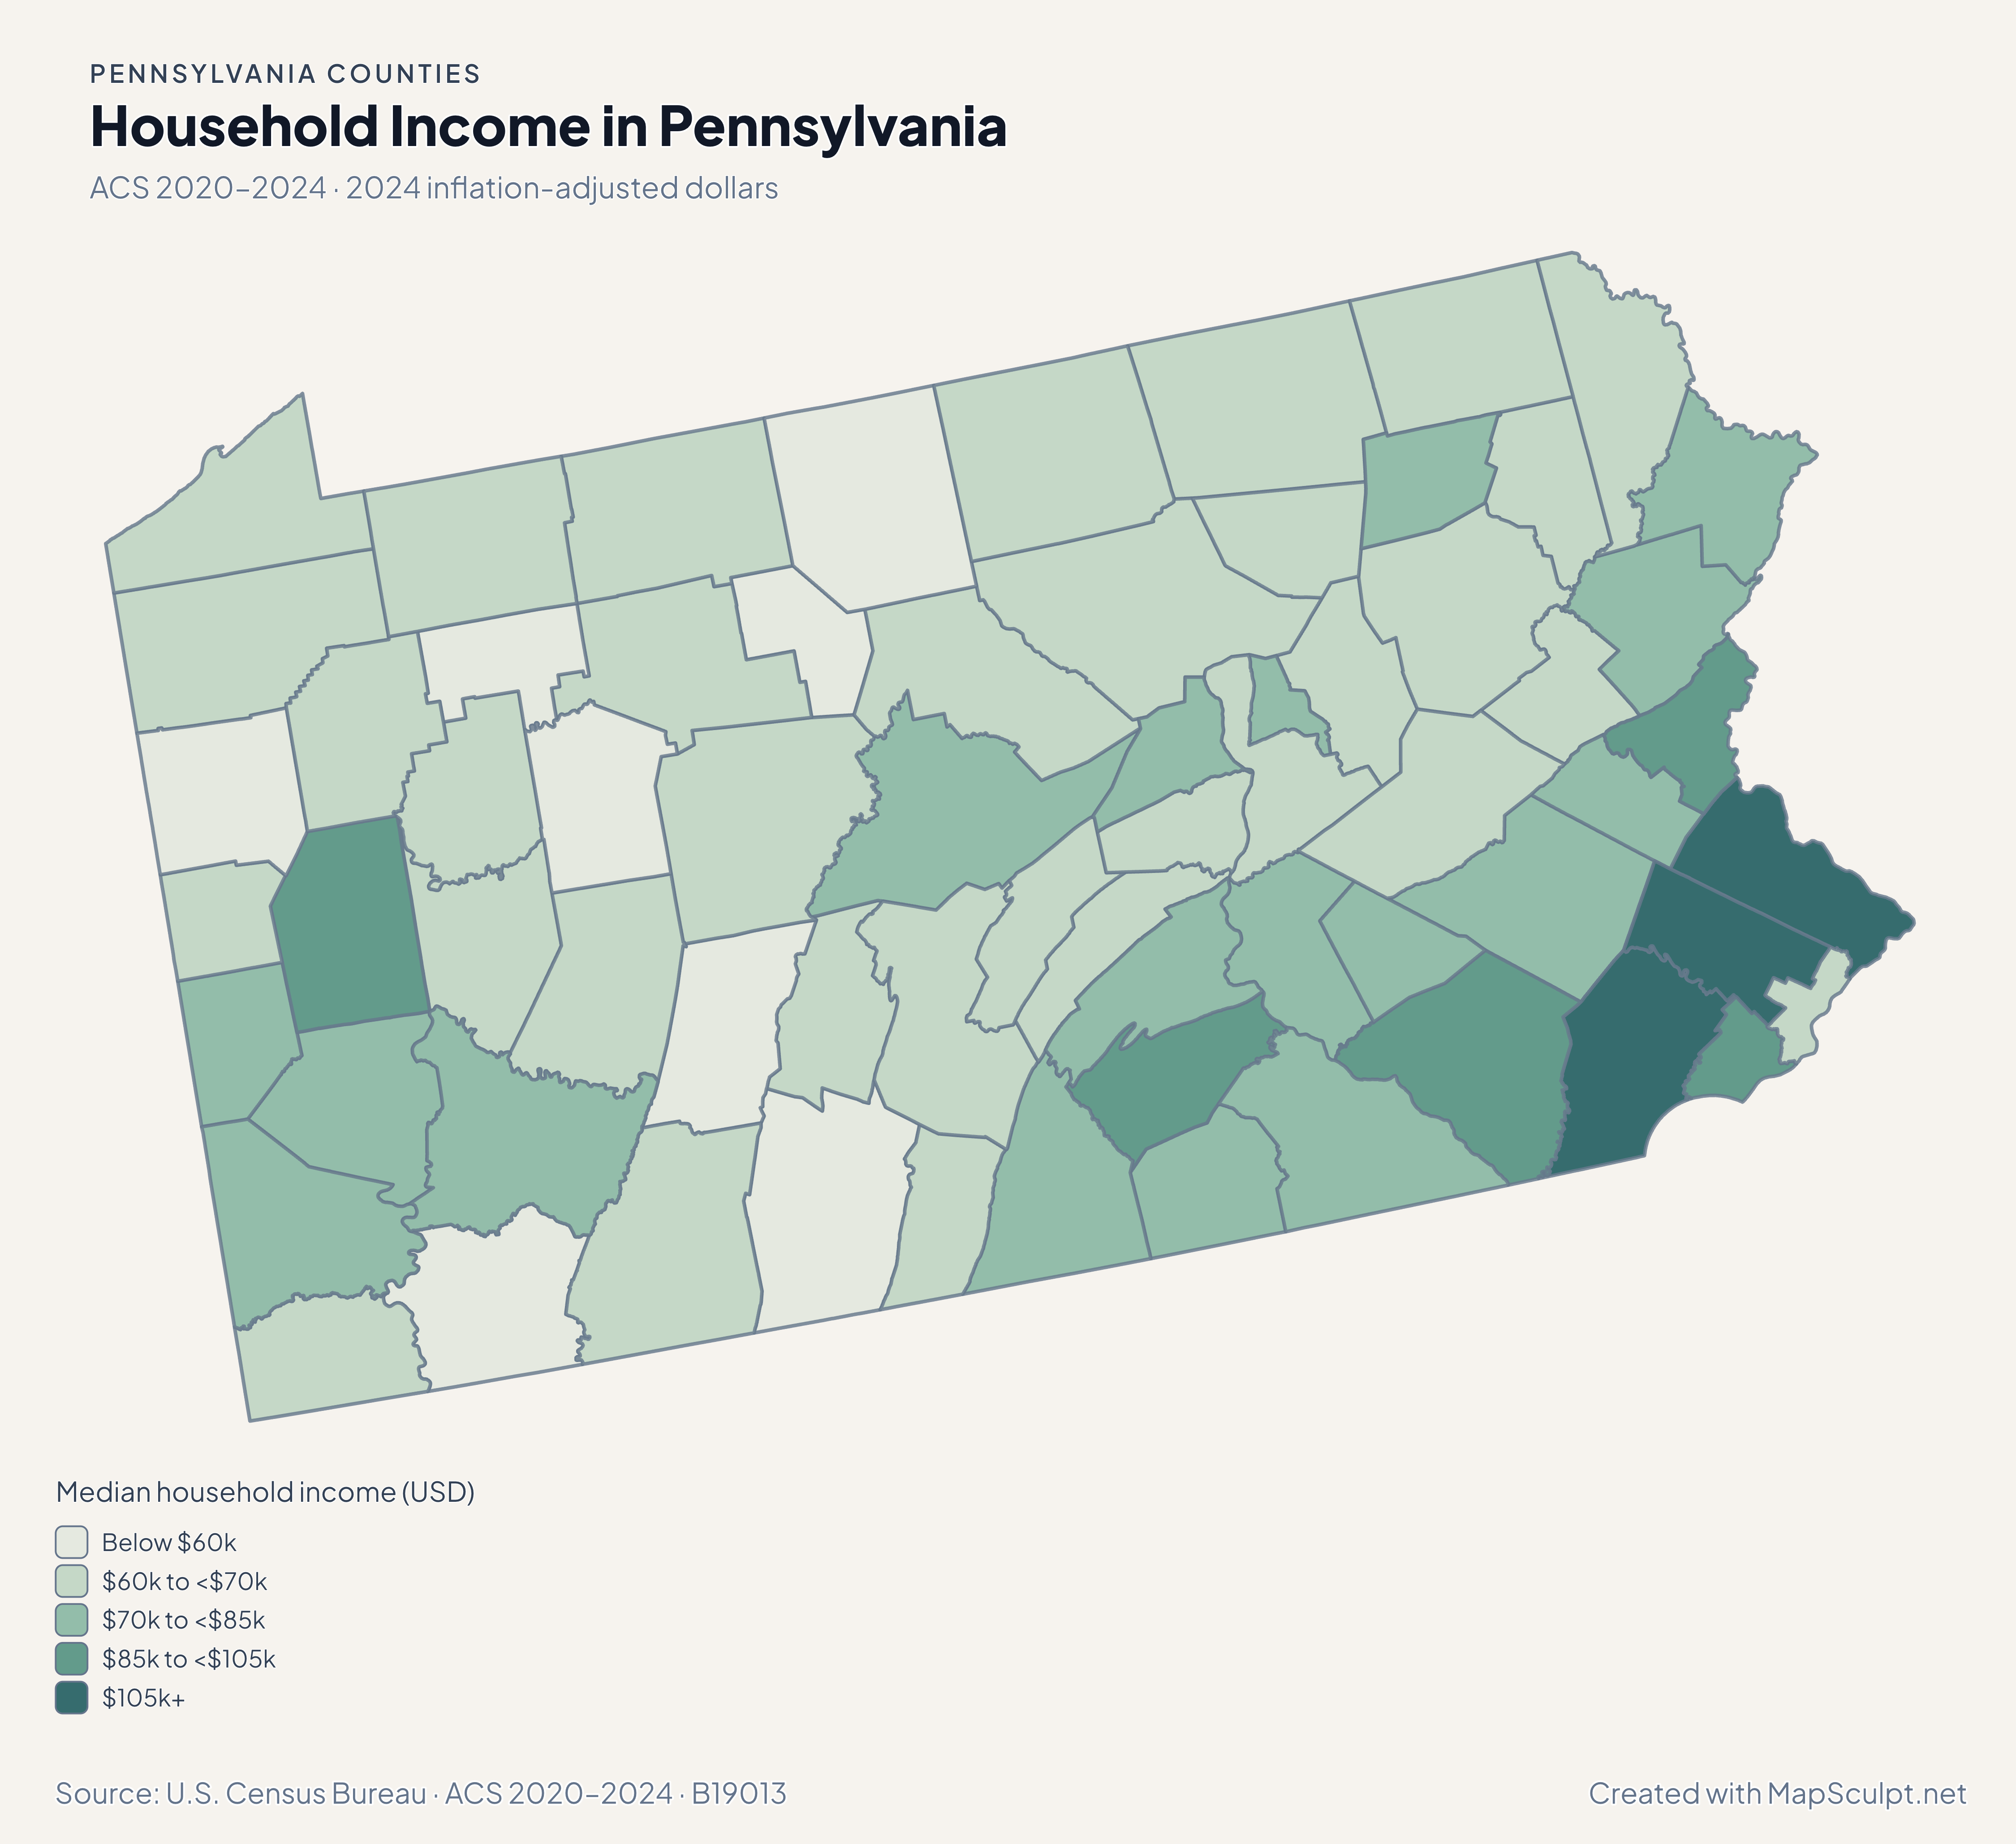
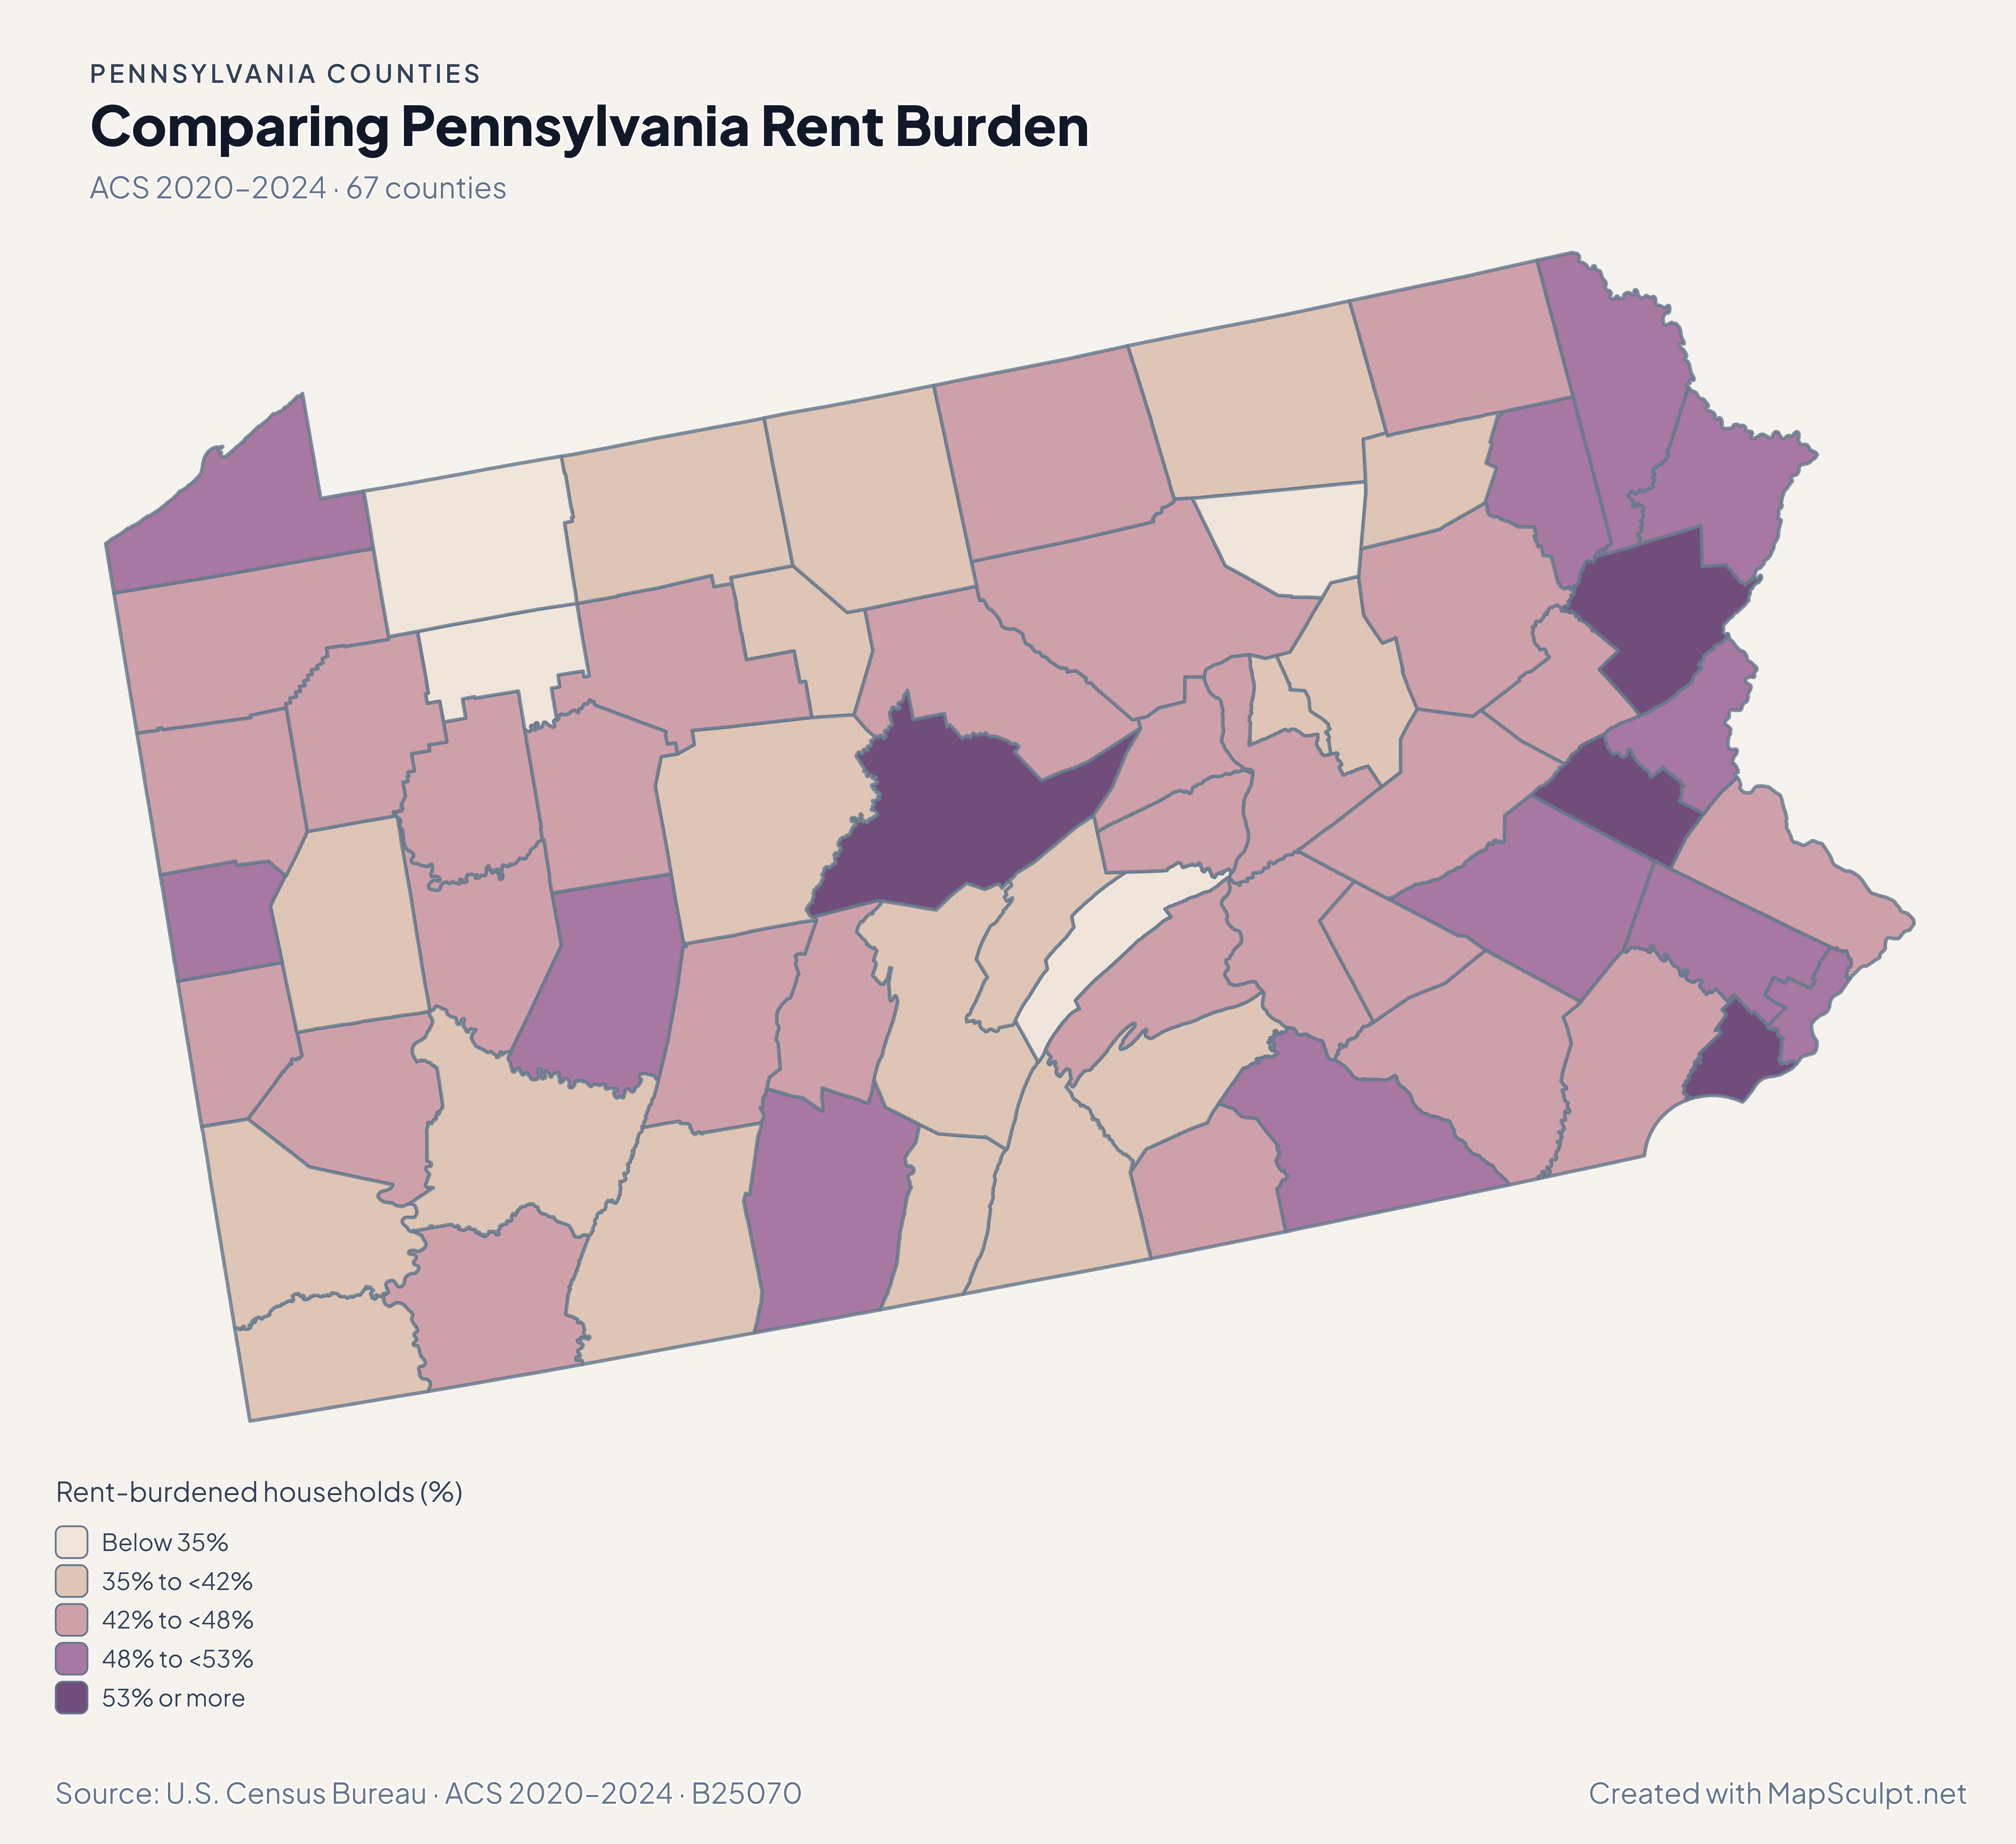
Start with modest population changes across the state, then compare domestic moves, household incomes and renter costs in the same counties.

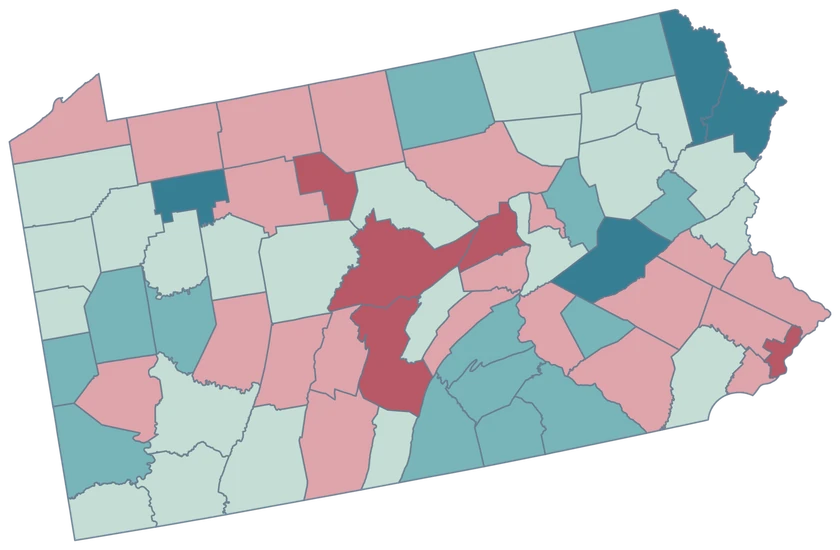
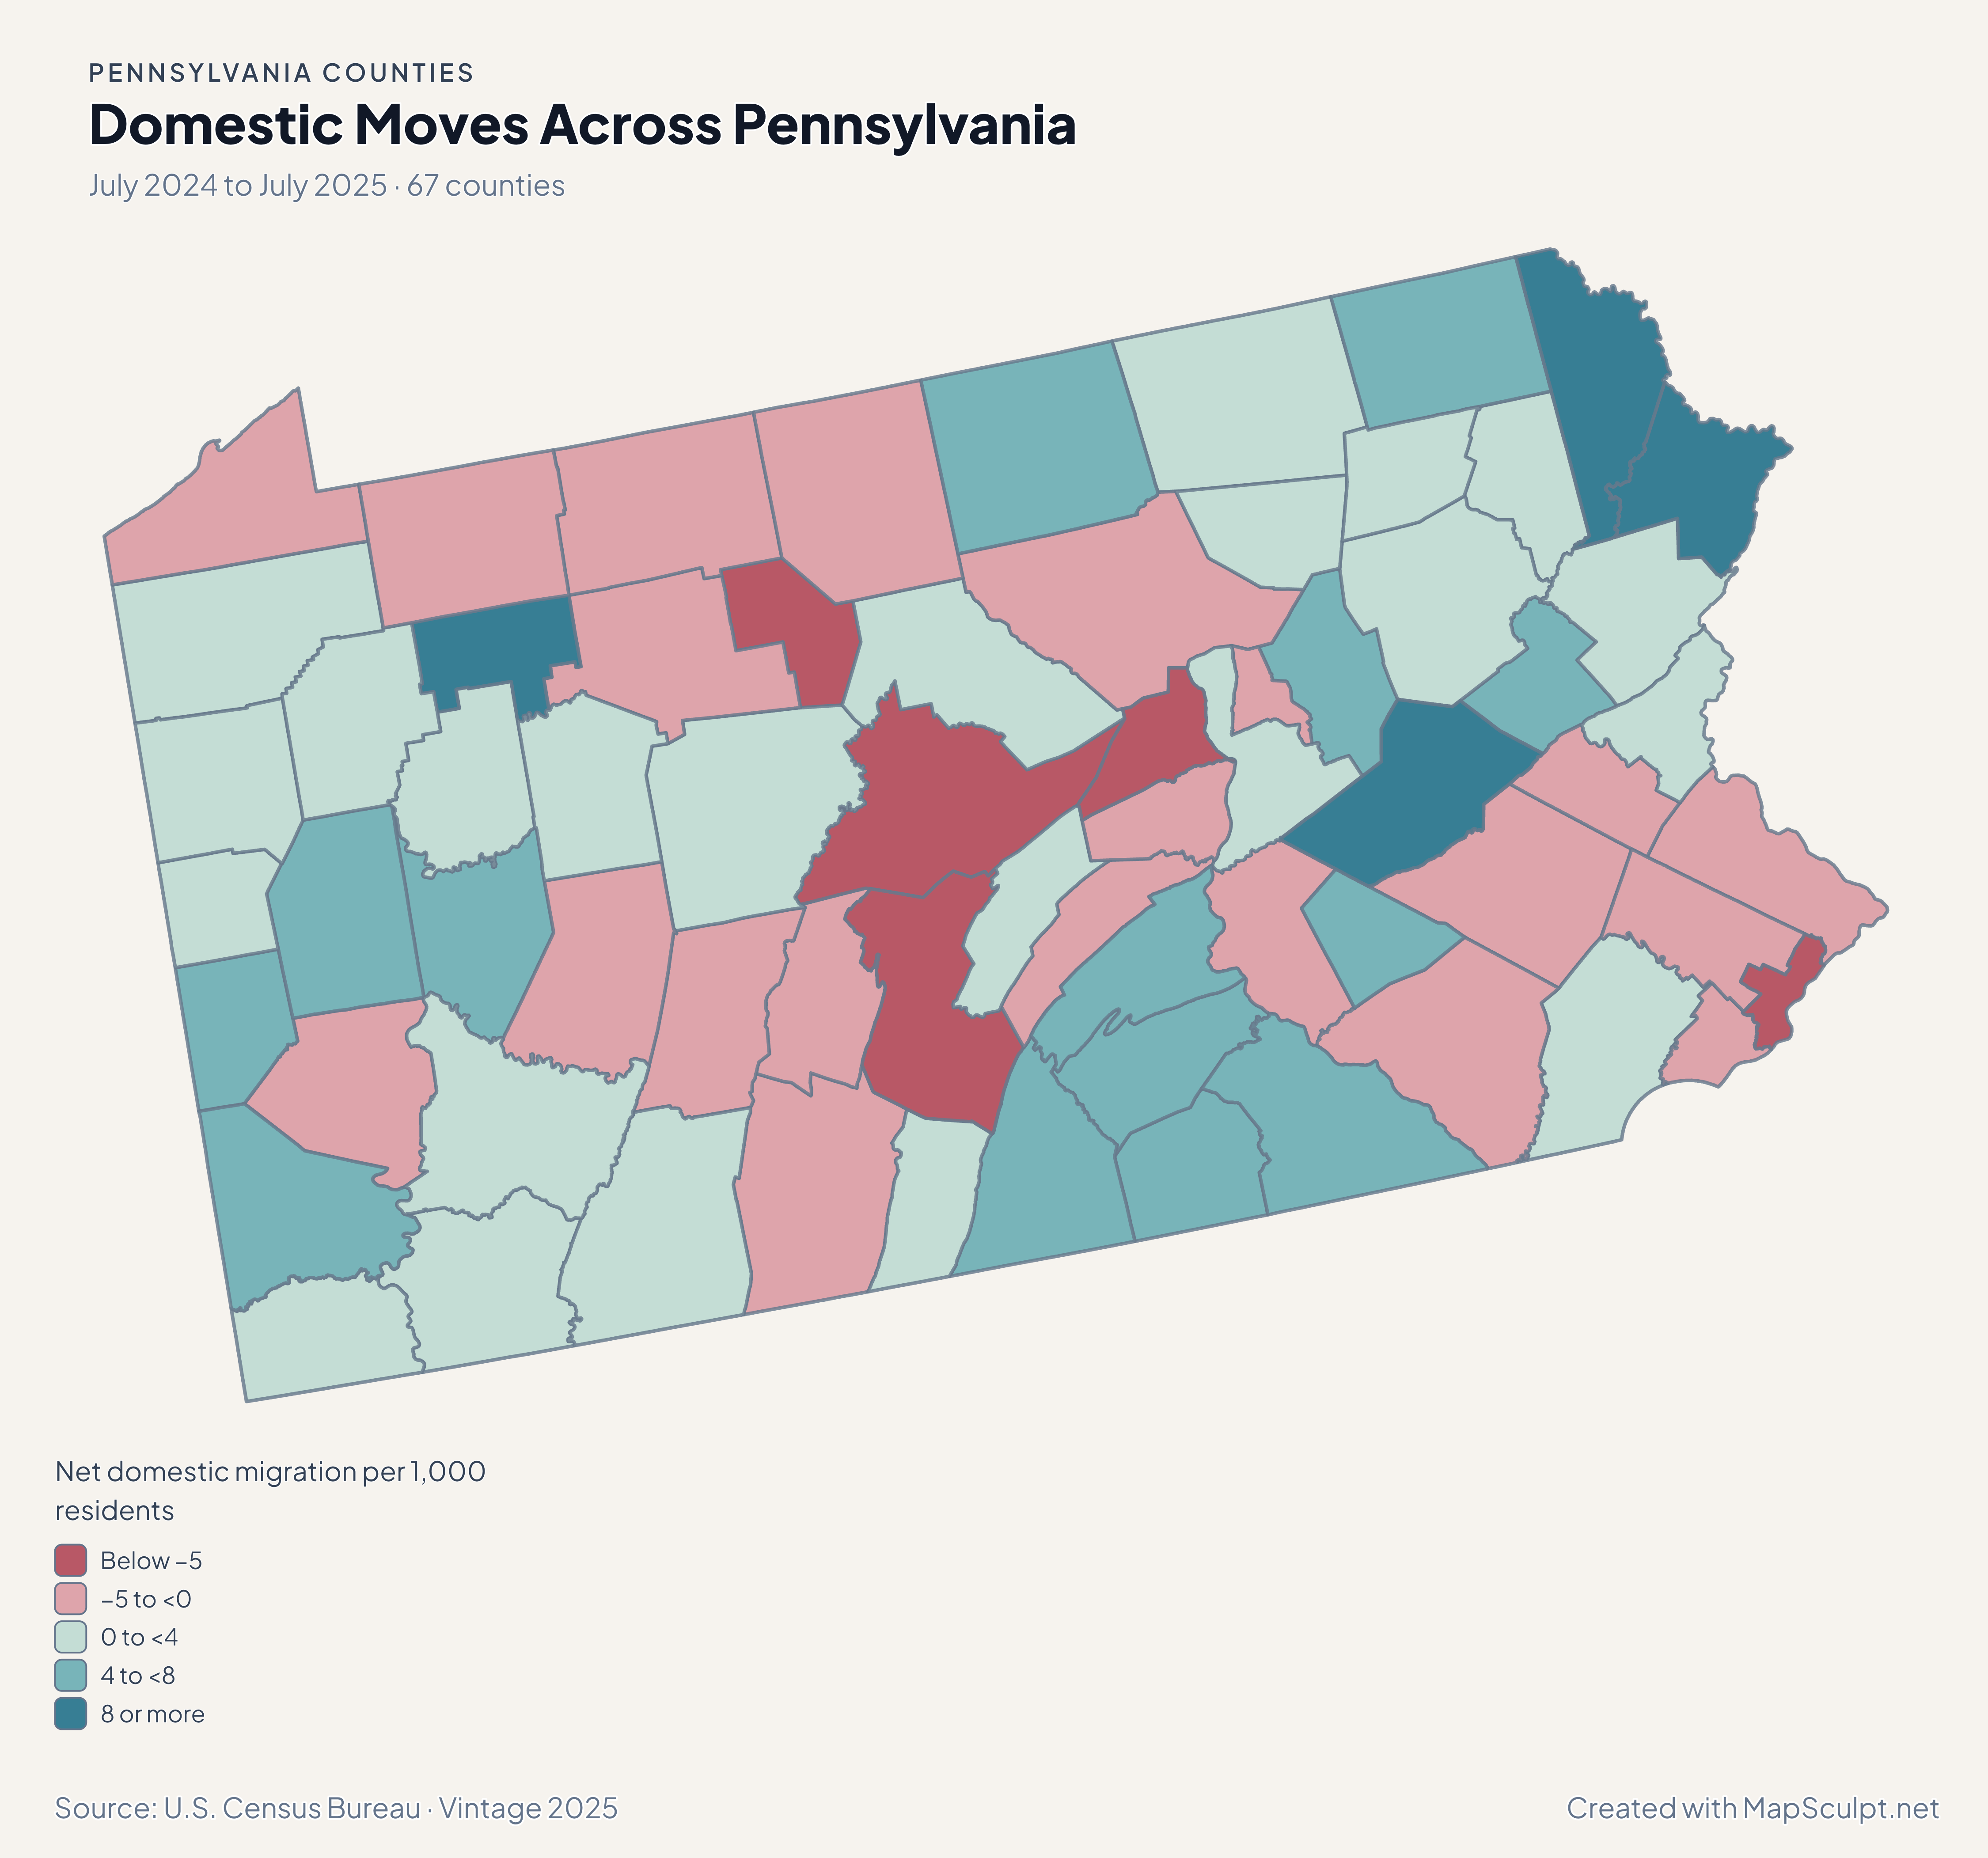
Pennsylvania net domestic migration map with Pike in a high-gain band and Philadelphia in a loss band.

July 2024 to July 2025 · 67 counties

Pike and Philadelphia had different domestic-moving patterns.

Pike recorded a net gain of 11.88 domestic movers per 1,000 residents, while Philadelphia lost 6.18 per 1,000. The values describe moves within the United States and use average population over the two July estimates.

Net domestic migration per 1,000 residents

  • Below −5
  • −5 to <0
  • 0 to <4
  • 4 to <8
  • 8 or more

U.S. Census Bureau · Vintage 2025

Download complete PNG

Thirty counties grew between July 2024 and July 2025 and 37 declined. Cumberland had the highest percentage growth at 0.95%. Philadelphia gained 0.10% while its net domestic migration rate was −6.18 per 1,000 residents. Births, deaths and international moves also affect total growth. See the Census estimates ↗

MAKE IT YOURS

From county data to a finished map.

  1. Open the Pennsylvania editor

    Start with the 67 official county features.

  2. Match county GEOIDs

    Use a dedicated five-digit county column, such as 42101 for Philadelphia County.

  3. Build a readable legend

    Choose class breaks that fit your measure and write the period and units beside the map.

  4. Export the finished map

    Check the full composition, then download a high-resolution PNG with your title and source.

TRY CSV IMPORT

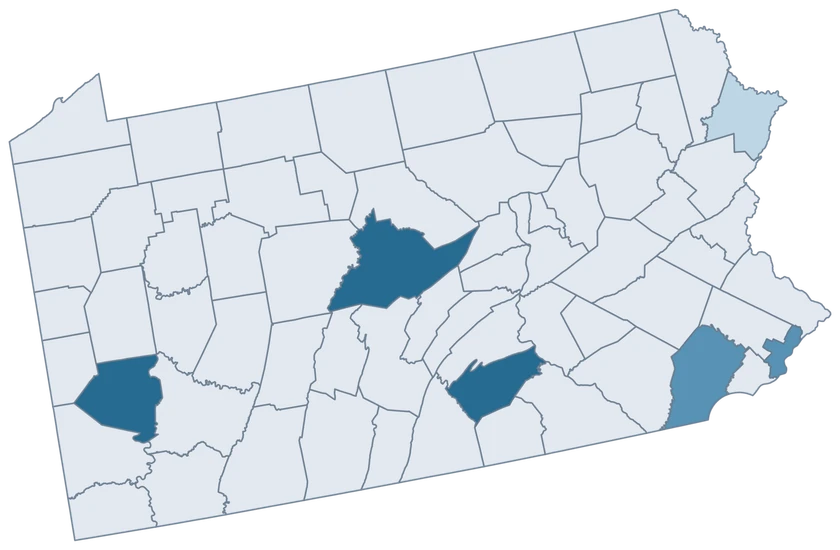
Practice with six Pennsylvania counties.

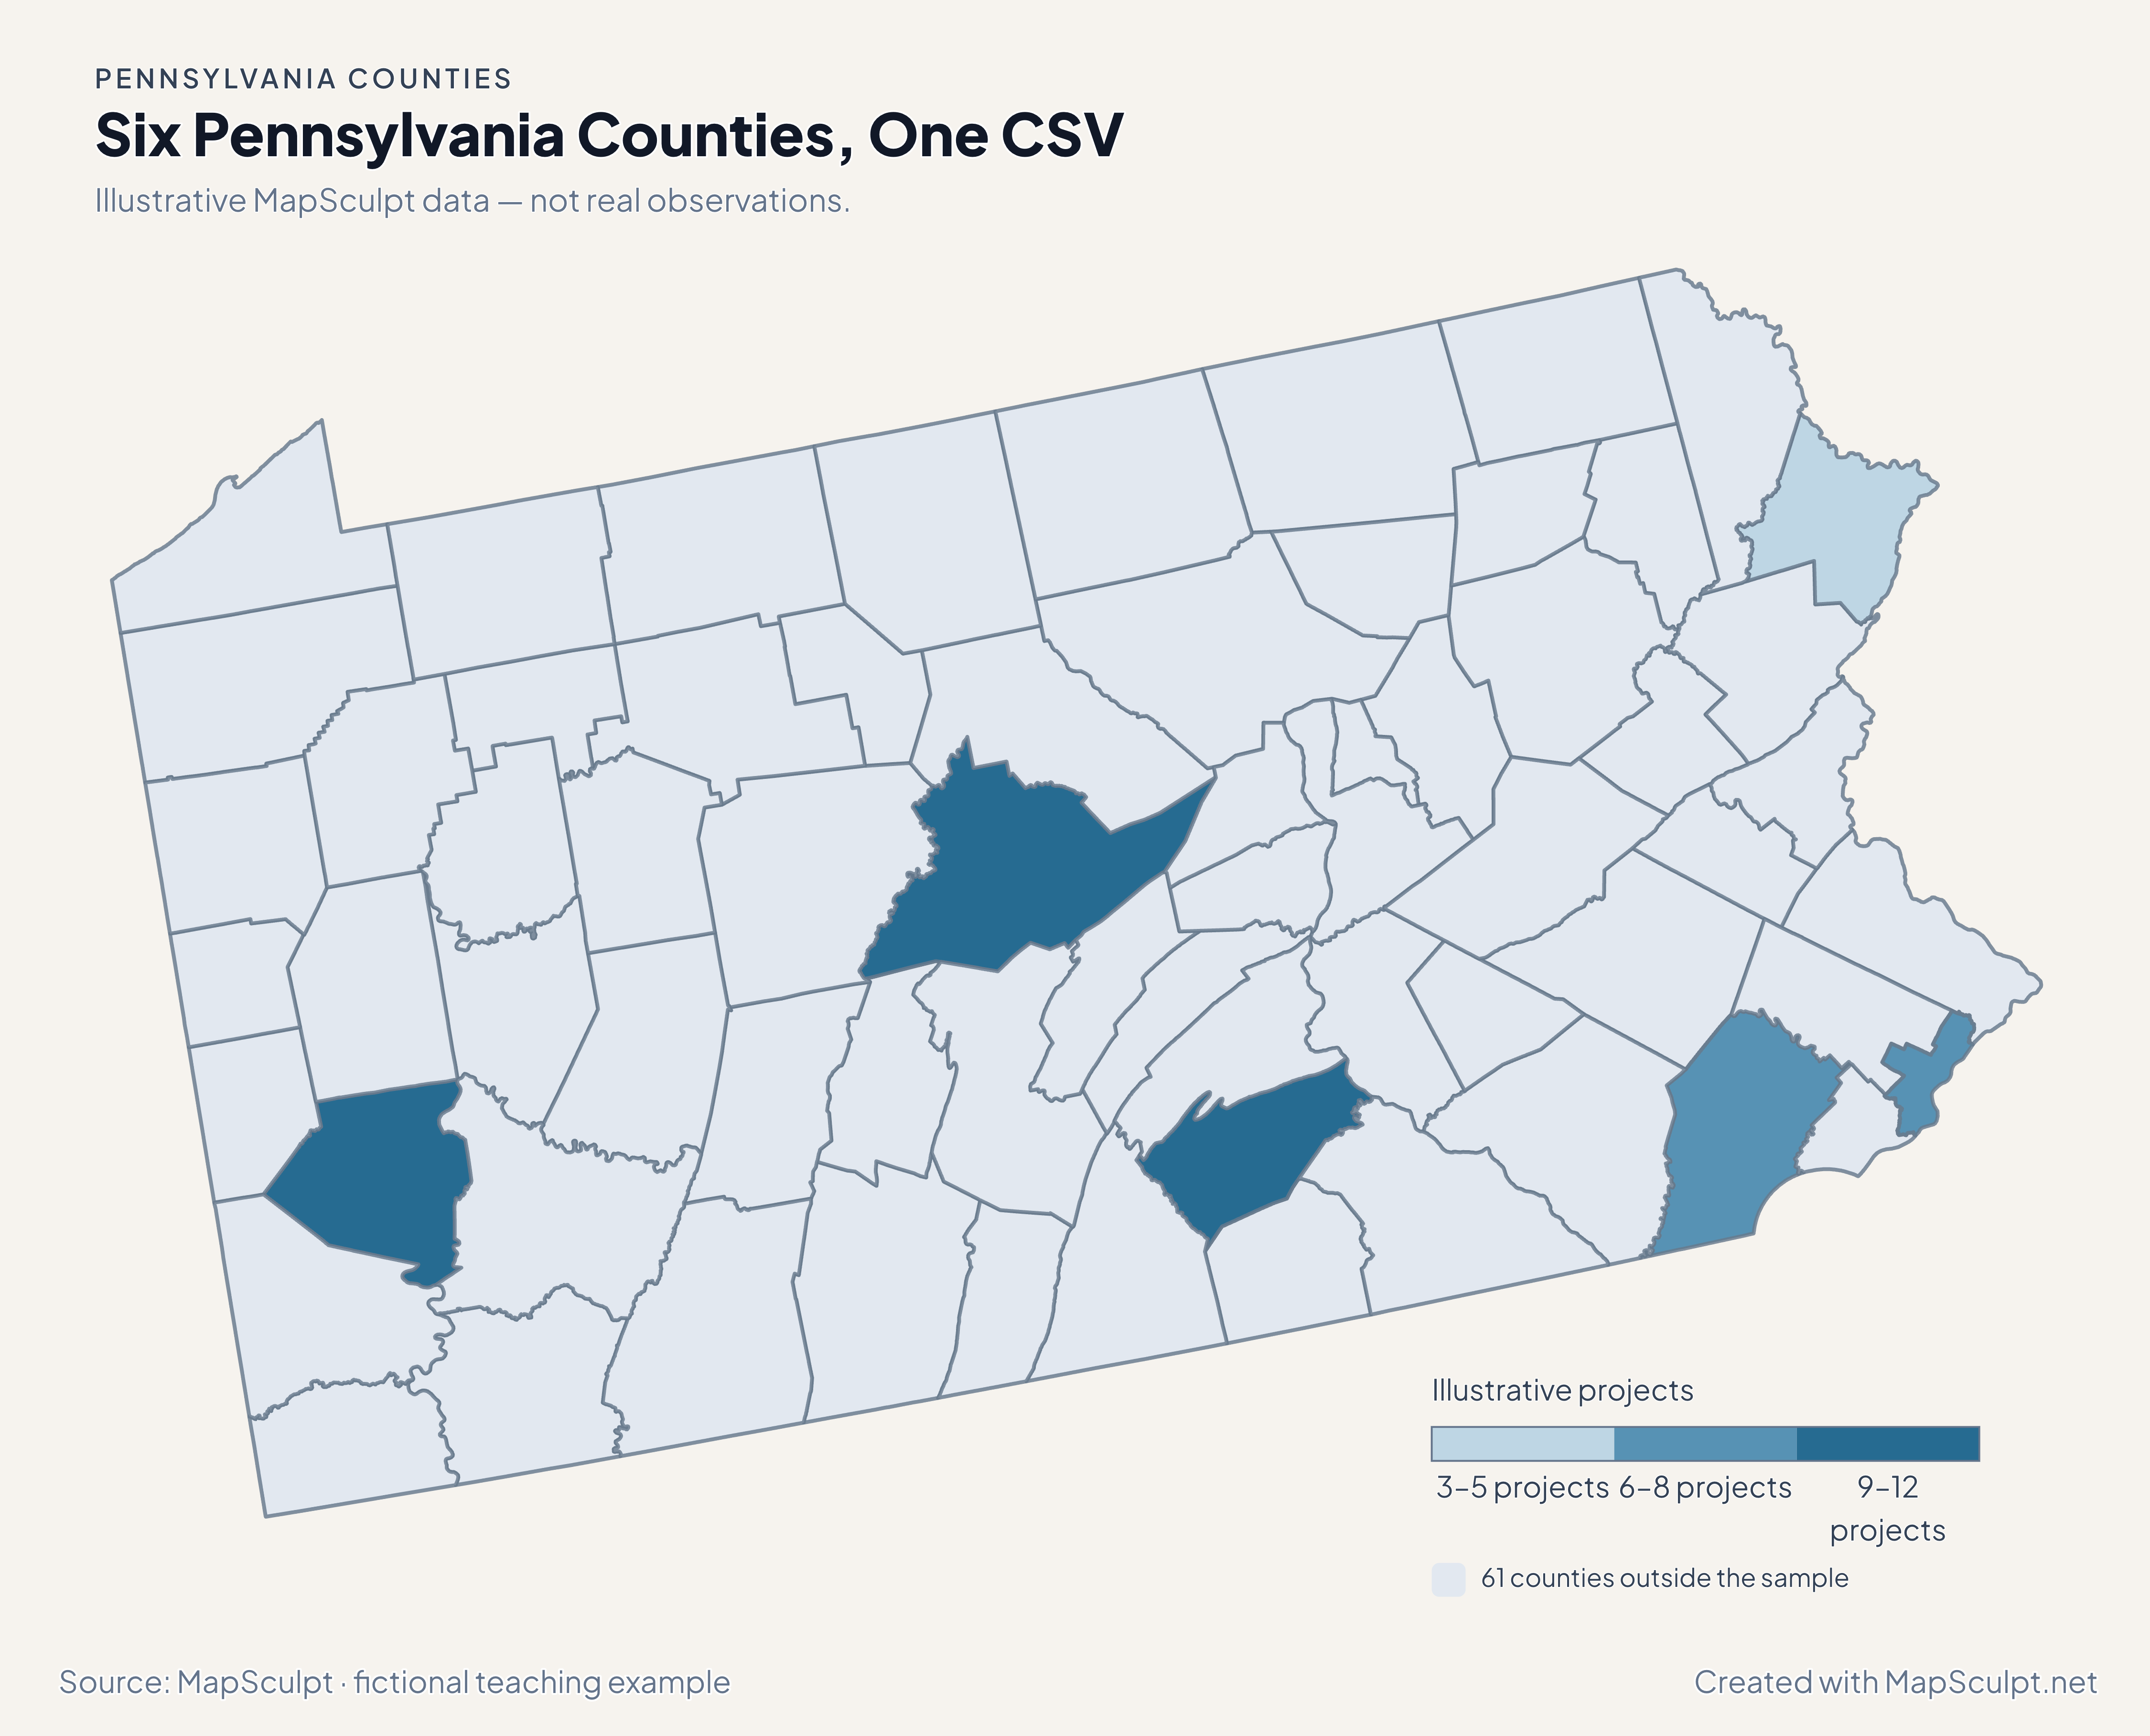
Import the fictional project counts, choose IllustrativeProjects and set numeric boundaries of 3, 6, 9 and 12. The 61 counties outside the sample share a neutral fill.

Illustrative MapSculpt data — not real observations.
CountyGEOIDProjects
Philadelphia County421018
Allegheny County4200312
Cumberland County420419
Chester County420296
Pike County421033
Centre County4202711

Keep GEOIDs as text. In this sample Philadelphia County is 42101 and Centre County is 42027. Use the directory when preparing a larger county join.

Download illustrative CSV ↓

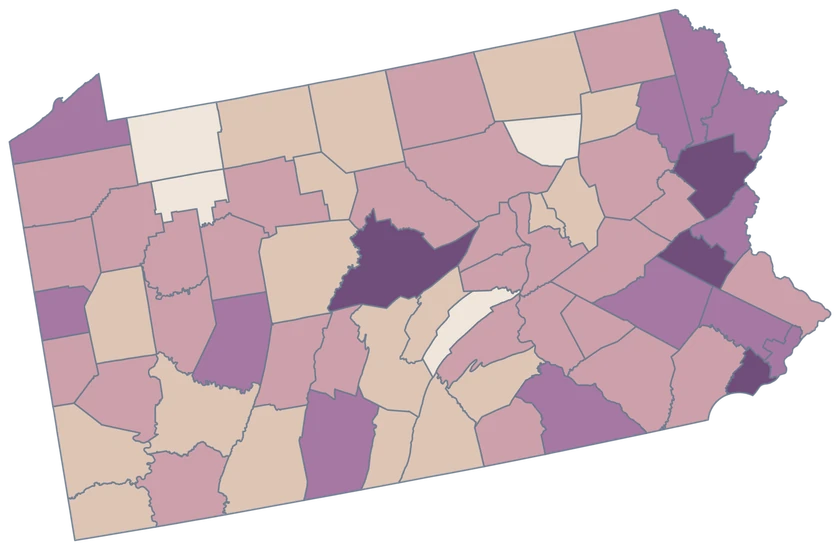
Six Pennsylvania Counties, One CSV

Illustrative MapSculpt data — not real observations.

Illustrative Pennsylvania map highlighting six sampled counties, with the remaining 61 counties in a neutral shade.

Illustrative projects

  • 3–5 projects
  • 6–8 projects
  • 9–12 projects
  • 61 counties outside the sample
Download complete PNG

CSV → Match 6 counties → Style → Export PNG Create a Pennsylvania map

COUNTY REFERENCE

Find all 67 Pennsylvania county GEOIDs.

Official county names and five-digit Census GEOIDs. Search by name or code.

  1. Adams CountyGEOID 42001
  2. Allegheny CountyGEOID 42003
  3. Armstrong CountyGEOID 42005
  4. Beaver CountyGEOID 42007
  5. Bedford CountyGEOID 42009
  6. Berks CountyGEOID 42011
  7. Blair CountyGEOID 42013
  8. Bradford CountyGEOID 42015
  9. Bucks CountyGEOID 42017
  10. Butler CountyGEOID 42019
  11. Cambria CountyGEOID 42021
  12. Cameron CountyGEOID 42023
  13. Carbon CountyGEOID 42025
  14. Centre CountyGEOID 42027
  15. Chester CountyGEOID 42029
  16. Clarion CountyGEOID 42031
  17. Clearfield CountyGEOID 42033
  18. Clinton CountyGEOID 42035
  19. Columbia CountyGEOID 42037
  20. Crawford CountyGEOID 42039
  21. Cumberland CountyGEOID 42041
  22. Dauphin CountyGEOID 42043
  23. Delaware CountyGEOID 42045
  24. Elk CountyGEOID 42047
  25. Erie CountyGEOID 42049
  26. Fayette CountyGEOID 42051
  27. Forest CountyGEOID 42053
  28. Franklin CountyGEOID 42055
  29. Fulton CountyGEOID 42057
  30. Greene CountyGEOID 42059
  31. Huntingdon CountyGEOID 42061
  32. Indiana CountyGEOID 42063
  33. Jefferson CountyGEOID 42065
  34. Juniata CountyGEOID 42067
  35. Lackawanna CountyGEOID 42069
  36. Lancaster CountyGEOID 42071
  37. Lawrence CountyGEOID 42073
  38. Lebanon CountyGEOID 42075
  39. Lehigh CountyGEOID 42077
  40. Luzerne CountyGEOID 42079
  41. Lycoming CountyGEOID 42081
  42. McKean CountyGEOID 42083
  43. Mercer CountyGEOID 42085
  44. Mifflin CountyGEOID 42087
  45. Monroe CountyGEOID 42089
  46. Montgomery CountyGEOID 42091
  47. Montour CountyGEOID 42093
  48. Northampton CountyGEOID 42095
  49. Northumberland CountyGEOID 42097
  50. Perry CountyGEOID 42099
  51. Philadelphia CountyGEOID 42101
  52. Pike CountyGEOID 42103
  53. Potter CountyGEOID 42105
  54. Schuylkill CountyGEOID 42107
  55. Snyder CountyGEOID 42109
  56. Somerset CountyGEOID 42111
  57. Sullivan CountyGEOID 42113
  58. Susquehanna CountyGEOID 42115
  59. Tioga CountyGEOID 42117
  60. Union CountyGEOID 42119
  61. Venango CountyGEOID 42121
  62. Warren CountyGEOID 42123
  63. Washington CountyGEOID 42125
  64. Wayne CountyGEOID 42127
  65. Westmoreland CountyGEOID 42129
  66. Wyoming CountyGEOID 42131
  67. York CountyGEOID 42133

U.S. Census Bureau · 2025 Cartographic Boundary Files

COMMON QUESTIONS

Pennsylvania county map questions.

Can I map Pennsylvania townships here?

This editor selects counties. Match county-based records to it, and use a township boundary dataset elsewhere when the township itself is the unit of analysis.

Which county should a Pittsburgh record use?

A county-wide Pittsburgh-area record should use Allegheny County, GEOID 42003, when that is the observation’s actual coverage. City-only counts need a county aggregation before mapping.

Where is Philadelphia in a county CSV?

Use Philadelphia County, GEOID 42101. The editor treats Philadelphia as one county feature.

Why does Philadelphia change colors between the first two maps?

The population map counts total change, and the migration map measures net moves within the United States. Philadelphia was slightly positive on the first measure and negative on the second.

Does the map distinguish Chester County from the city of Chester?

Yes. Chester County is a separate county feature. The city of Chester is in Delaware County and has no independent selection on this map.

How do I map data from the Delaware River corridor?

Join comparable values to the counties they cover. Use the national U.S. county editor for a single map that also includes counties on the New Jersey side.

YOUR NEXT MAP STARTS HERE

Tell a Pennsylvania story county by county.

Map a regional comparison, a river corridor or a statewide dataset. Join values by GEOID and export the finished county view.

Create a Pennsylvania map