Skip to content
MapSculpt

GEOGRAPHIC MAP MAKER / DELAWARE

Delaware
Counties Map Maker

Map Kent, New Castle and Sussex individually. Compare how all three counties grew while domestic moves followed different patterns from the Wilmington area to coastal Sussex.

Free online editor · No sign-up required

3counties
individually editable

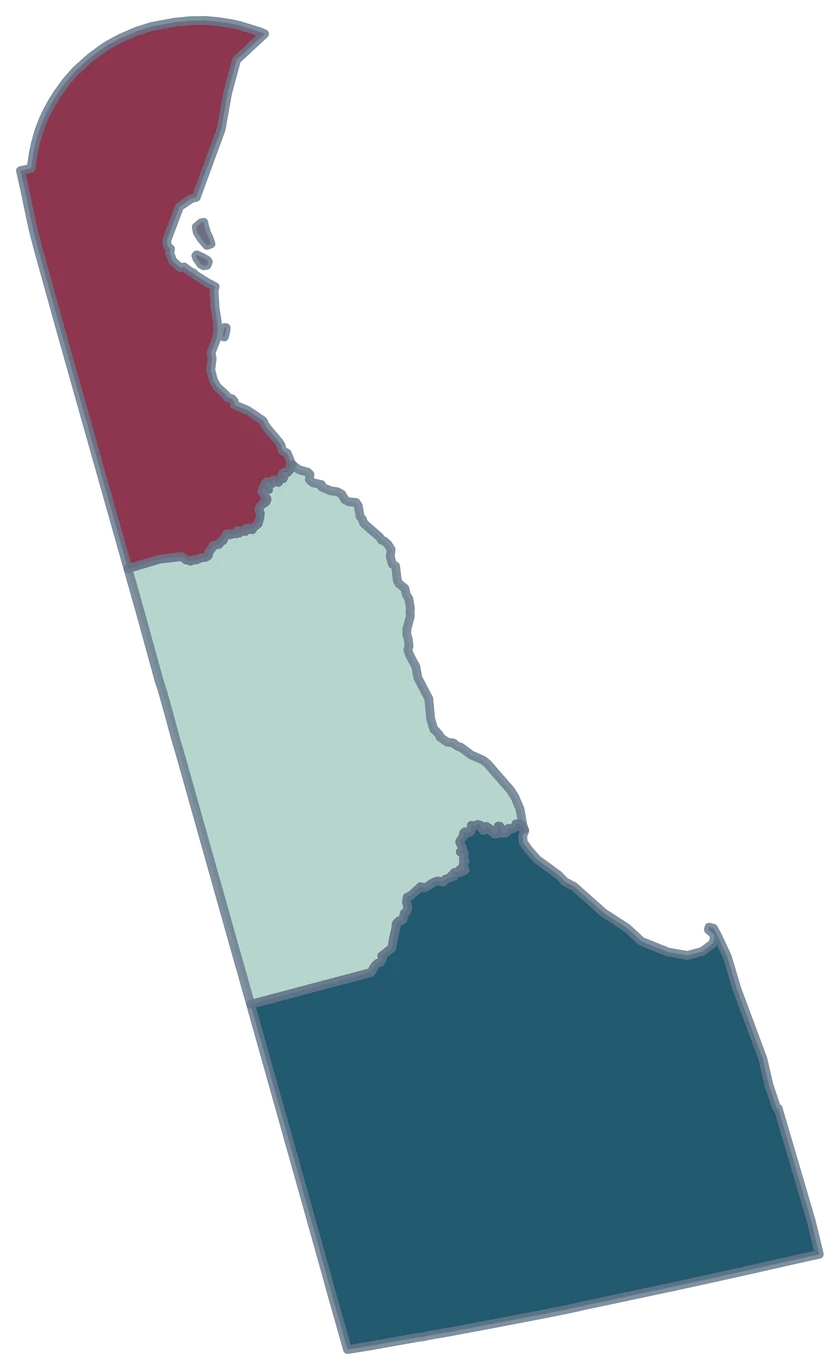
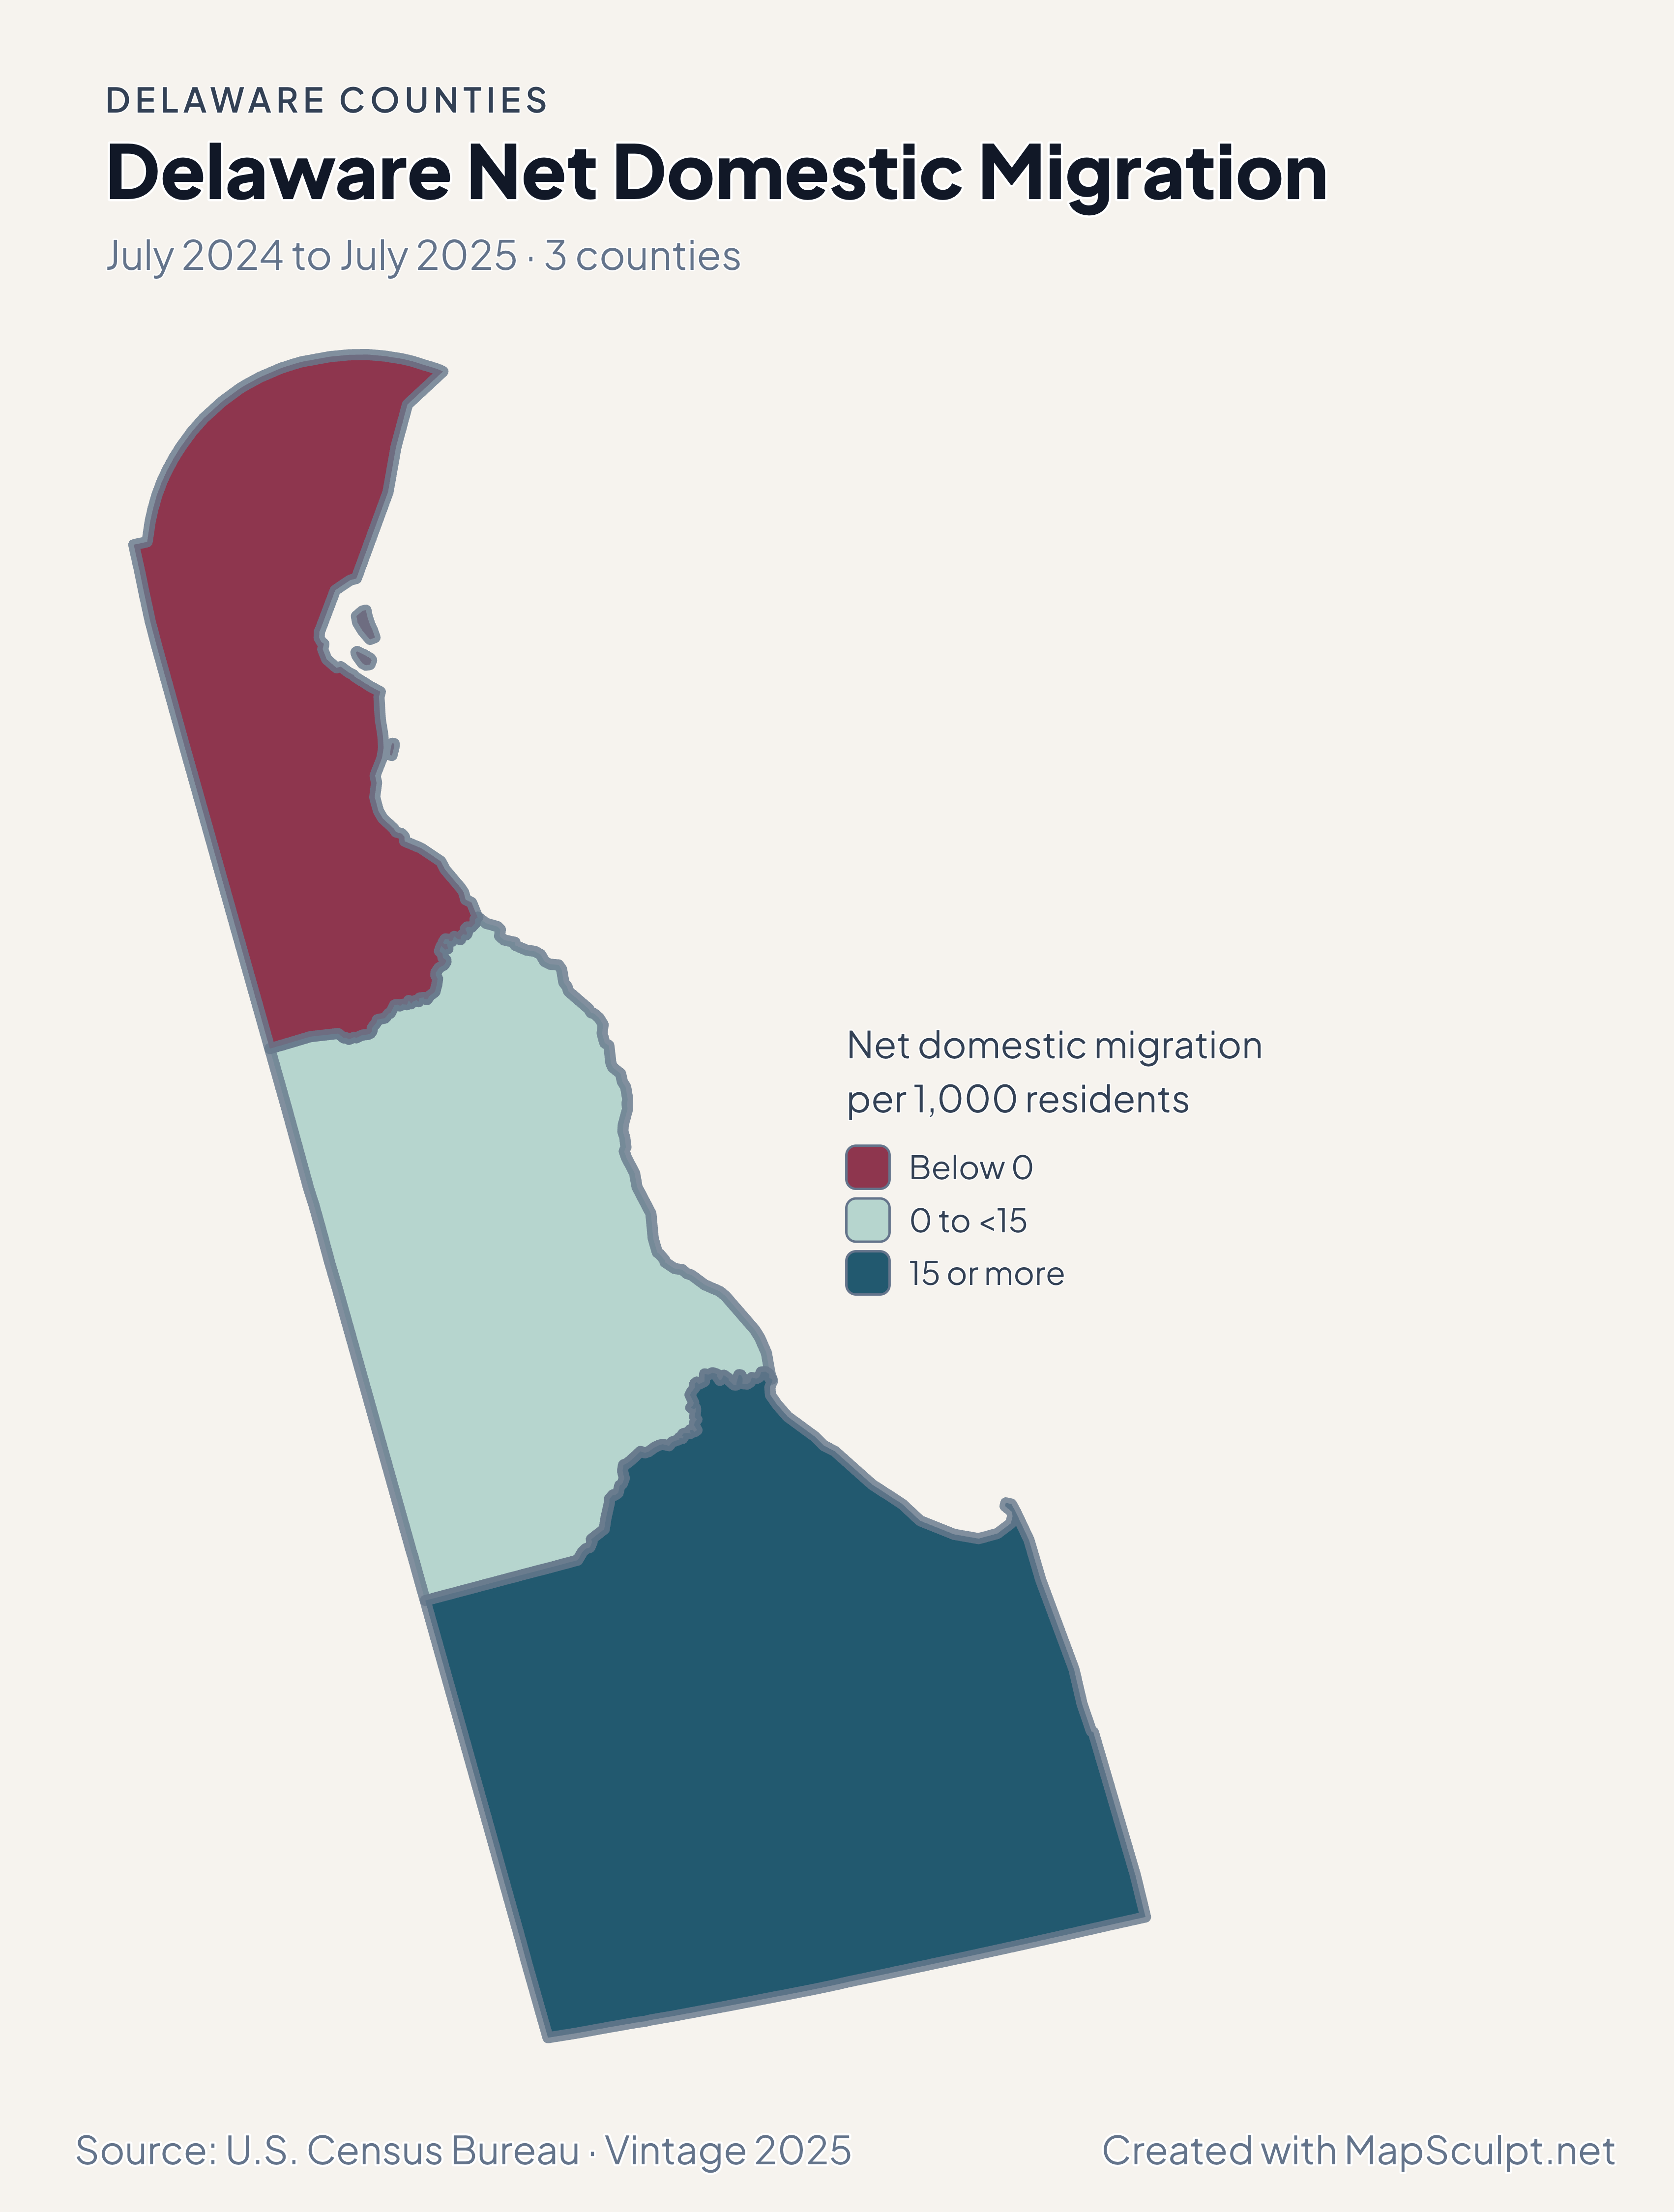
Delaware Net Domestic Migration

July 2024 to July 2025 · 3 counties

Delaware net domestic migration map. A negative domestic migration band in New Castle, a moderate positive band in Kent, and a higher positive band in Sussex.

Net domestic migration per 1,000 residents

  • Below 0
  • 0 to <15
  • 15 or more
U.S. Census Bureau · Vintage 2025Download complete PNG Net domestic moves per 1,000 residents, using average July 2024 and July 2025 populations.

KNOW YOUR GEOGRAPHY

Delaware counties on the Census map

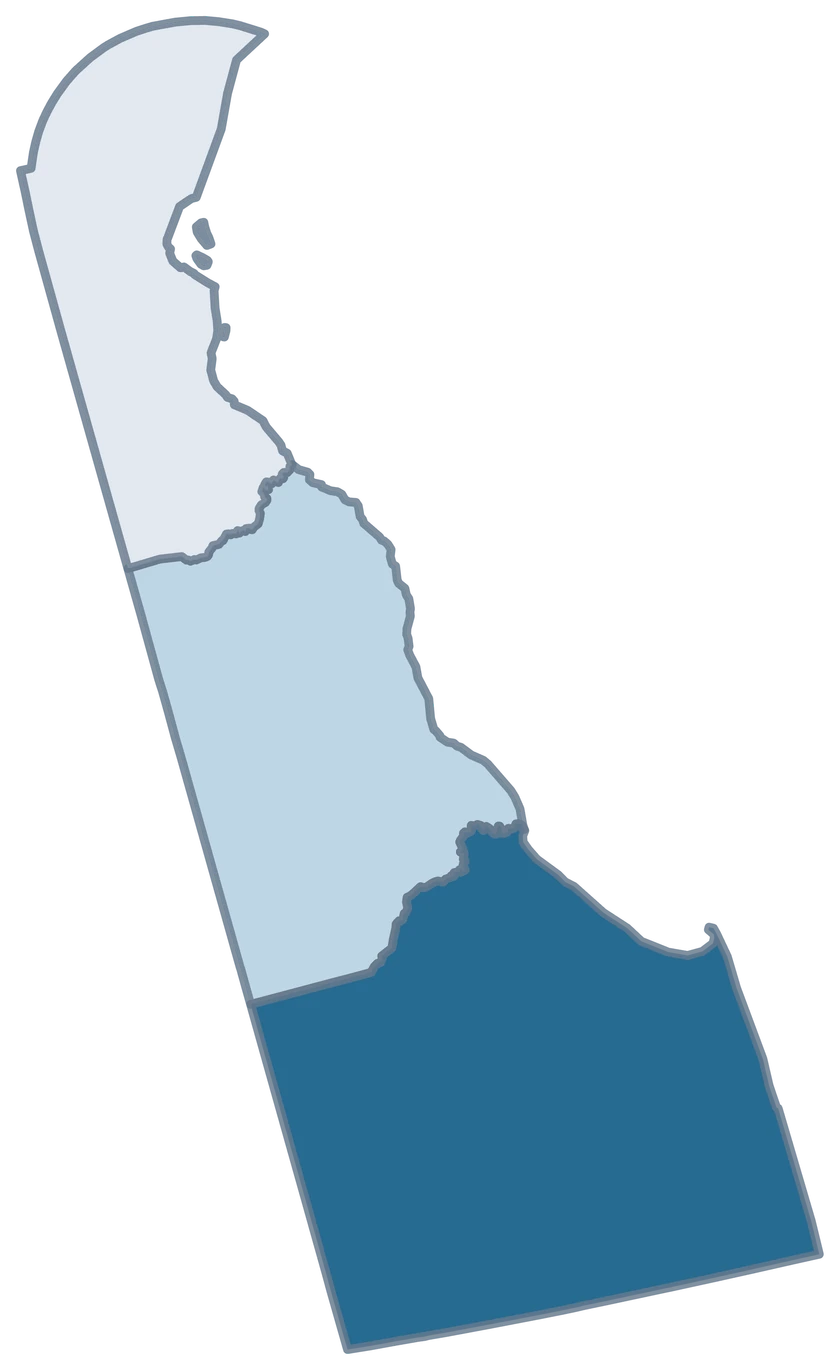
The editor has one selectable shape each for Kent, New Castle and Sussex. The generalized Census boundaries preserve the Delaware Bay and Atlantic edges.

Use New Castle County for a county-level view of the Wilmington area and Kent County for the Dover area. Export the three counties together to show how the coastal Sussex comparison fits the rest of the state.

Browse all county GEOIDs ↗

2025 Census boundaries

OFFICIAL DATA

Domestic movement differed at opposite ends of Delaware

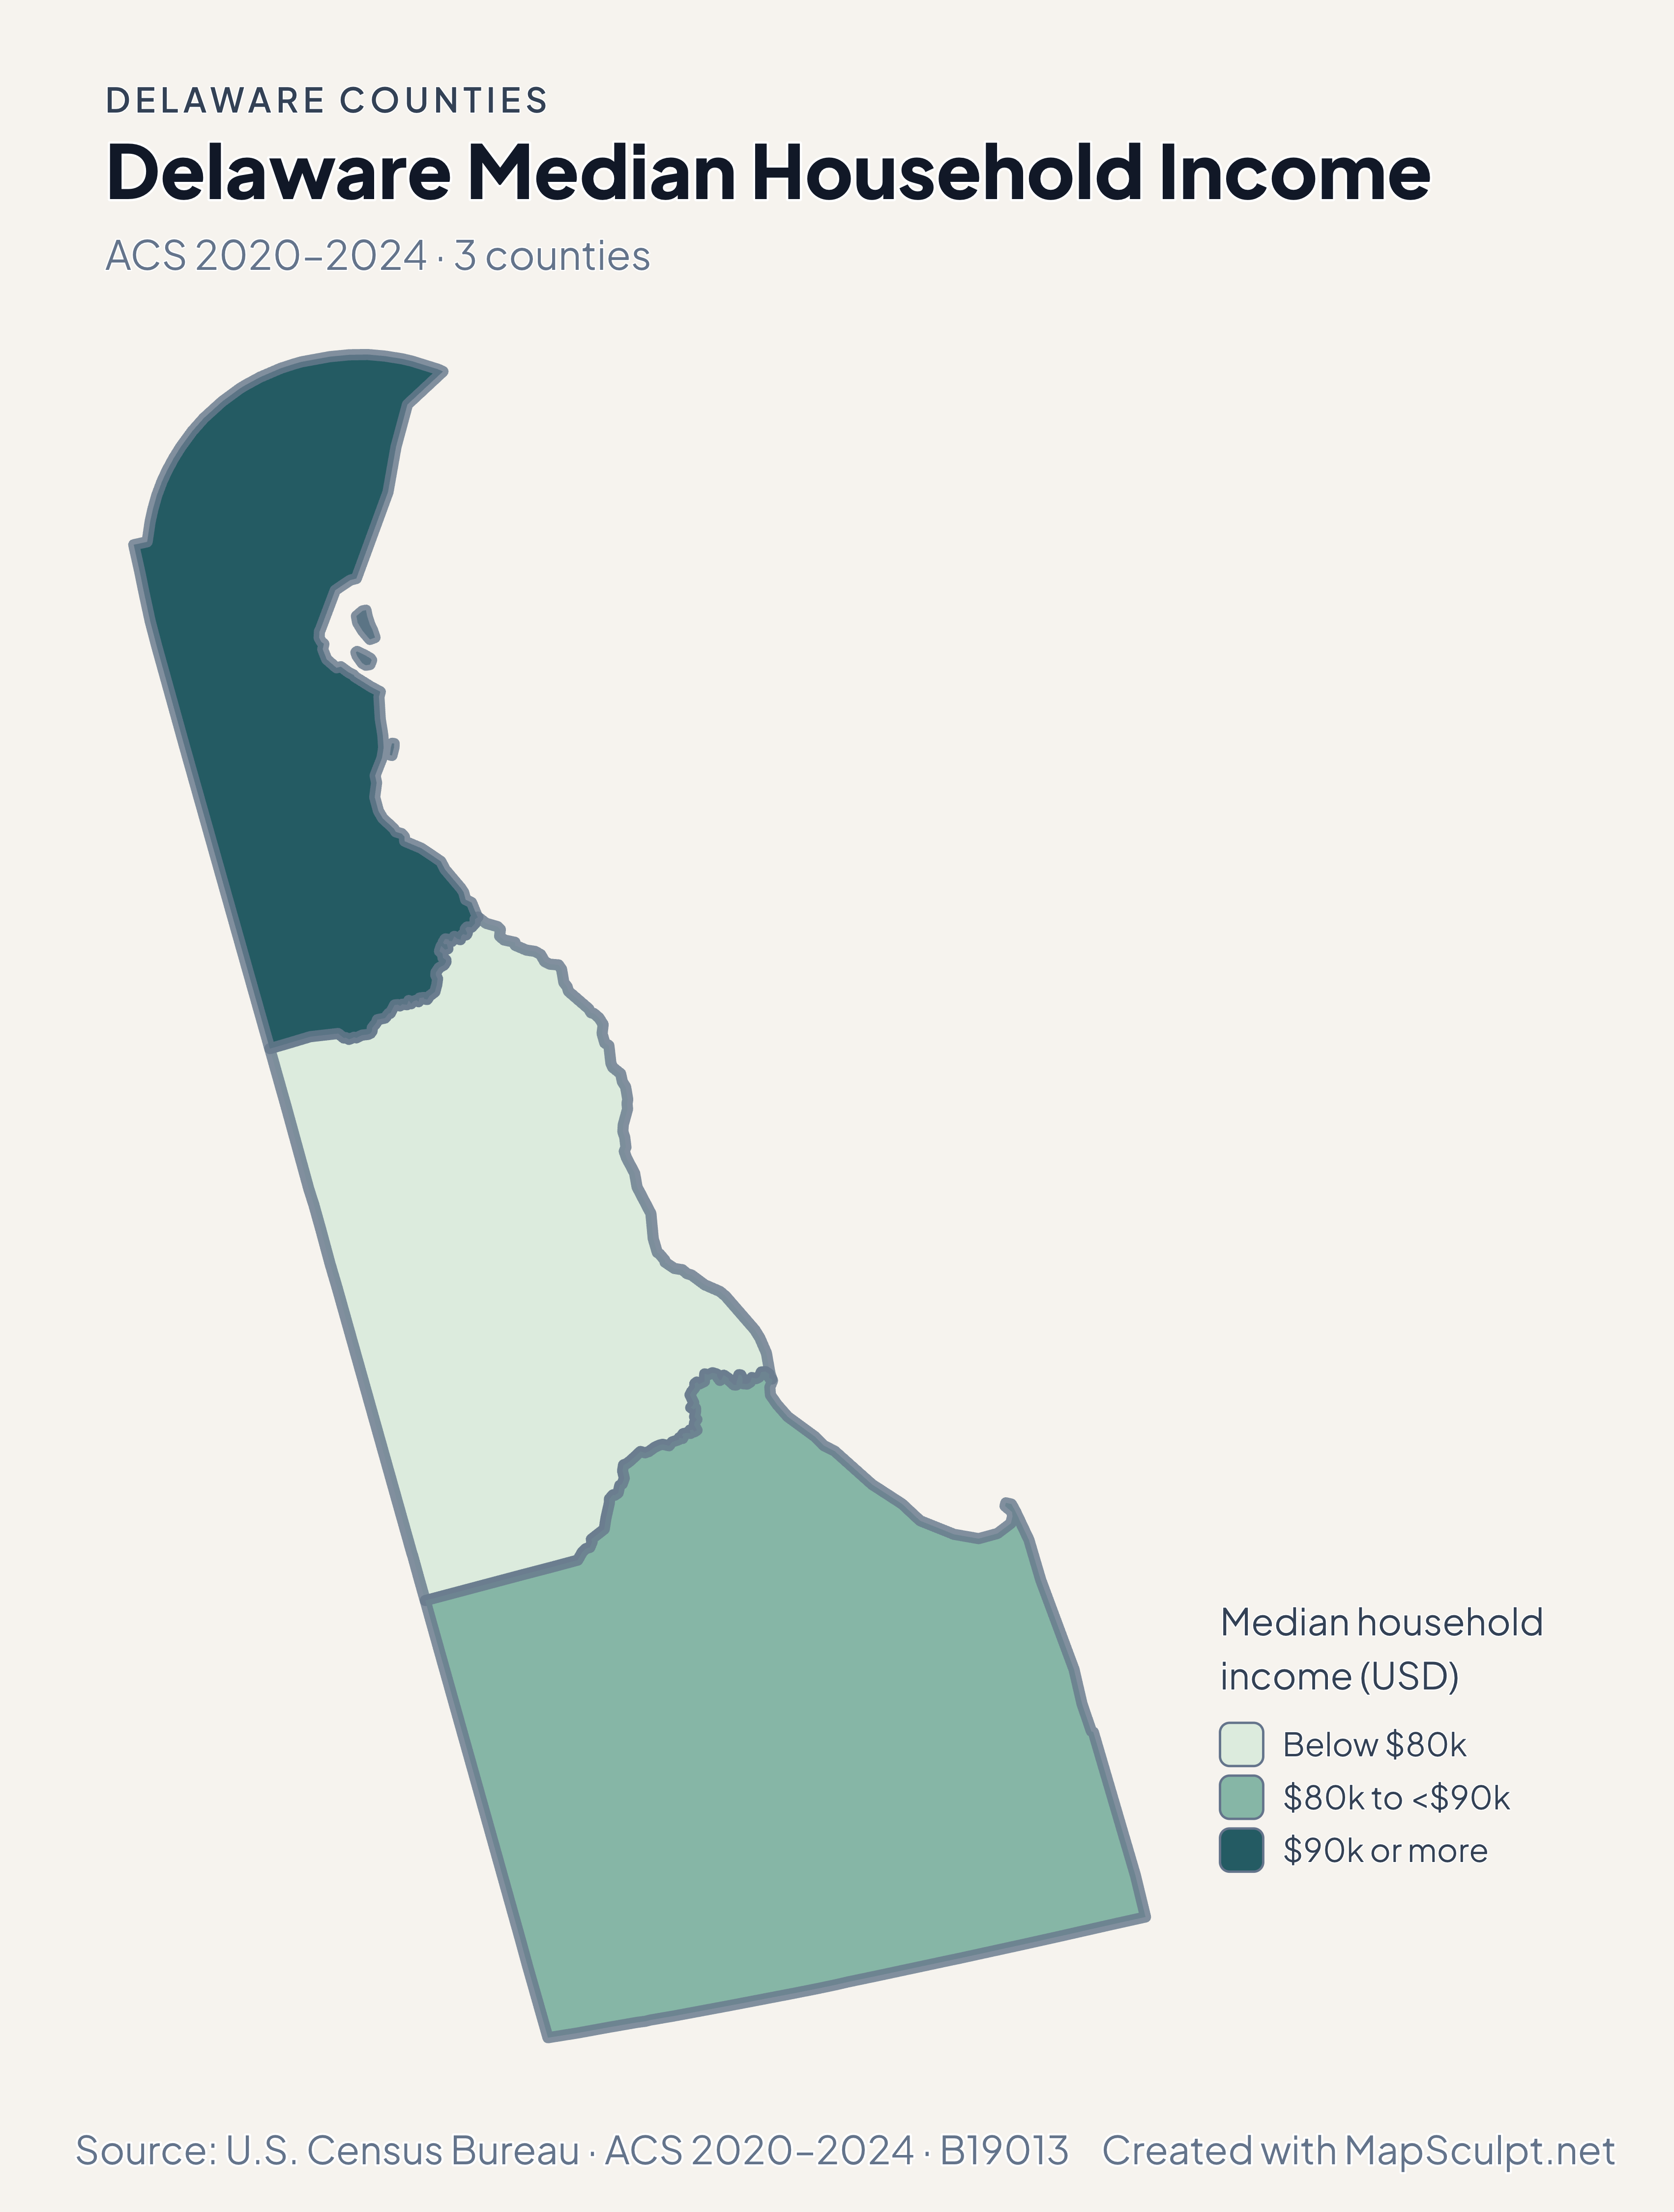
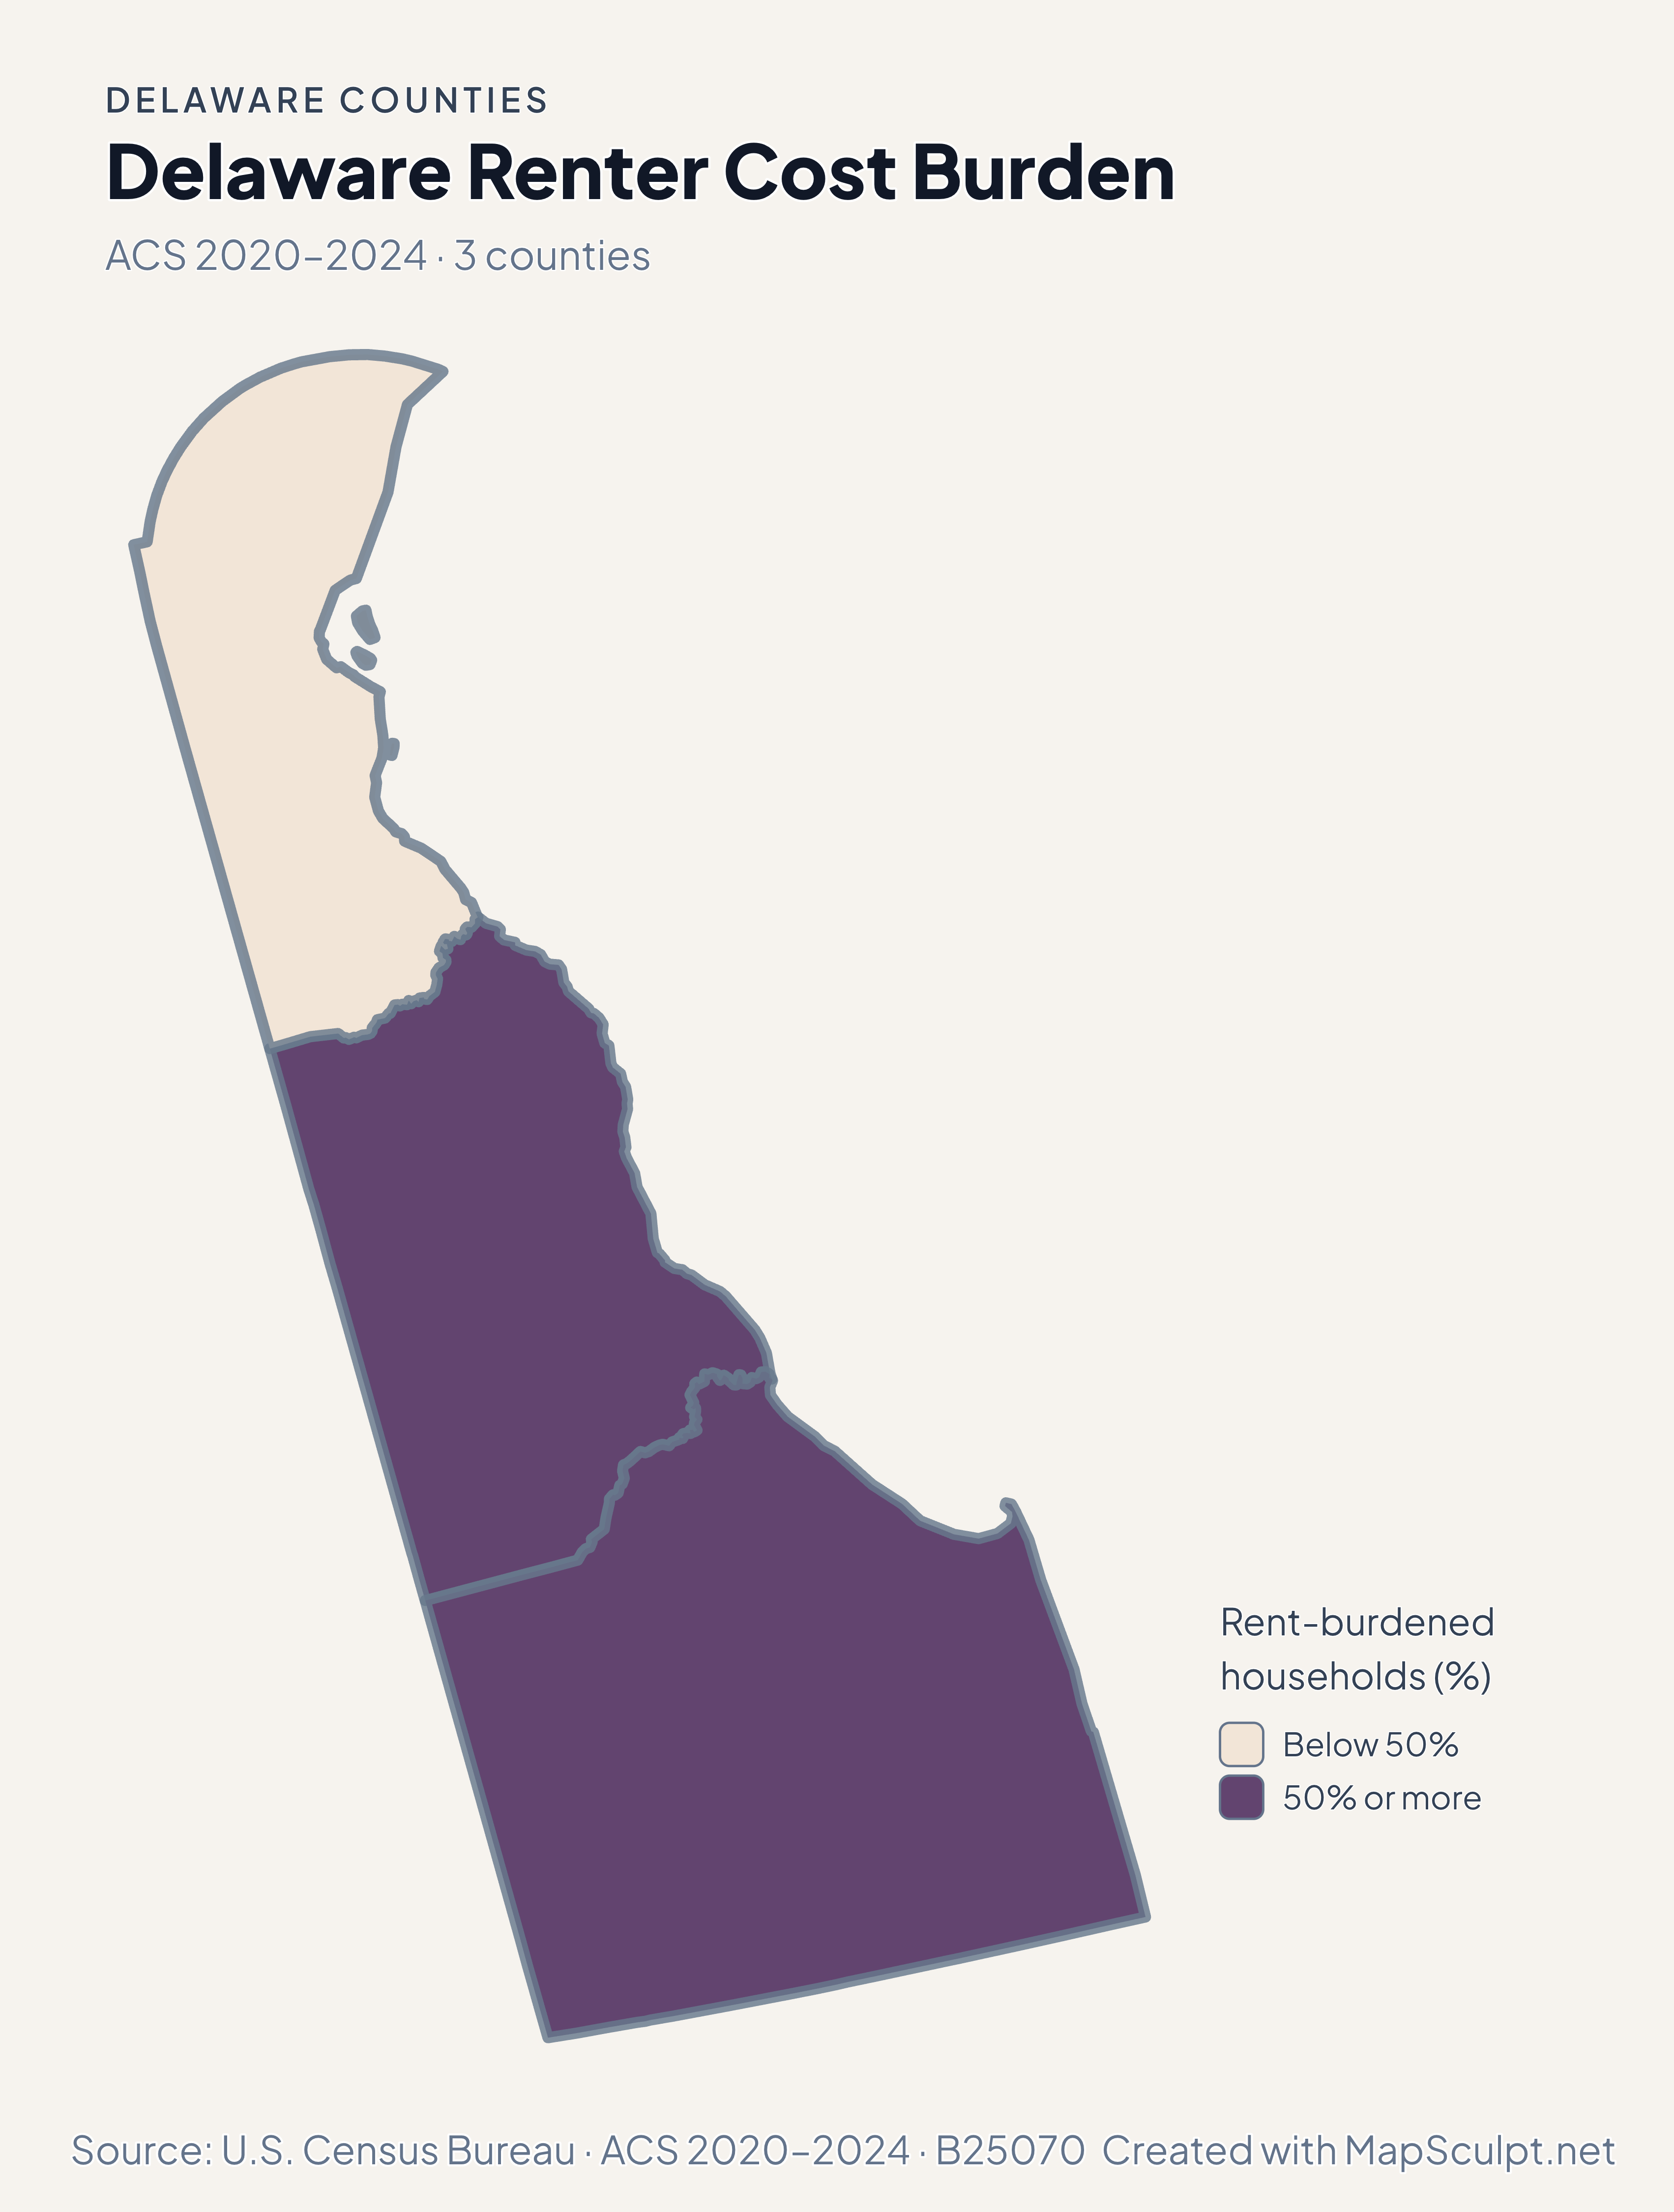
Use the four maps to compare July-to-July population estimates with the separate 2020–2024 ACS household estimates.

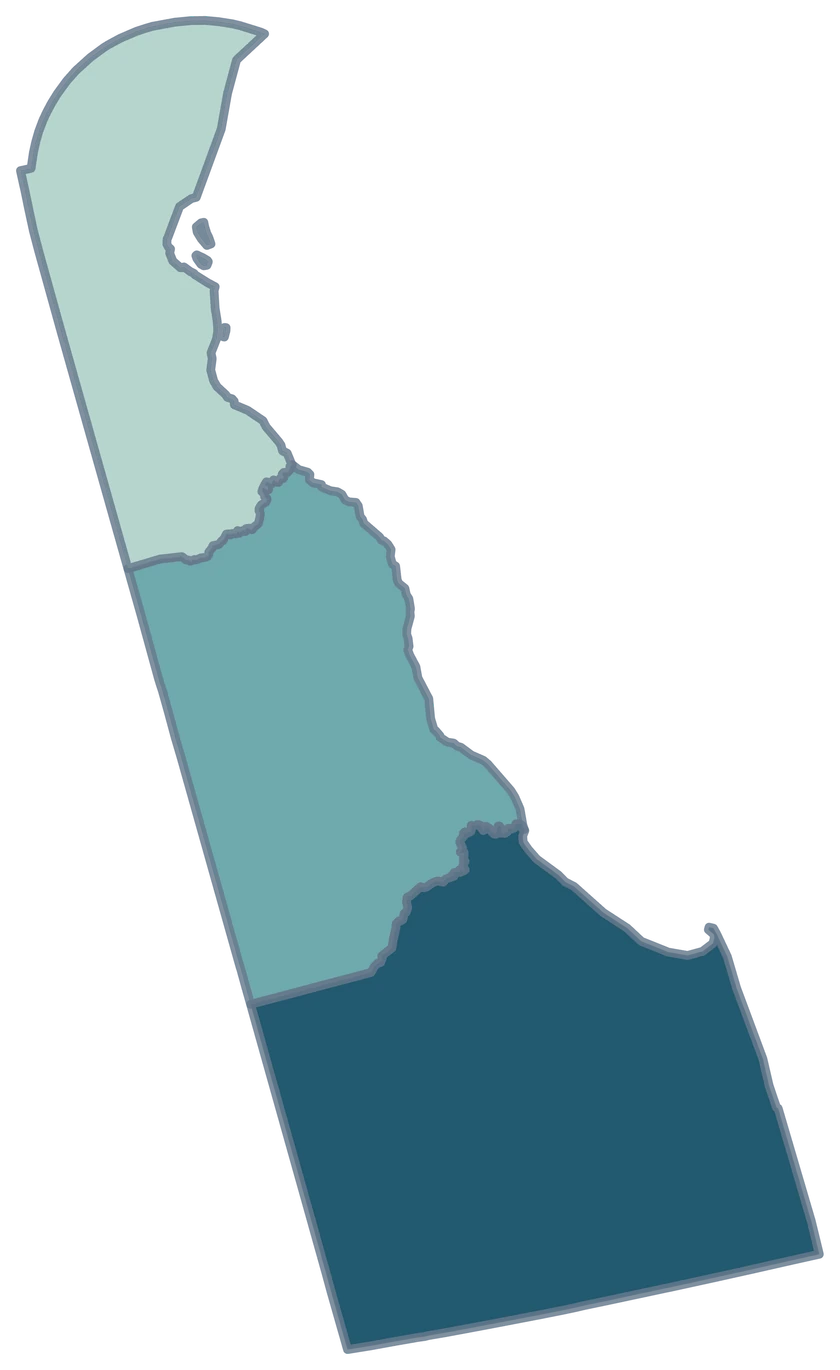
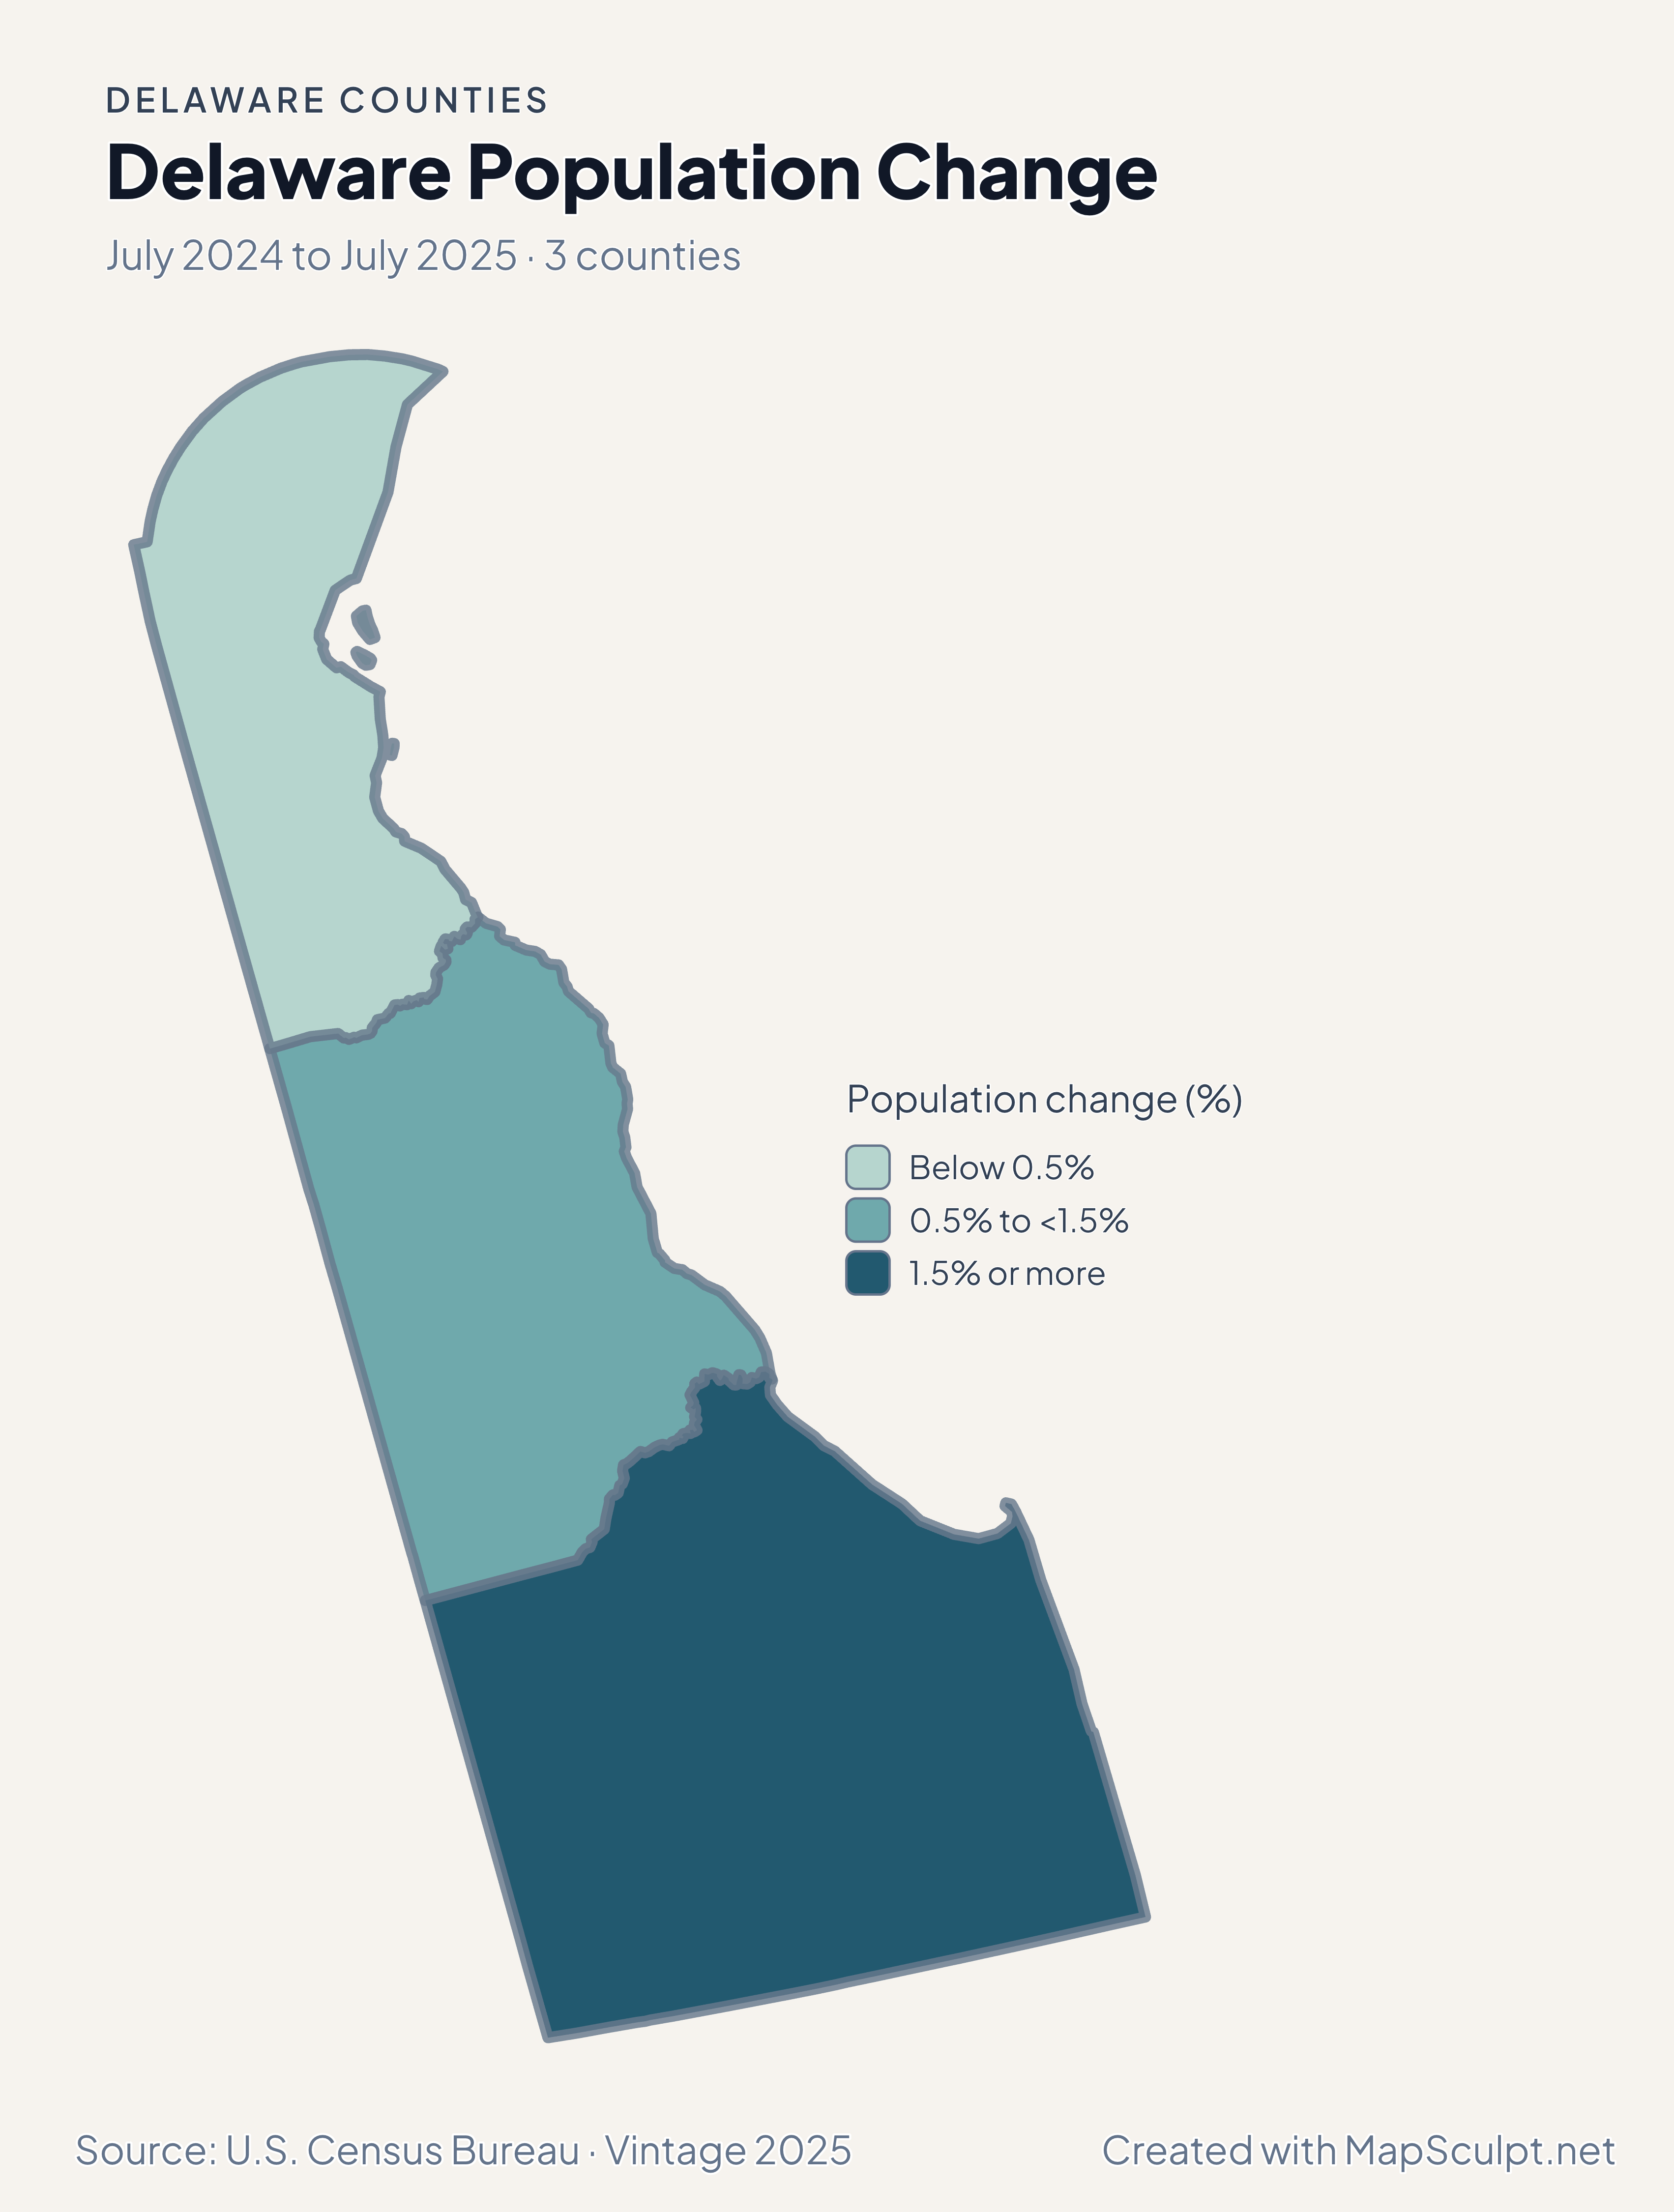
Delaware population change map. Kent in the middle growth band, New Castle in the lowest, and Sussex in the highest.

July 2024 to July 2025 · 3 counties

All three counties grew

Kent grew 0.99%, New Castle 0.34%, and Sussex 2.18% from July 2024 to July 2025. Read the three bands as differences in positive growth.

Population change (%)

  • Below 0.5%
  • 0.5% to <1.5%
  • 1.5% or more

U.S. Census Bureau · Vintage 2025

Download complete PNG

Net domestic migration was +22.93 per 1,000 residents in Sussex and −1.41 in New Castle. Kent recorded +7.19. These rates measure net domestic moves relative to each county’s population. See the Census estimates ↗

MAKE IT YOURS

From county data to a finished map.

  1. Open the Delaware editor

    Start with all 3 counties individually selectable.

  2. Match rows by GEOID

    Import a CSV using the five-character county GEOIDs from the directory.

  3. Style the counties

    Set readable class labels and keep the neutral fill visible for unmatched areas.

  4. Export the annotated map

    Preview the full geography, legend and source before downloading a PNG.

TRY CSV IMPORT

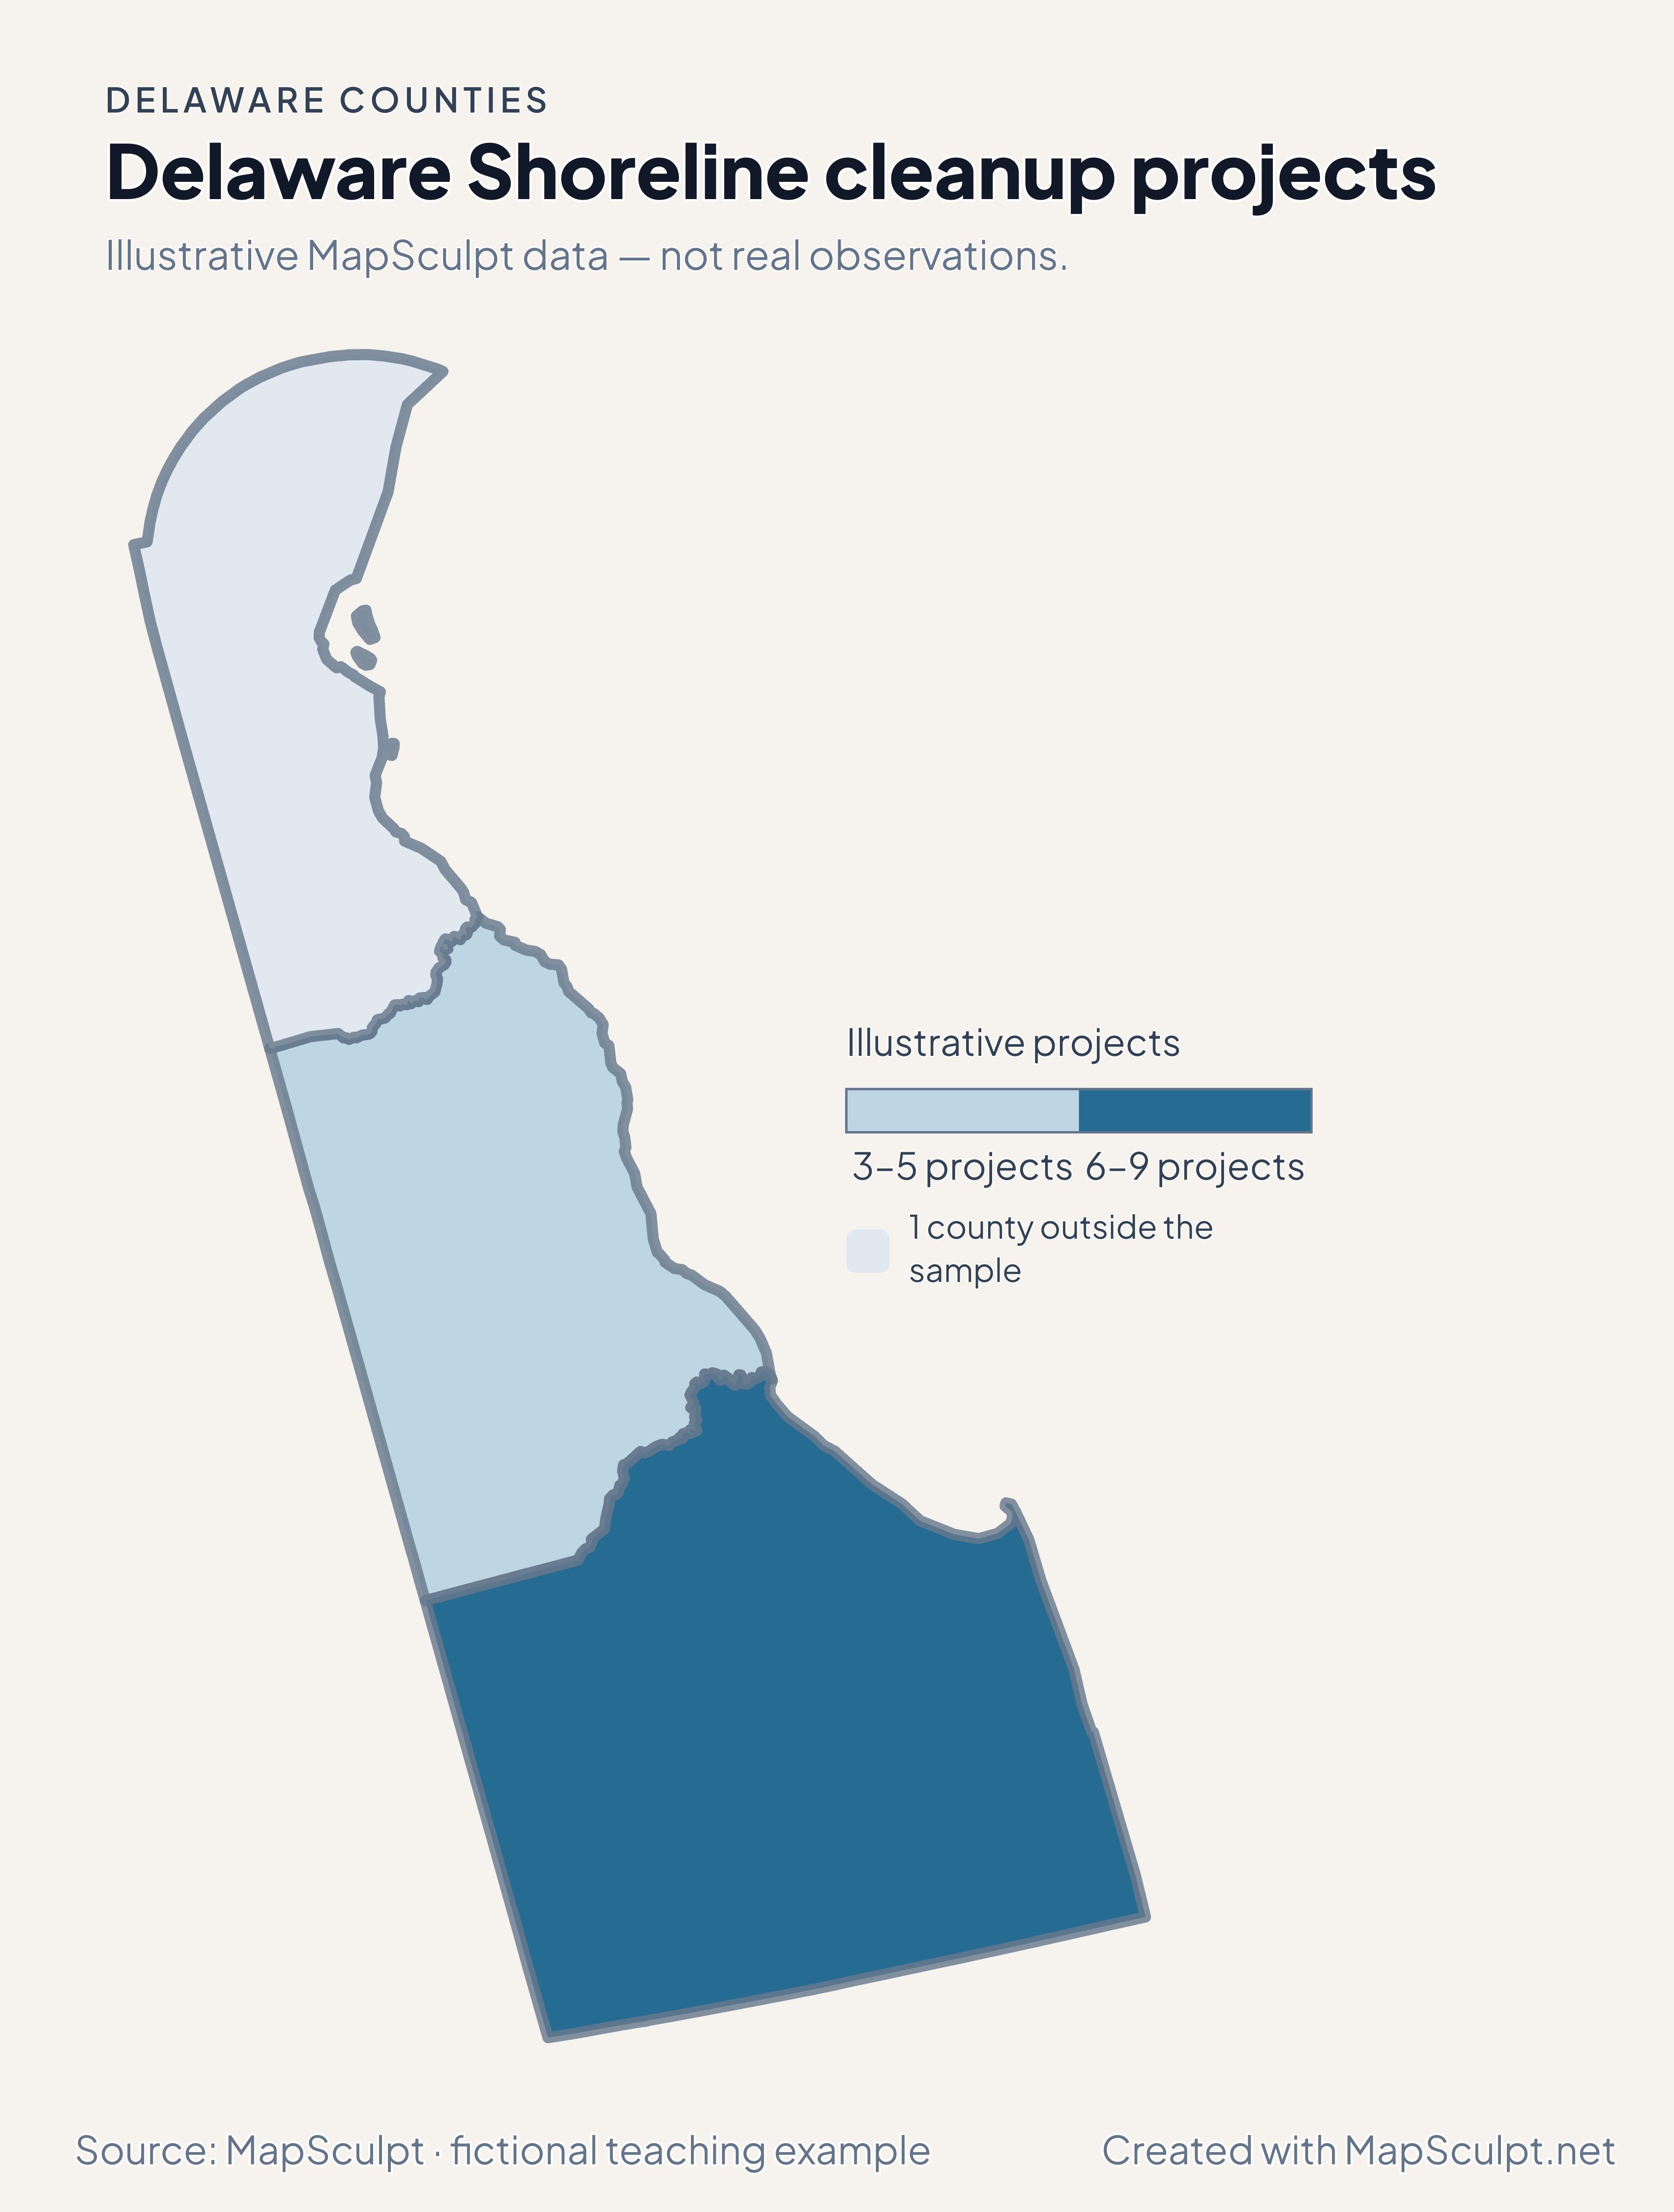
Shoreline cleanup projects in two Delaware counties

Illustrative MapSculpt data — not real observations. The file joins 2 official GEOIDs and leaves 1 county neutral.

Illustrative MapSculpt data — not real observations.
CountyGEOIDProjects
Kent County100013
Sussex County100059

Match on GEOID, select IllustrativeProjects, and enter custom boundaries 3, 6 and 9.

Download illustrative CSV ↓

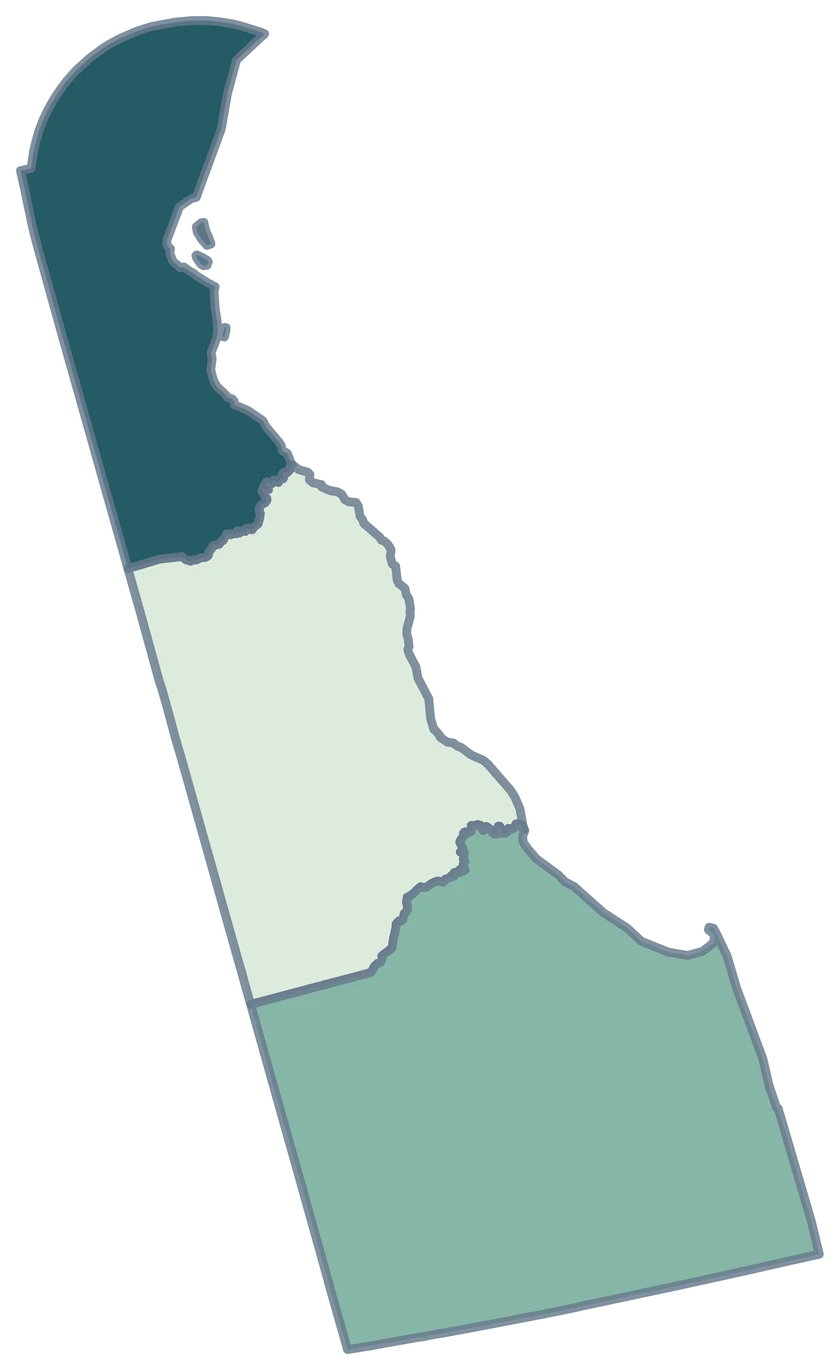
Delaware Shoreline cleanup projects

Illustrative MapSculpt data — not real observations.

Fictional Delaware shoreline cleanup projects map showing 2 sampled counties with the rest neutral.

Illustrative projects

  • 3–5 projects
  • 6–9 projects
  • 1 county outside the sample
Download complete PNG

CSV → Match 2 counties → Style → Export PNG Create a Delaware map

COUNTY REFERENCE

Find all 3 Delaware counties and GEOIDs

Official county names and five-digit Census GEOIDs. Search by name or code.

  1. Kent CountyGEOID 10001
  2. New Castle CountyGEOID 10003
  3. Sussex CountyGEOID 10005

U.S. Census Bureau · 2025 Cartographic Boundary Files

COMMON QUESTIONS

Delaware county map questions.

What are Delaware’s three county GEOIDs?

Kent is 10001, New Castle is 10003, and Sussex is 10005. Use all five characters when joining data.

Which shape should I use for Wilmington-area county statistics?

Select New Castle County. Use the source’s county-level record when you color it.

Where does Dover appear in this map?

Use Kent County for the county-level map of the Dover area. A city-level Dover figure describes a smaller area.

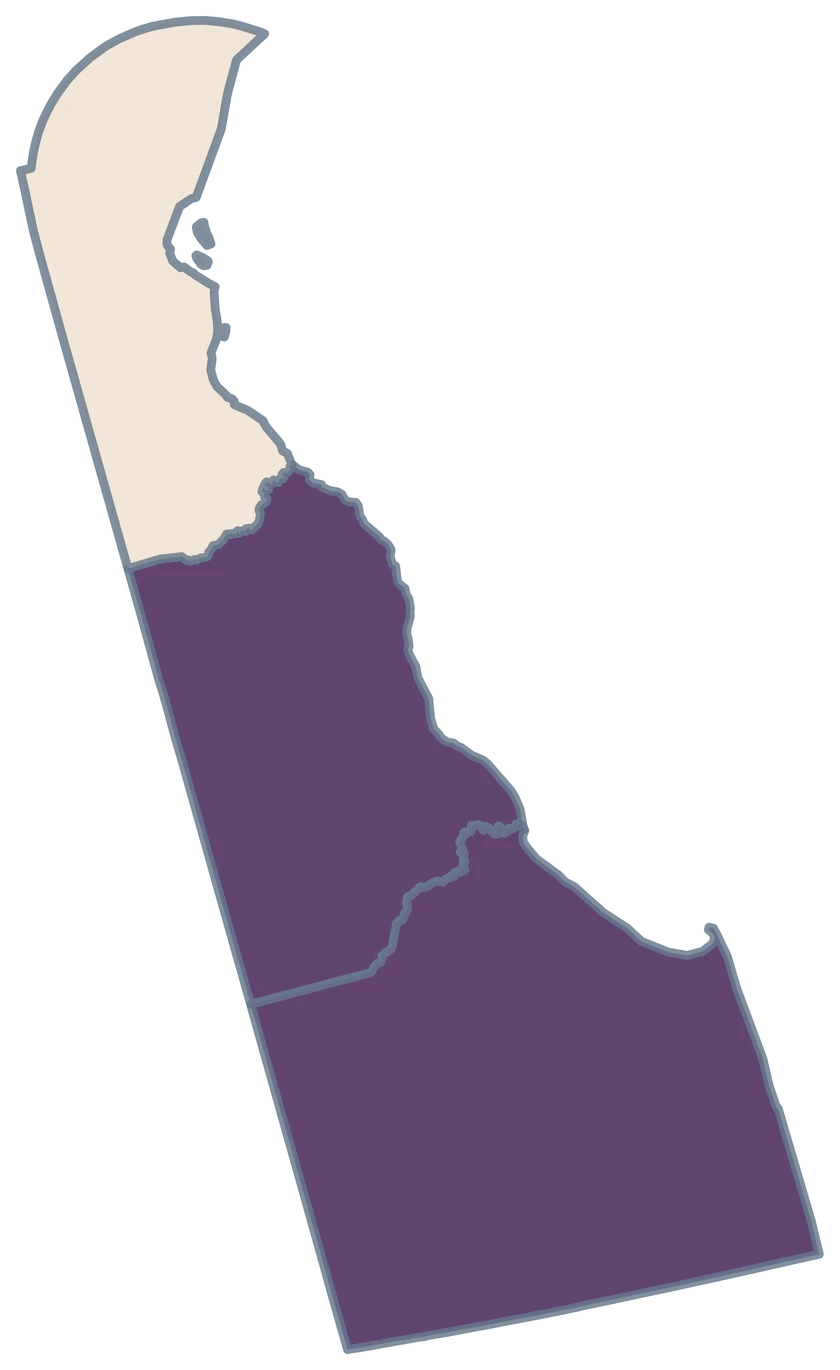
Why do some examples use only two colors?

Three county observations support a short scale. The renter burden map divides those estimates at 50% and both bands have counties.

Why is New Castle gray in the cleanup example?

The fictional CSV has rows for Kent and Sussex. New Castle keeps the neutral fill because the example leaves it outside the sample.

How do I show coastal Delaware in a report?

Use the Sussex shape with its generalized bay and ocean edges. Preview the full state before exporting so the coastline stays visible.

YOUR NEXT MAP STARTS HERE

Build a three-county Delaware map

Use the official county shapes to highlight a local comparison, join your own rows, or export a map for a presentation.

Create a Delaware map