Skip to content
MapSculpt

GEOGRAPHIC MAP MAKER / ILLINOIS

Illinois
Counties Map Maker

Compare household income around Chicago, along the Mississippi and in southern Illinois. Use all 102 counties to show how a pattern changes when the geography stays fixed and the measure changes.

Free online editor · No sign-up required

102counties
individually editable

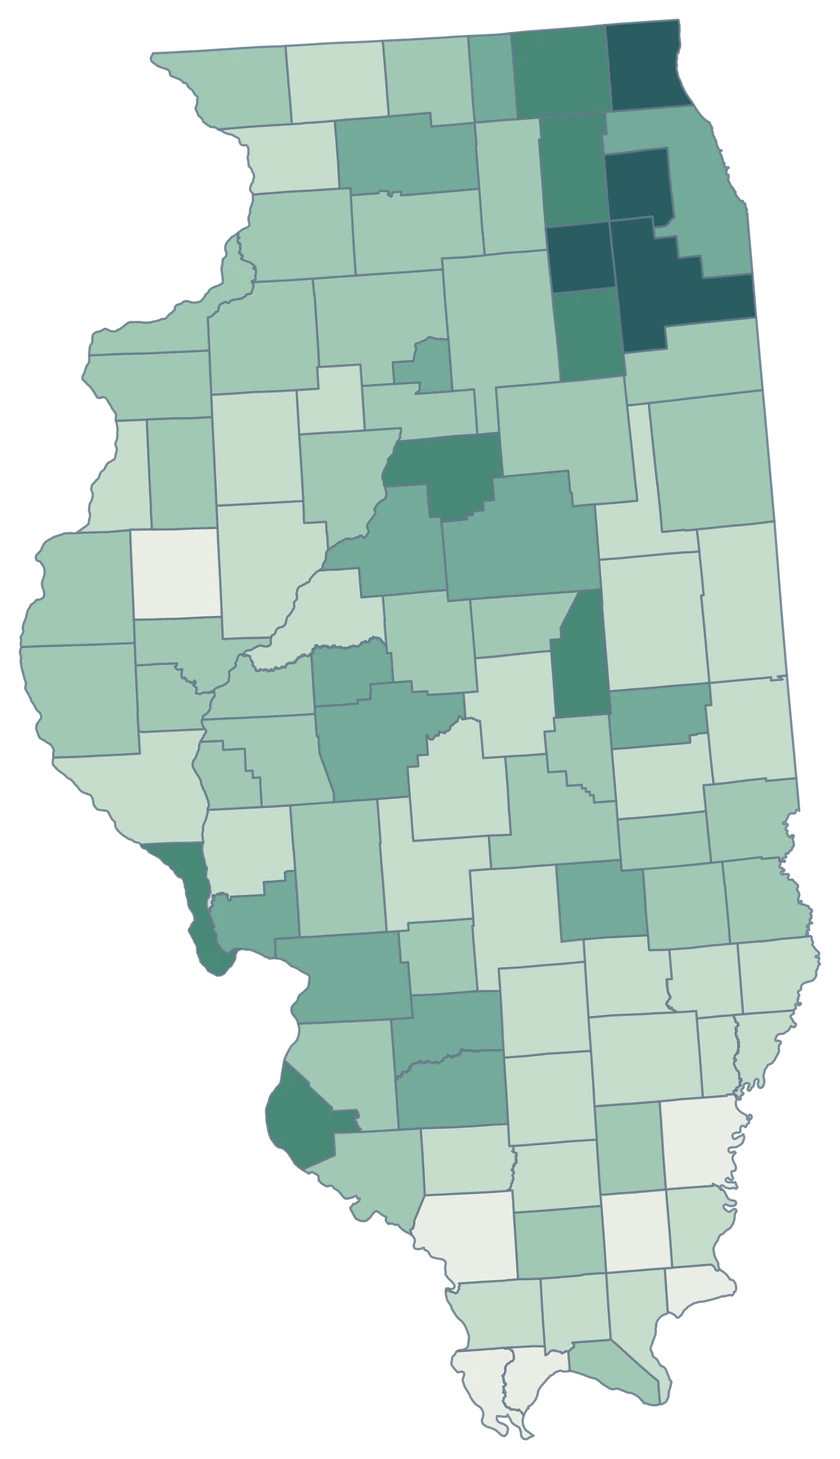
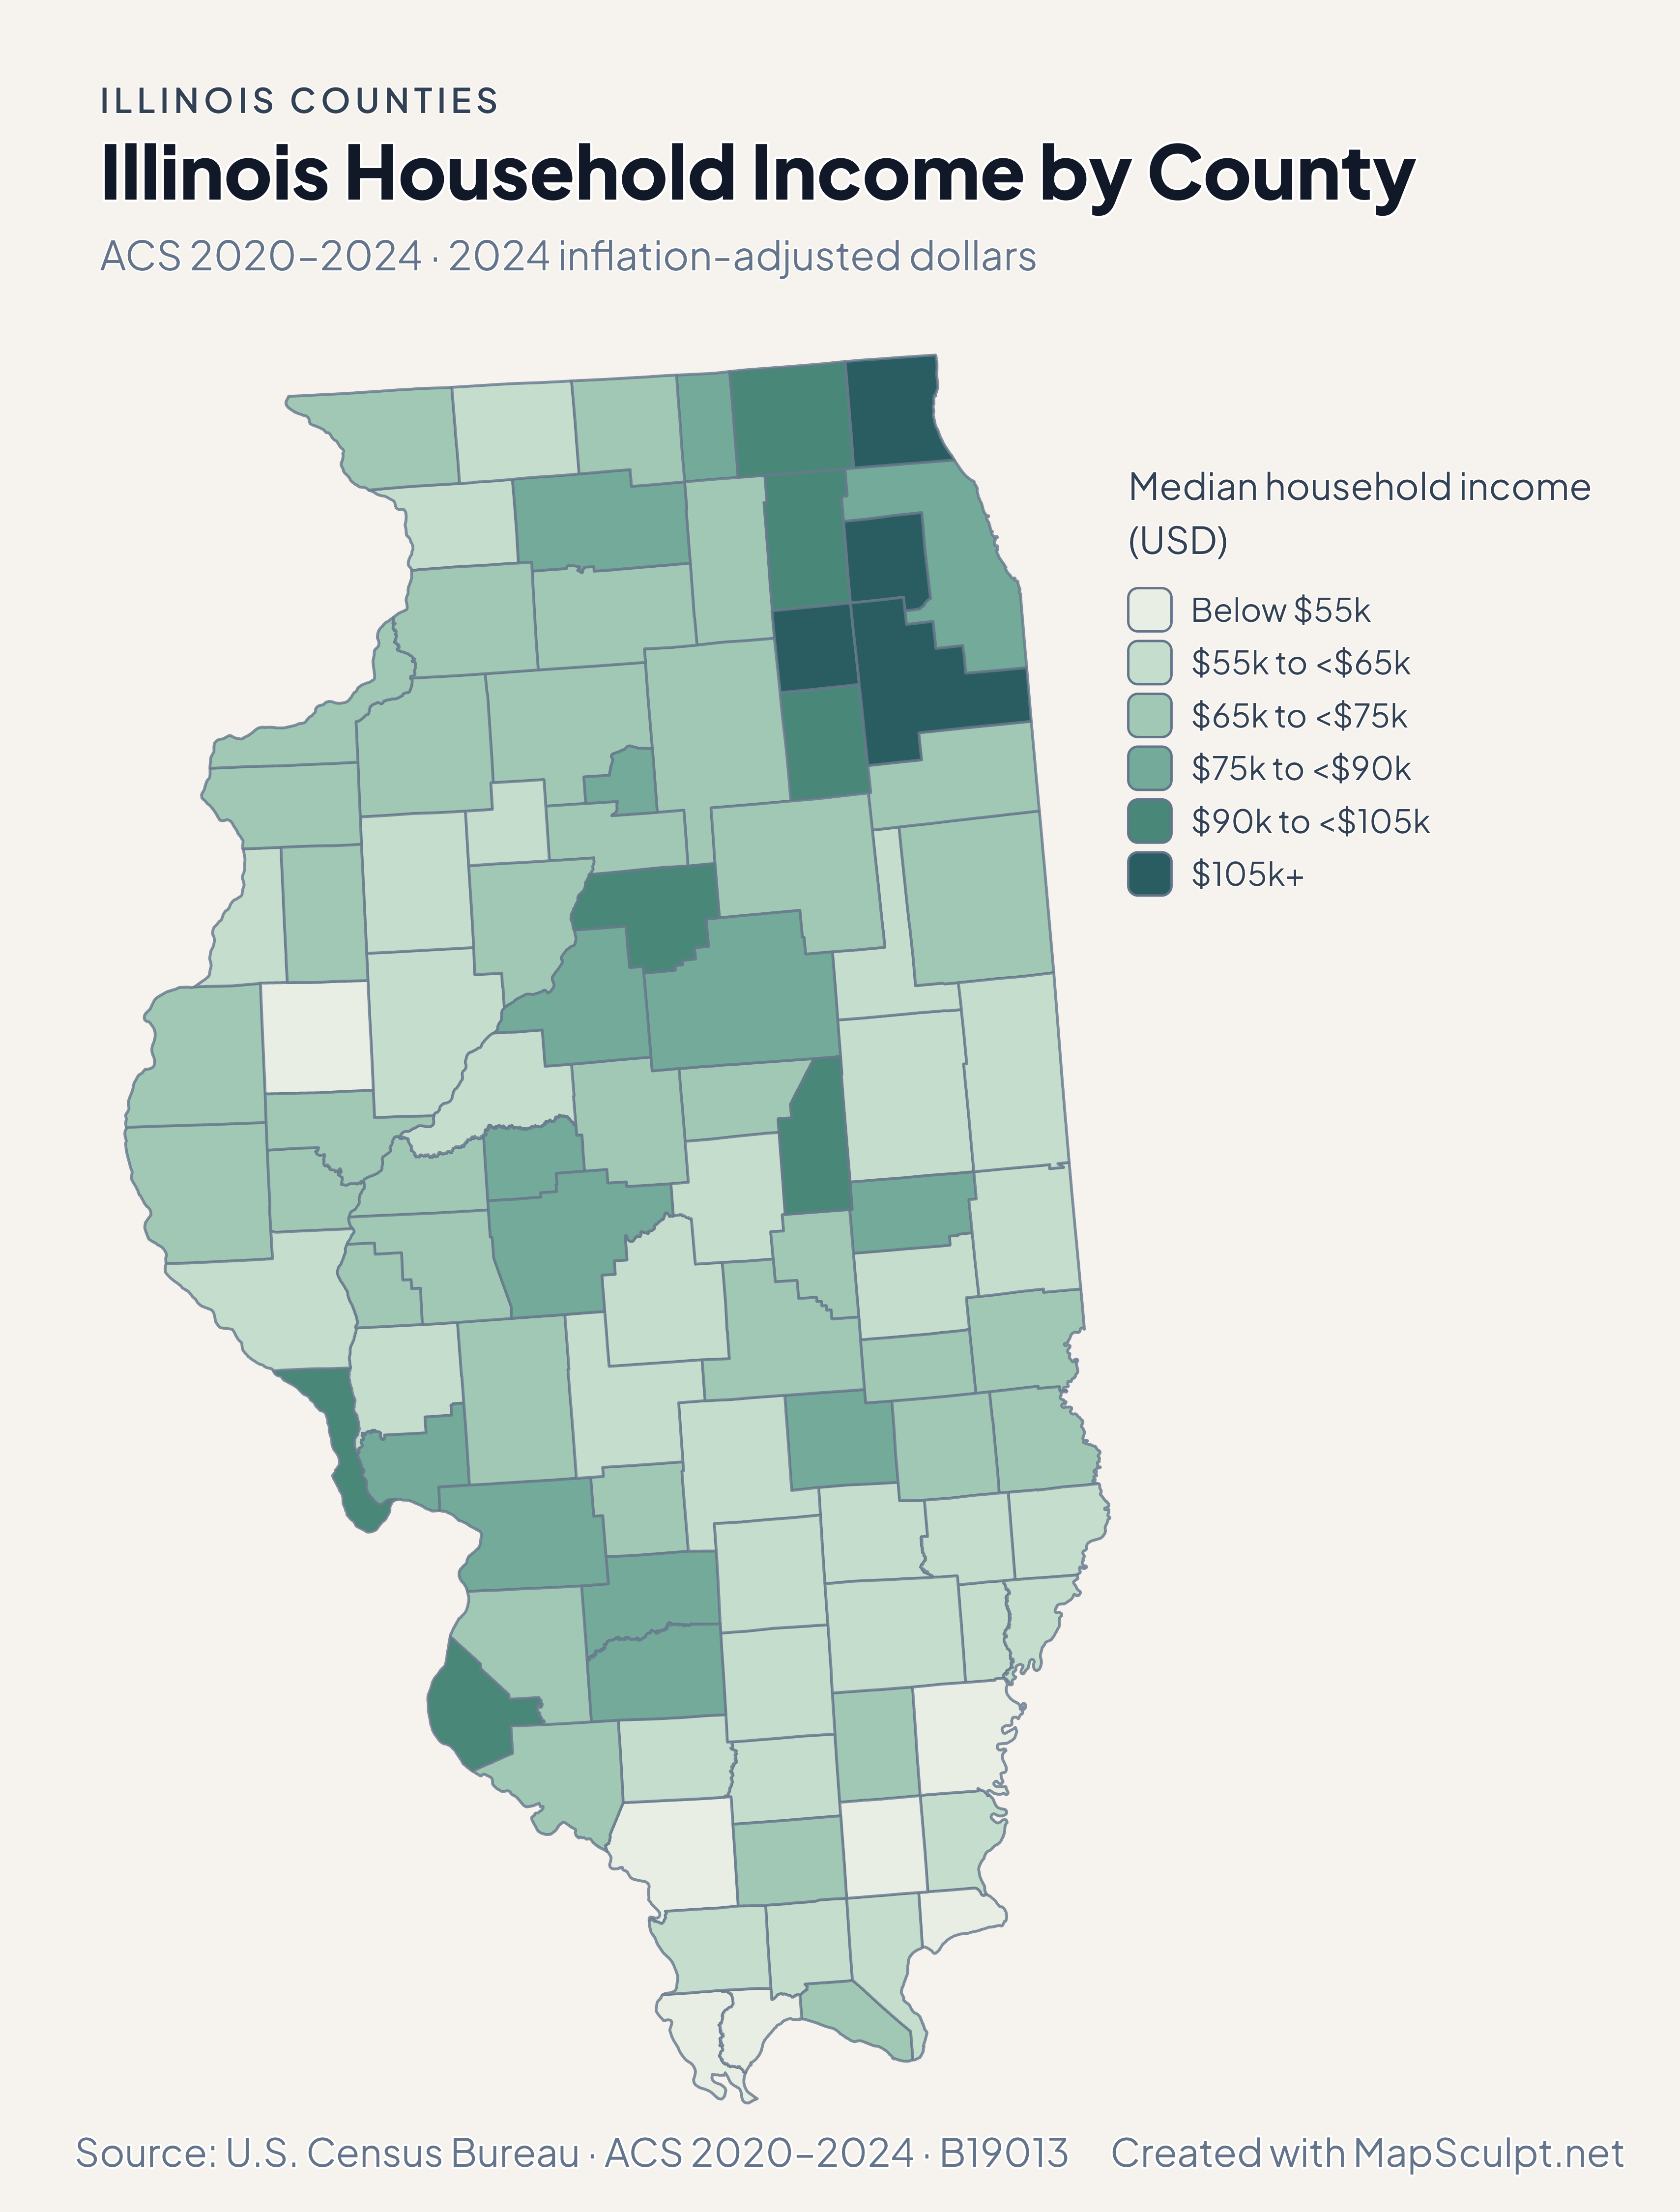
Illinois Household Income by County

ACS 2020–2024 · 2024 inflation-adjusted dollars

Illinois median household income map, with dark teal around DuPage and much lighter shades near the southern tip.

Median household income (USD)

  • Below $55k
  • $55k to <$65k
  • $65k to <$75k
  • $75k to <$90k
  • $90k to <$105k
  • $105k+
U.S. Census Bureau · ACS 2020–2024 · B19013Download complete PNG Income is the ACS median for households, expressed in inflation-adjusted 2024 dollars.

KNOW YOUR GEOGRAPHY

Lake Michigan, the Illinois River and the southern tip.

Illinois stretches from Lake Michigan to the meeting of the Ohio and Mississippi rivers. Cook is one selectable county, while DuPage, Lake, Will and Kendall are separate features with their own Census GEOIDs.

County data describes whole county populations. A regional label such as Chicagoland needs its county membership defined before you aggregate values or group features.

Browse all county GEOIDs ↗

2025 Census boundaries

OFFICIAL DATA

From Chicago’s neighbors to the southern tip.

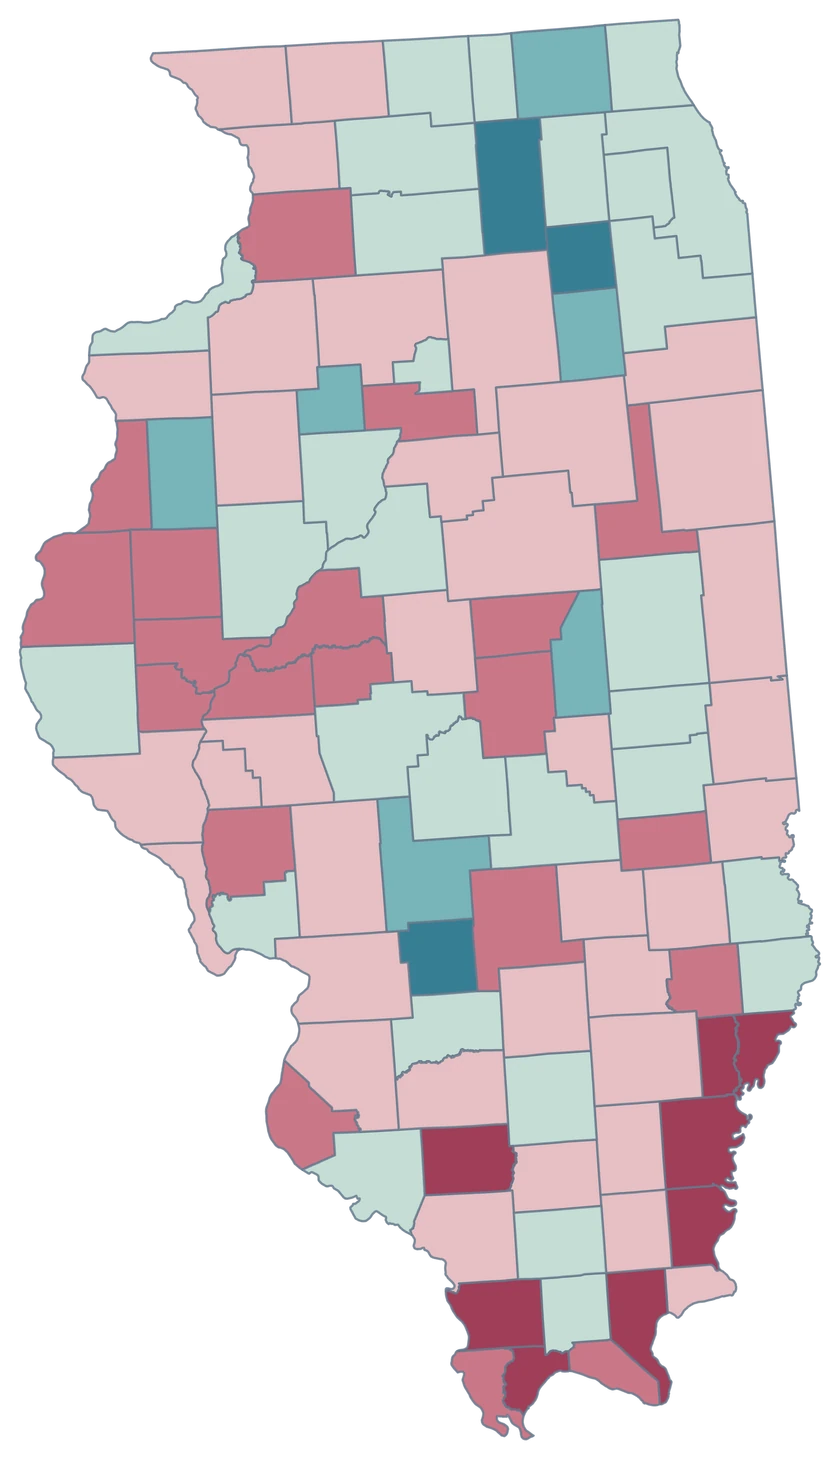
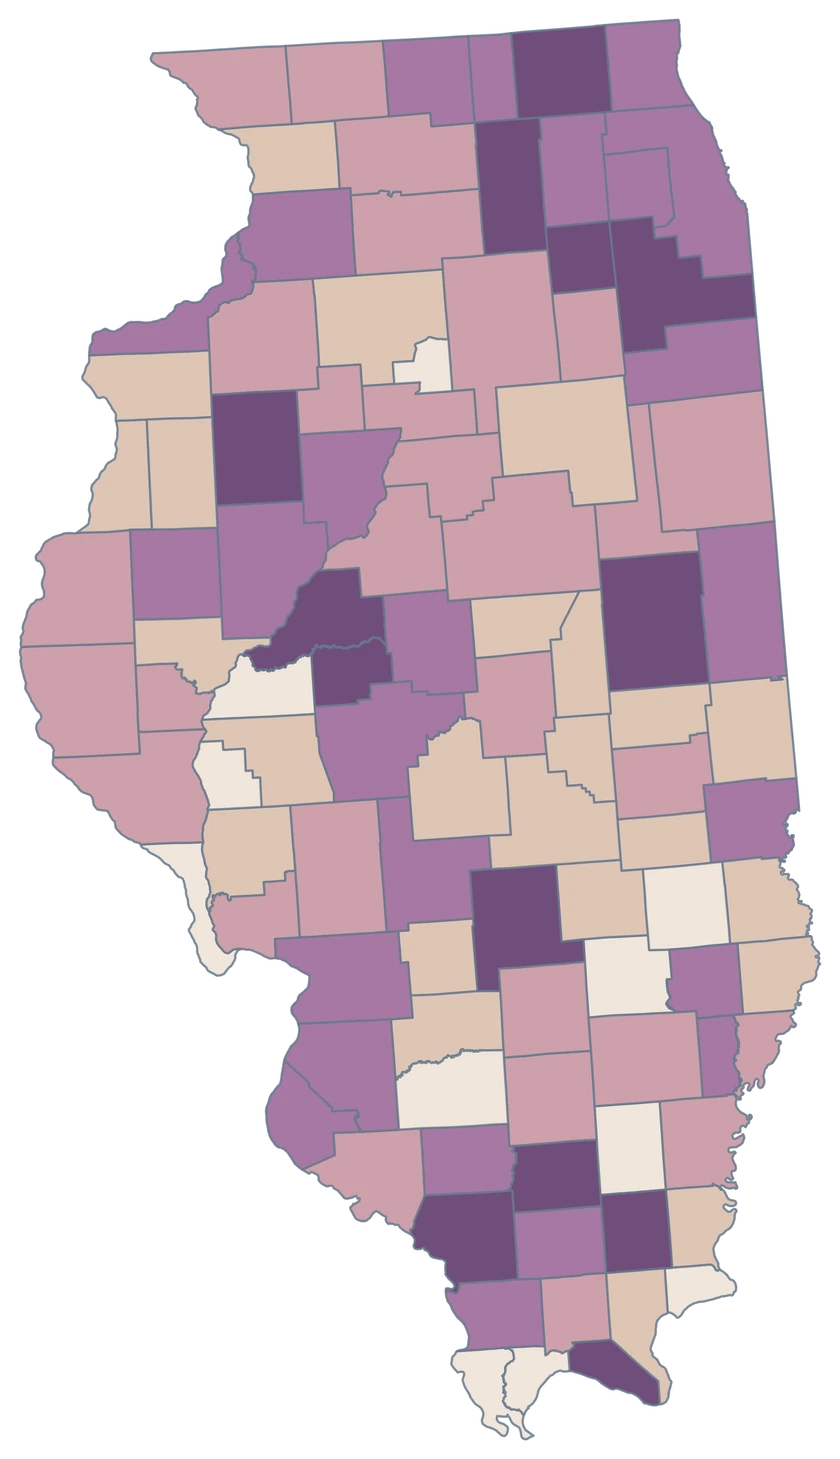
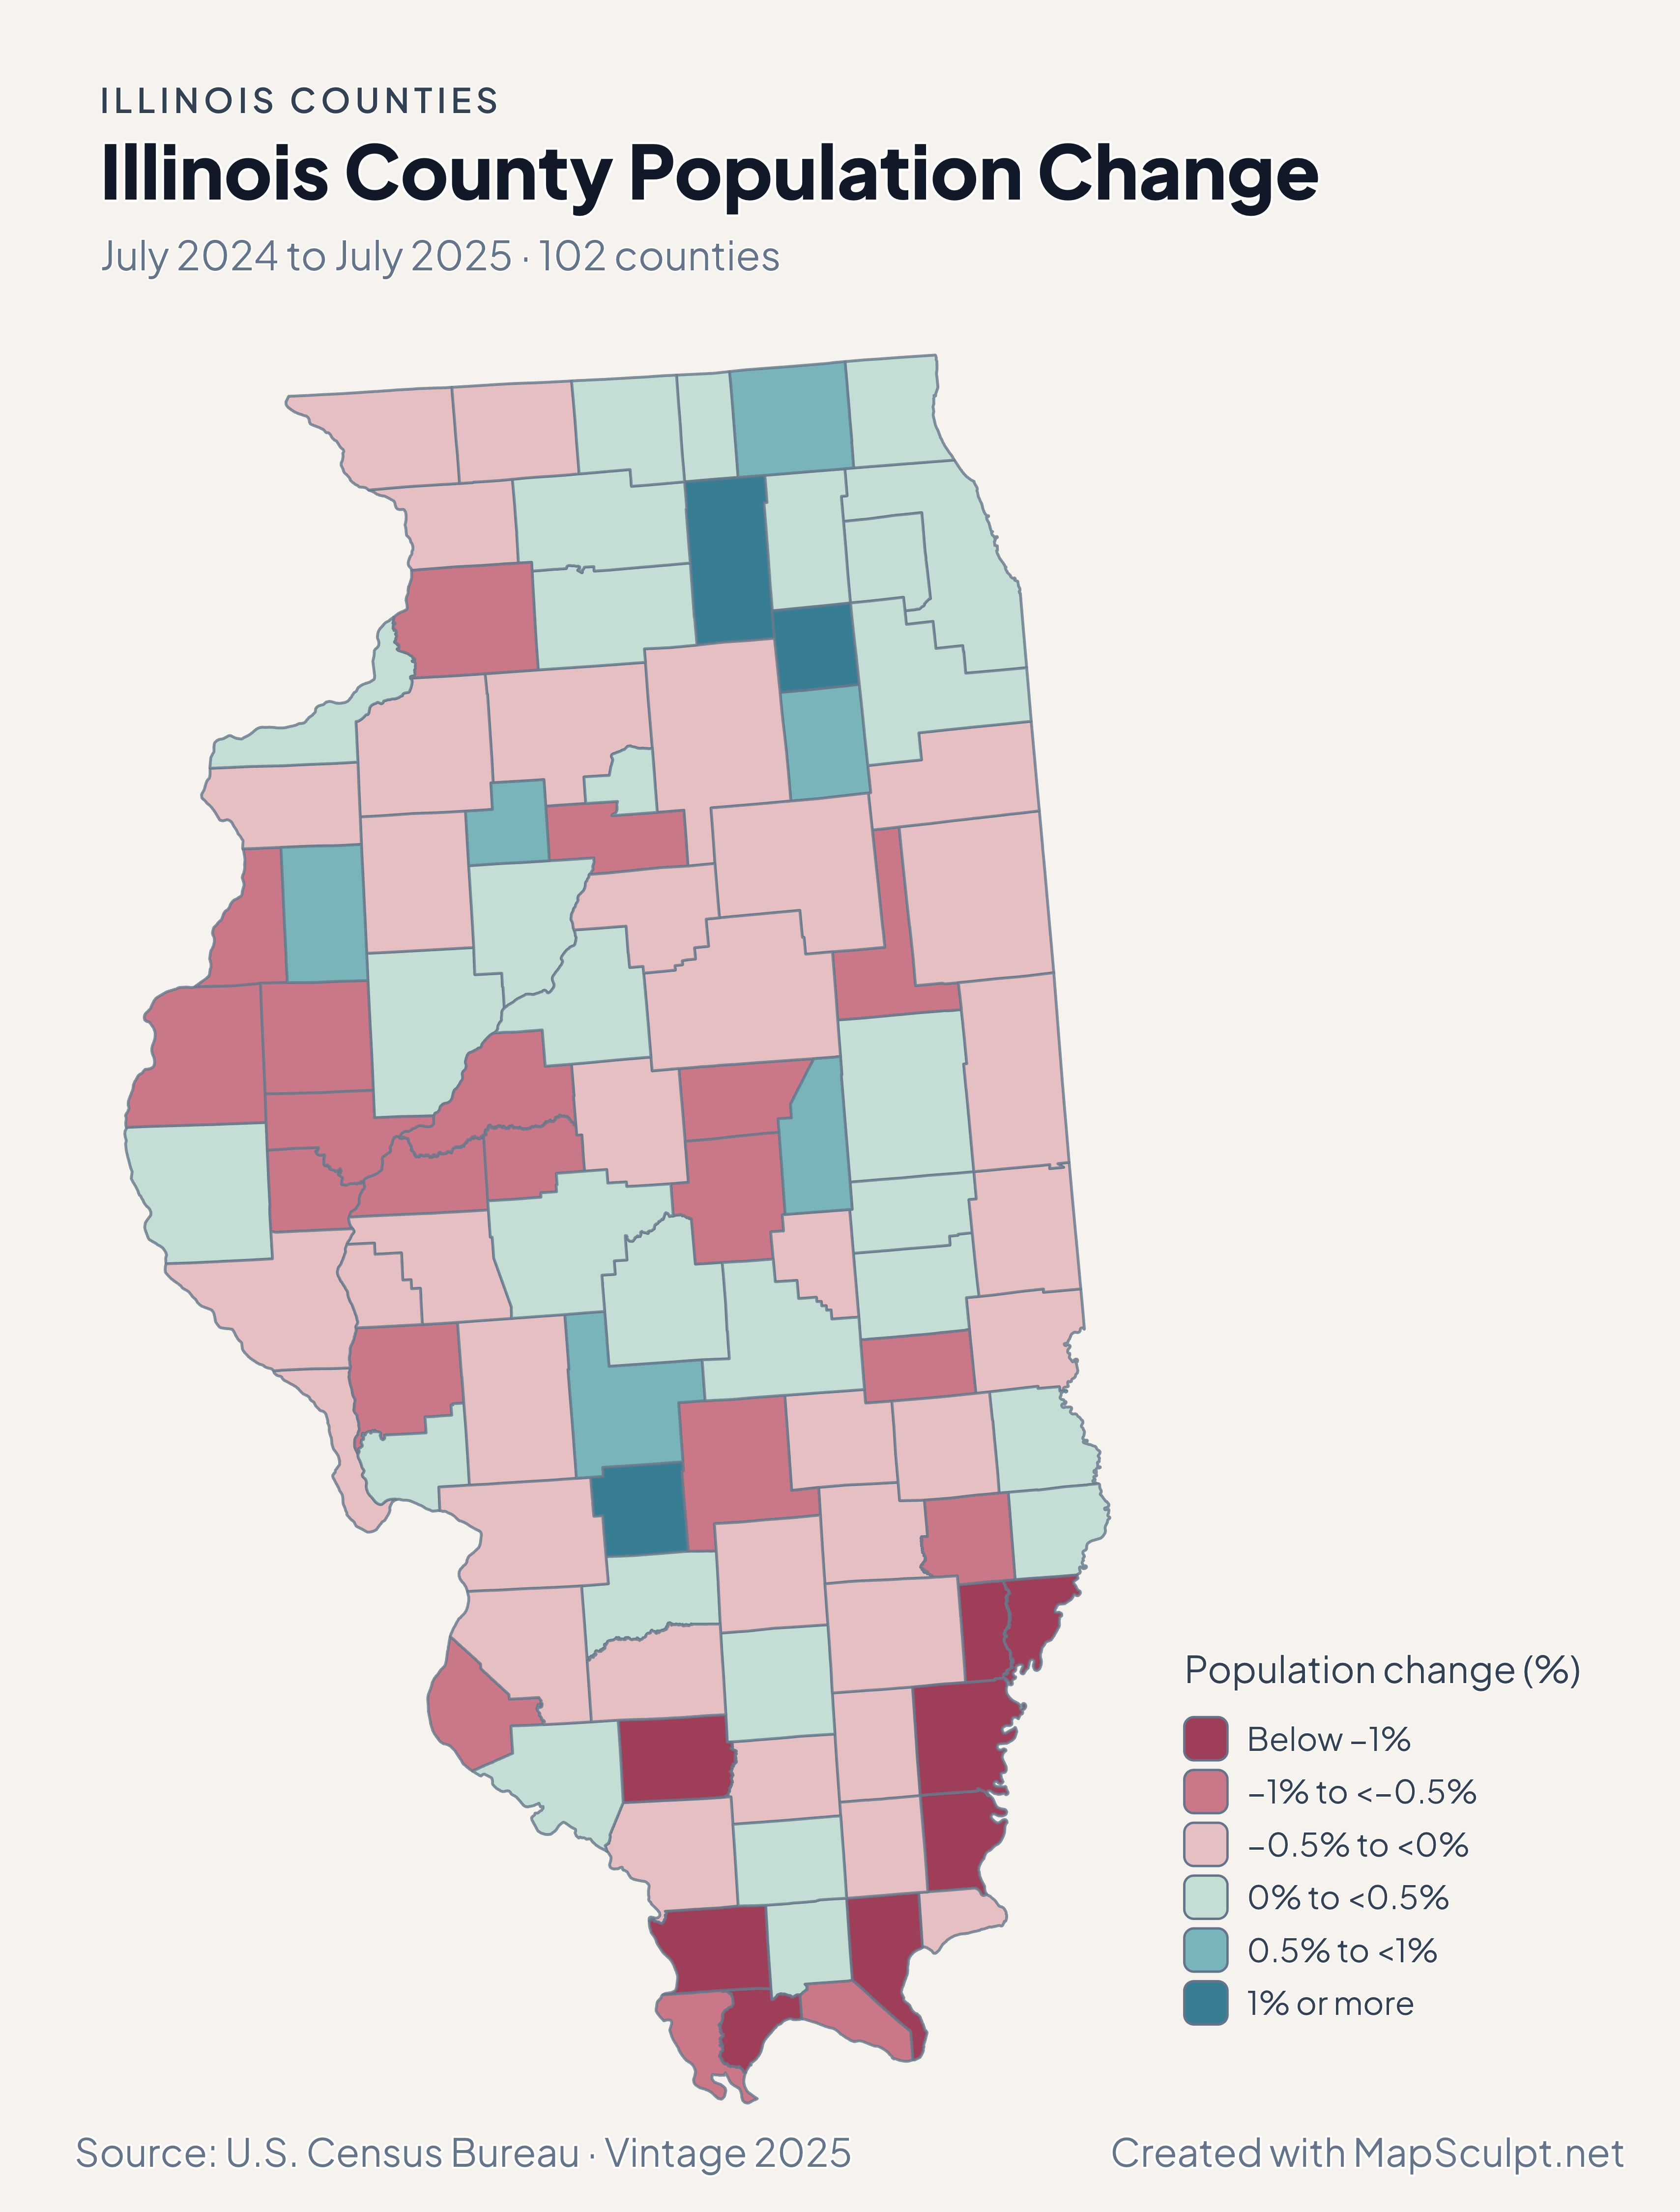
Start with the income bands around Chicago and in southern Illinois, then see how migration and population change draw different patterns on the same county boundaries.

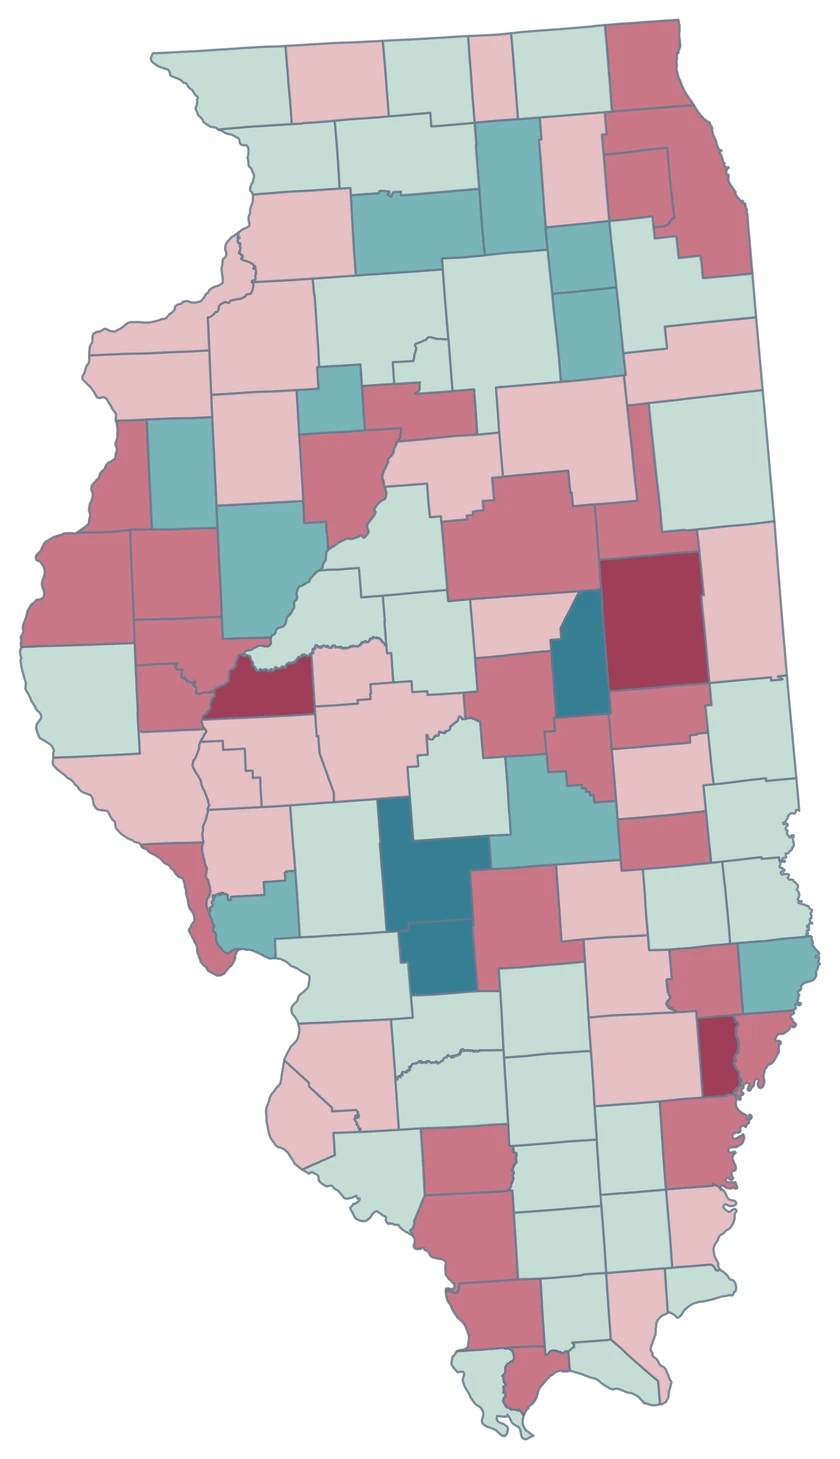
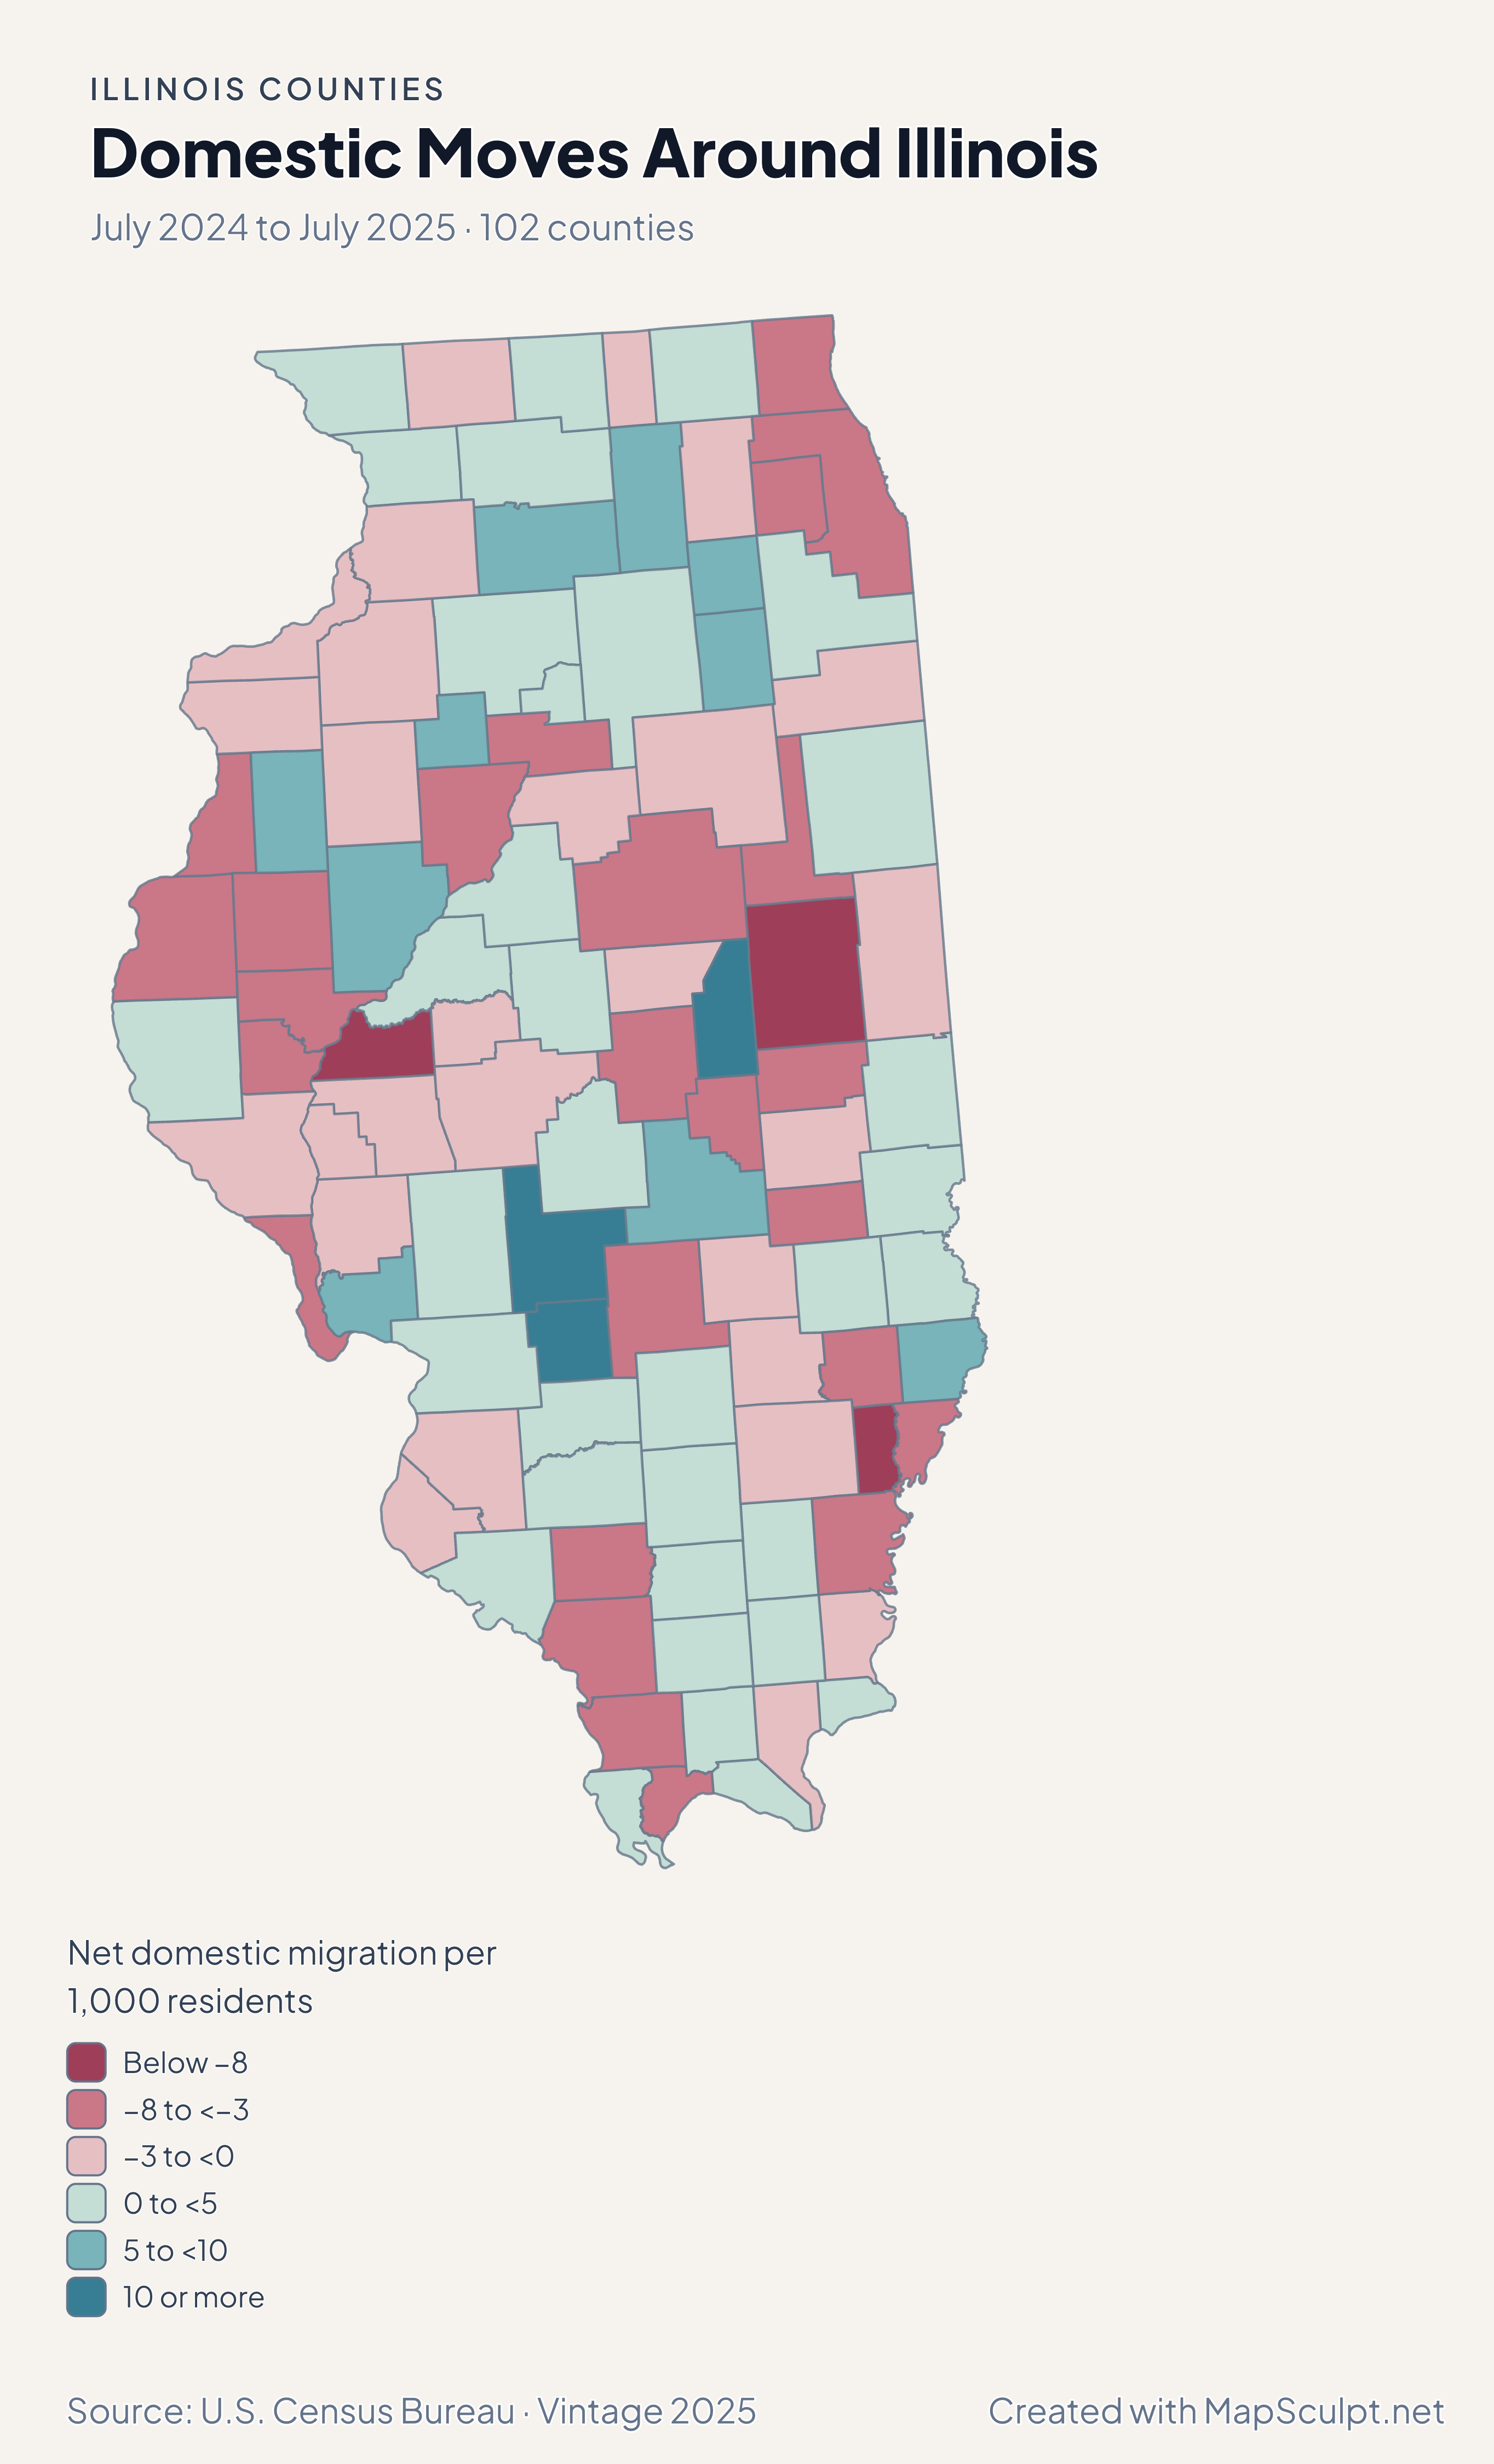
Illinois migration map with loss shades in Cook, DuPage and Champaign and a gain shade in Kendall.

July 2024 to July 2025 · 102 counties

Kendall’s migration pattern differs from Cook and DuPage.

Cook and DuPage recorded net domestic losses. Kendall logged a gain of 8.84 per 1,000 residents. Champaign, outside the Chicago region, recorded a net domestic loss of 10.72 per 1,000 even as its total population grew.

Net domestic migration per 1,000 residents

  • Below −8
  • −8 to <−3
  • −3 to <0
  • 0 to <5
  • 5 to <10
  • 10 or more

U.S. Census Bureau · Vintage 2025

Download complete PNG

DuPage’s median household income estimate was $112,096 and Pulaski’s was $42,463. Kendall and Will also fall in the highest displayed income band. Read these ACS estimates with their margins of error. See the Census estimates ↗

MAKE IT YOURS

From county data to a finished map.

  1. Open the Illinois editor

    Start with the 102 official county features.

  2. Match county GEOIDs

    Use a dedicated five-digit county column, such as 17031 for Cook County.

  3. Build a readable legend

    Choose class breaks that fit your measure and write the period and units beside the map.

  4. Export the finished map

    Check the full composition, then download a high-resolution PNG with your title and source.

TRY CSV IMPORT

Practice with six Illinois counties.

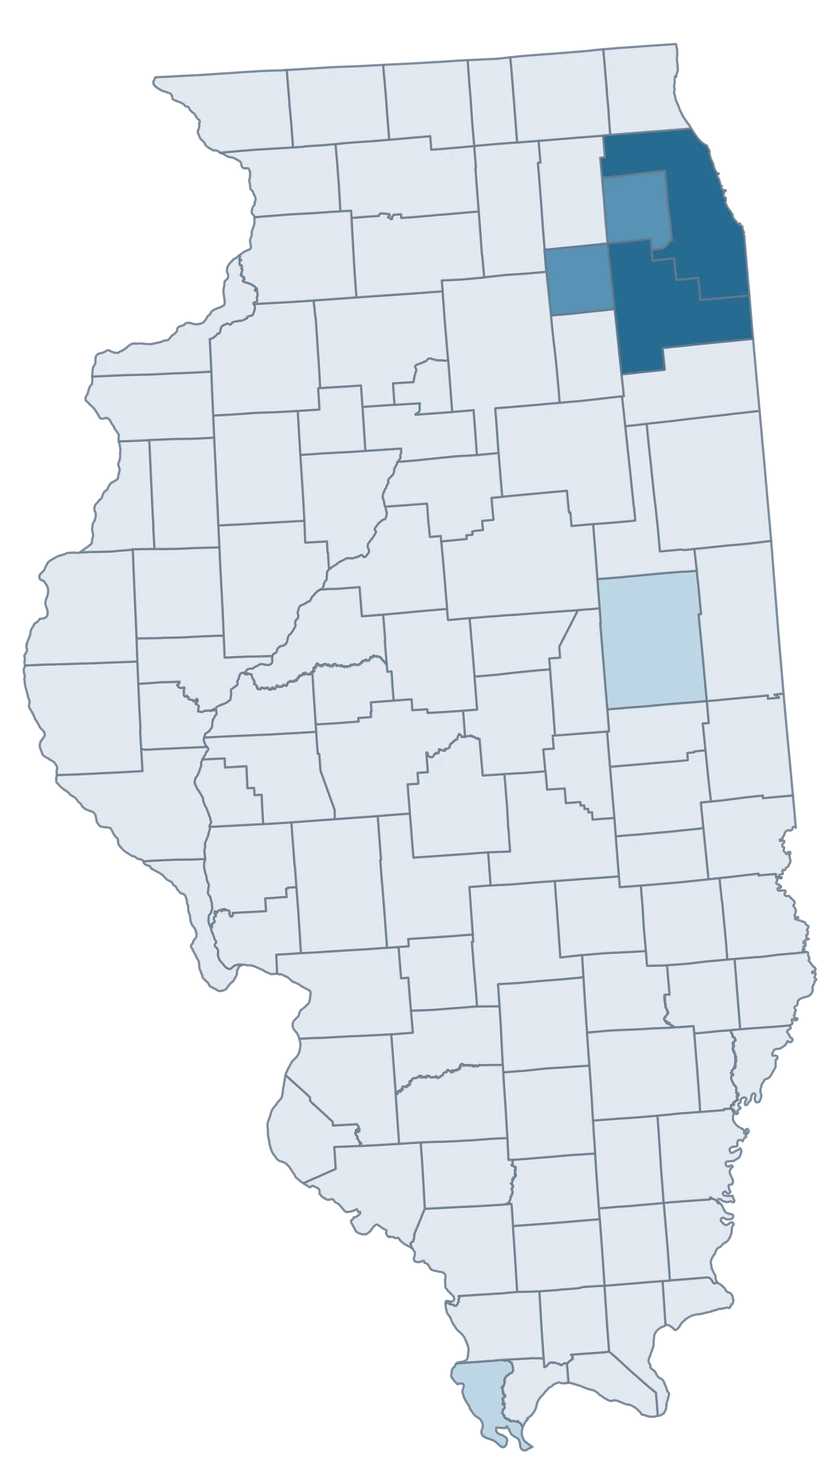
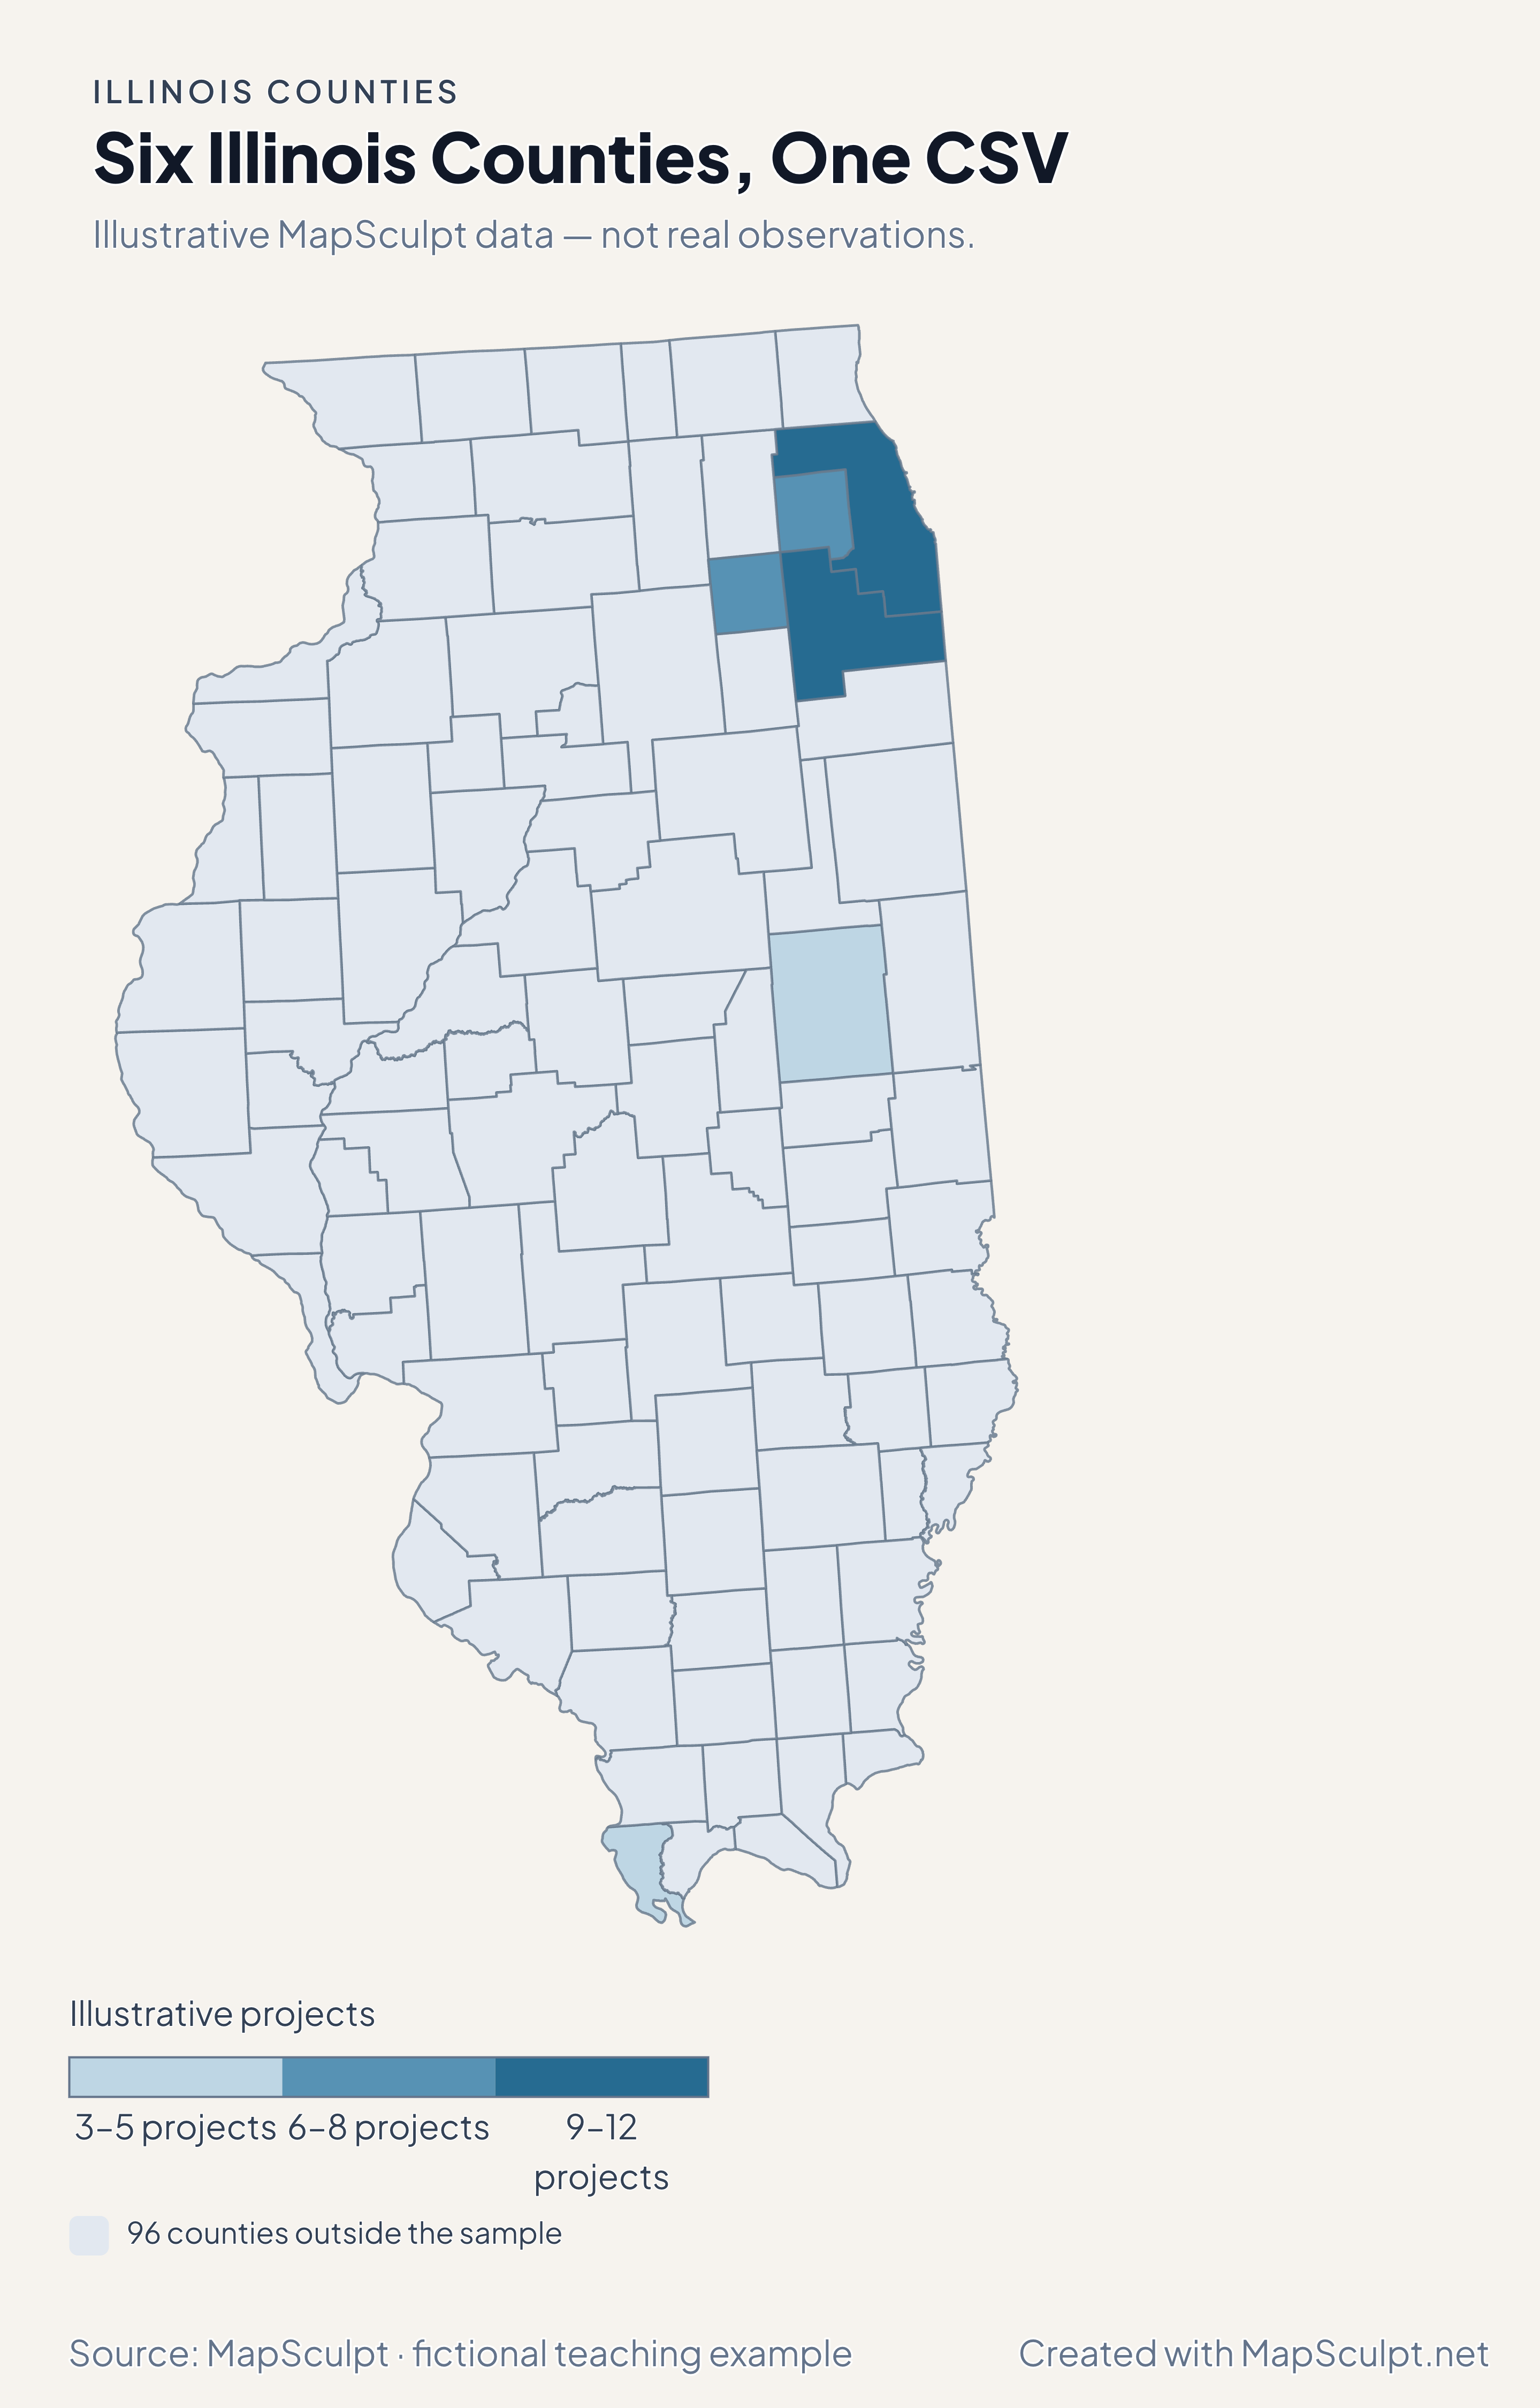
Import the fictional project counts, choose IllustrativeProjects and set numeric boundaries of 3, 6, 9 and 12. The 96 counties outside the sample share a neutral fill.

Illustrative MapSculpt data — not real observations.
CountyGEOIDProjects
Cook County1703112
DuPage County170438
Kendall County170936
Will County171979
Champaign County170194
Alexander County170035

Keep GEOIDs as text. In this sample Cook County is 17031 and Alexander County is 17003. Use the directory when preparing a larger county join.

Download illustrative CSV ↓

Six Illinois Counties, One CSV

Illustrative MapSculpt data — not real observations.

Illustrative Illinois map highlighting six sampled counties, with the remaining 96 counties in a neutral shade.

Illustrative projects

  • 3–5 projects
  • 6–8 projects
  • 9–12 projects
  • 96 counties outside the sample
Download complete PNG

CSV → Match 6 counties → Style → Export PNG Create an Illinois map

COUNTY REFERENCE

Find all 102 Illinois county GEOIDs.

Official county names and five-digit Census GEOIDs. Search by name or code.

  1. Adams CountyGEOID 17001
  2. Alexander CountyGEOID 17003
  3. Bond CountyGEOID 17005
  4. Boone CountyGEOID 17007
  5. Brown CountyGEOID 17009
  6. Bureau CountyGEOID 17011
  7. Calhoun CountyGEOID 17013
  8. Carroll CountyGEOID 17015
  9. Cass CountyGEOID 17017
  10. Champaign CountyGEOID 17019
  11. Christian CountyGEOID 17021
  12. Clark CountyGEOID 17023
  13. Clay CountyGEOID 17025
  14. Clinton CountyGEOID 17027
  15. Coles CountyGEOID 17029
  16. Cook CountyGEOID 17031
  17. Crawford CountyGEOID 17033
  18. Cumberland CountyGEOID 17035
  19. De Witt CountyGEOID 17039
  20. DeKalb CountyGEOID 17037
  21. Douglas CountyGEOID 17041
  22. DuPage CountyGEOID 17043
  23. Edgar CountyGEOID 17045
  24. Edwards CountyGEOID 17047
  25. Effingham CountyGEOID 17049
  26. Fayette CountyGEOID 17051
  27. Ford CountyGEOID 17053
  28. Franklin CountyGEOID 17055
  29. Fulton CountyGEOID 17057
  30. Gallatin CountyGEOID 17059
  31. Greene CountyGEOID 17061
  32. Grundy CountyGEOID 17063
  33. Hamilton CountyGEOID 17065
  34. Hancock CountyGEOID 17067
  35. Hardin CountyGEOID 17069
  36. Henderson CountyGEOID 17071
  37. Henry CountyGEOID 17073
  38. Iroquois CountyGEOID 17075
  39. Jackson CountyGEOID 17077
  40. Jasper CountyGEOID 17079
  41. Jefferson CountyGEOID 17081
  42. Jersey CountyGEOID 17083
  43. Jo Daviess CountyGEOID 17085
  44. Johnson CountyGEOID 17087
  45. Kane CountyGEOID 17089
  46. Kankakee CountyGEOID 17091
  47. Kendall CountyGEOID 17093
  48. Knox CountyGEOID 17095
  49. Lake CountyGEOID 17097
  50. LaSalle CountyGEOID 17099
  51. Lawrence CountyGEOID 17101
  52. Lee CountyGEOID 17103
  53. Livingston CountyGEOID 17105
  54. Logan CountyGEOID 17107
  55. Macon CountyGEOID 17115
  56. Macoupin CountyGEOID 17117
  57. Madison CountyGEOID 17119
  58. Marion CountyGEOID 17121
  59. Marshall CountyGEOID 17123
  60. Mason CountyGEOID 17125
  61. Massac CountyGEOID 17127
  62. McDonough CountyGEOID 17109
  63. McHenry CountyGEOID 17111
  64. McLean CountyGEOID 17113
  65. Menard CountyGEOID 17129
  66. Mercer CountyGEOID 17131
  67. Monroe CountyGEOID 17133
  68. Montgomery CountyGEOID 17135
  69. Morgan CountyGEOID 17137
  70. Moultrie CountyGEOID 17139
  71. Ogle CountyGEOID 17141
  72. Peoria CountyGEOID 17143
  73. Perry CountyGEOID 17145
  74. Piatt CountyGEOID 17147
  75. Pike CountyGEOID 17149
  76. Pope CountyGEOID 17151
  77. Pulaski CountyGEOID 17153
  78. Putnam CountyGEOID 17155
  79. Randolph CountyGEOID 17157
  80. Richland CountyGEOID 17159
  81. Rock Island CountyGEOID 17161
  82. Saline CountyGEOID 17165
  83. Sangamon CountyGEOID 17167
  84. Schuyler CountyGEOID 17169
  85. Scott CountyGEOID 17171
  86. Shelby CountyGEOID 17173
  87. St. Clair CountyGEOID 17163
  88. Stark CountyGEOID 17175
  89. Stephenson CountyGEOID 17177
  90. Tazewell CountyGEOID 17179
  91. Union CountyGEOID 17181
  92. Vermilion CountyGEOID 17183
  93. Wabash CountyGEOID 17185
  94. Warren CountyGEOID 17187
  95. Washington CountyGEOID 17189
  96. Wayne CountyGEOID 17191
  97. White CountyGEOID 17193
  98. Whiteside CountyGEOID 17195
  99. Will CountyGEOID 17197
  100. Williamson CountyGEOID 17199
  101. Winnebago CountyGEOID 17201
  102. Woodford CountyGEOID 17203

U.S. Census Bureau · 2025 Cartographic Boundary Files

COMMON QUESTIONS

Illinois county map questions.

Can I color Chicago independently of Cook County?

The map selects Cook County as a whole. To map Chicago’s city limits or neighborhoods, use geography and data defined at those levels.

Which codes distinguish Cook, DuPage and Kendall?

Cook is 17031, DuPage is 17043, and Kendall is 17093. Keep the five characters together in your join column.

How do I highlight the Chicago region?

Choose the counties included in your definition of the region, then group and style their individual features. The map does not define a single Chicagoland boundary.

What does the Illinois income map measure?

It shows the estimated median household income for each entire county, in 2024 dollars. Areas beyond its largest city contribute to that estimate.

Why is Kendall a different color from Cook on the migration map?

Kendall had a positive net domestic migration rate and Cook had a negative one for July 2024 to July 2025. The classes split losses from gains at zero.

How should I compare Illinois and Missouri counties in one export?

Use the national county editor and five-digit GEOIDs so counties on both sides of the Mississippi can appear in the same map.

YOUR NEXT MAP STARTS HERE

Put your Illinois county data on the map.

Build a Chicago-area comparison or a statewide overview. Bring county values, add a source and export the map.

Create an Illinois map