MapSculpt

EUROPEAN UNION / 27 MEMBER STATESEUROPEAN UNION / EU-27

Create and Color a Map of the 27 EU Countries

Customize every EU member state, visualize European statistics, add a legend and download a polished PNG map for presentations, reports or data visualizations.Color all 27 member states, add a legend and download your map as a high-resolution PNG.

Create My EU Map

Free online tool · No design experience required

MAP EXAMPLE / EU-27CUSTOM EU-27 MAP

27 editable countries. Illustrative palette · All 27 EU countries
27 editable countries27 countriesCustom colors and legendsCustom colors
Illustrative palette · All 27 EU countriesIllustrative colors · MapSculpt

MADE WITH MAPSCULPT / EXAMPLESMAPS FOR YOUR PROJECTS

One Map. Four Ways to Explore the EU.Four Ways to Explore the EU.

From economic indicators to euro-area membership and personal travel, explore how you can visualize the European Union.GDP, government debt, the euro area and travel.

EXAMPLE MAP / EURO AREAEXAMPLE / EURO AREA

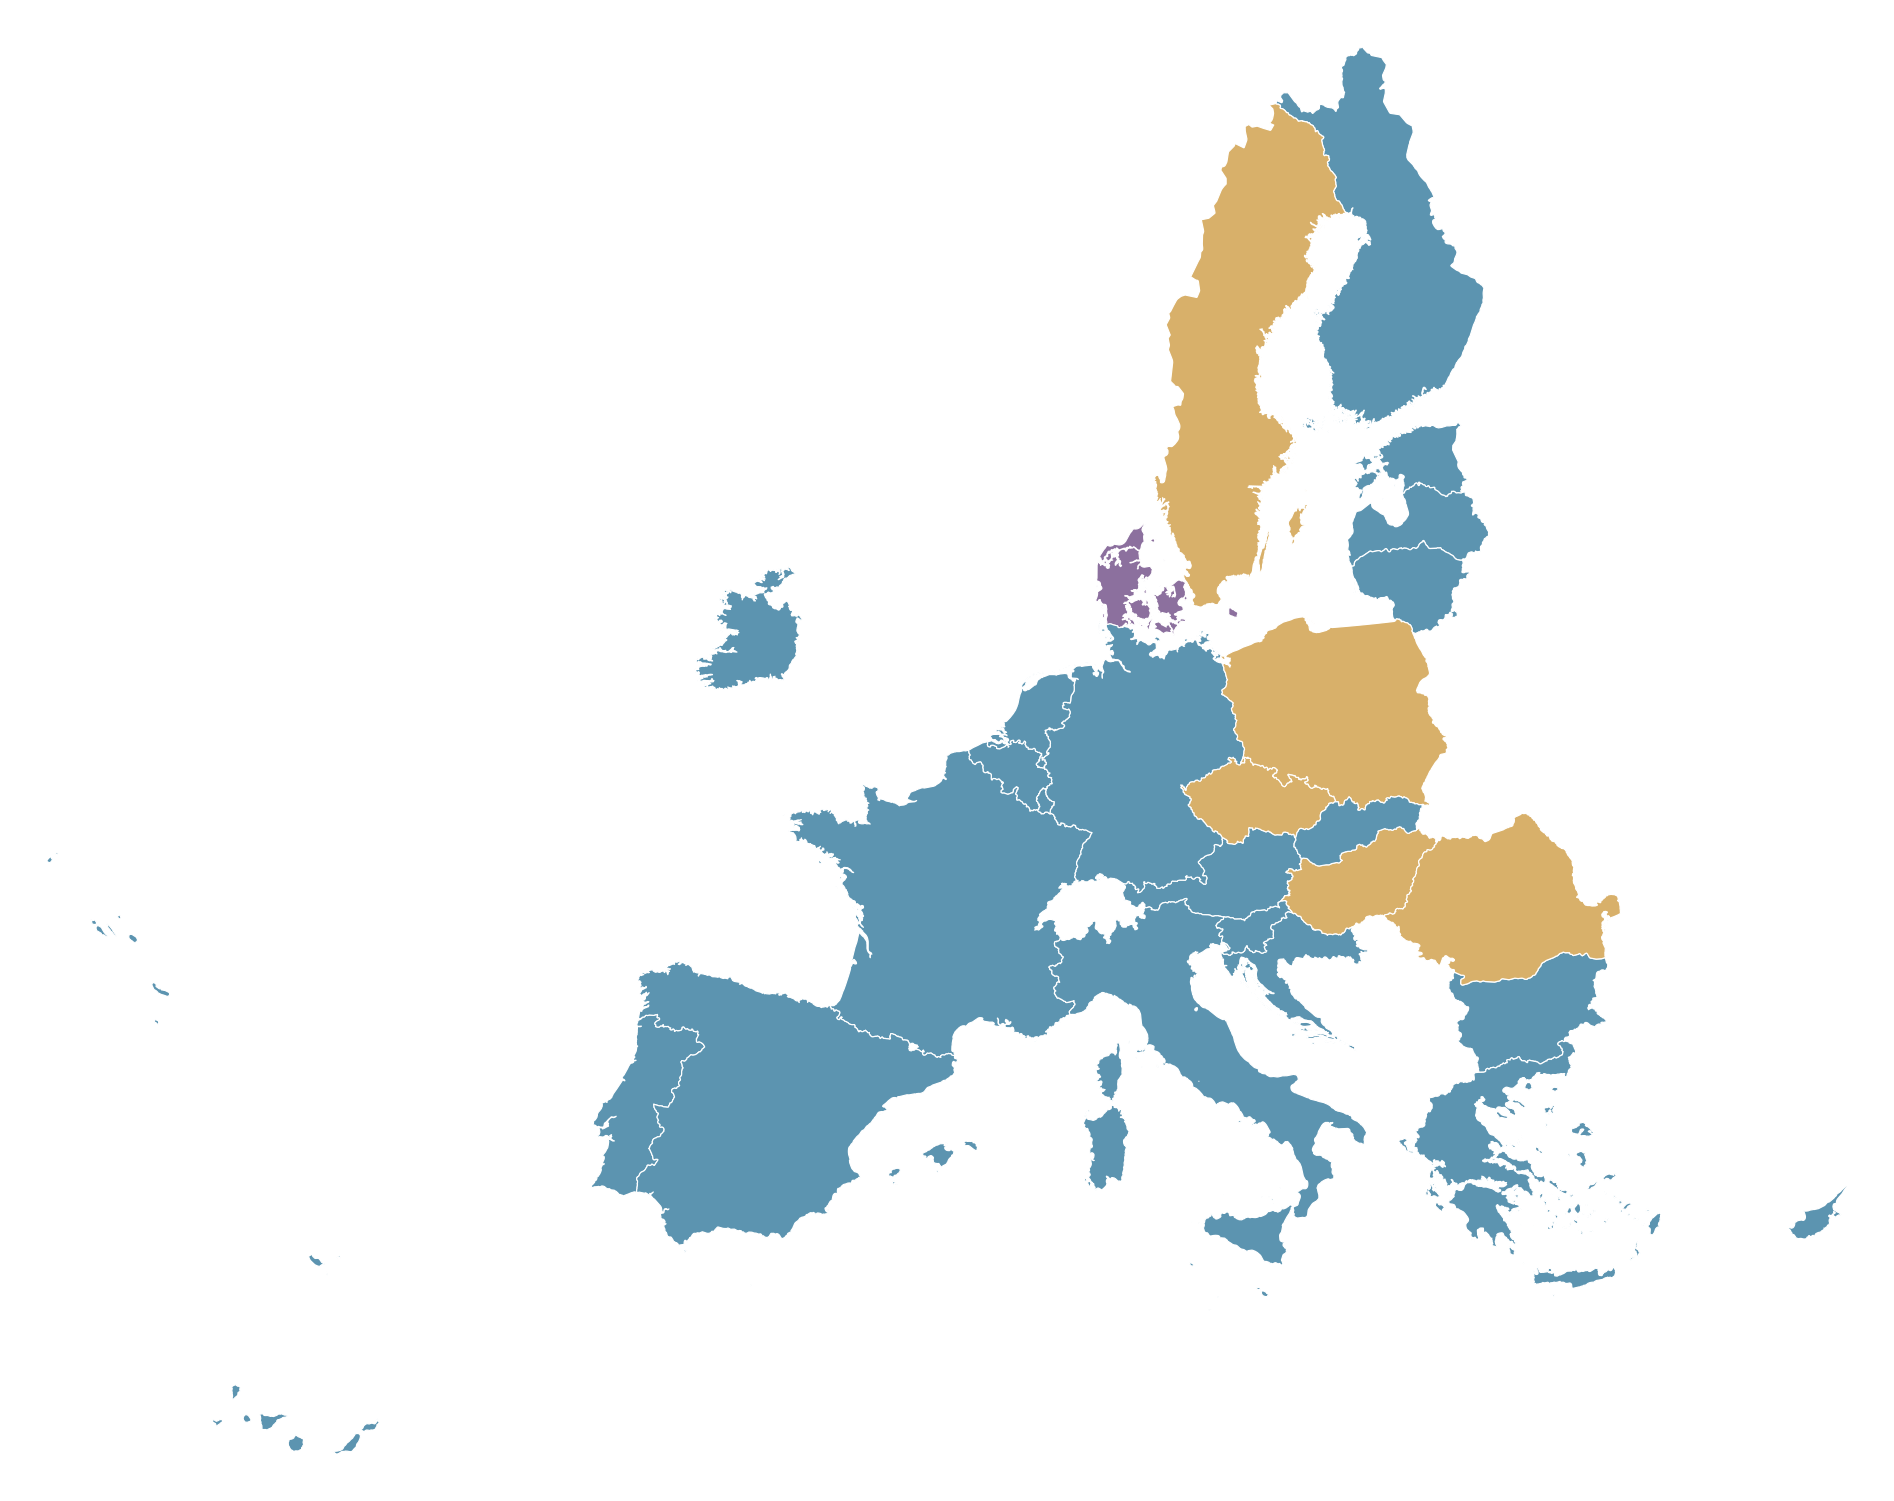
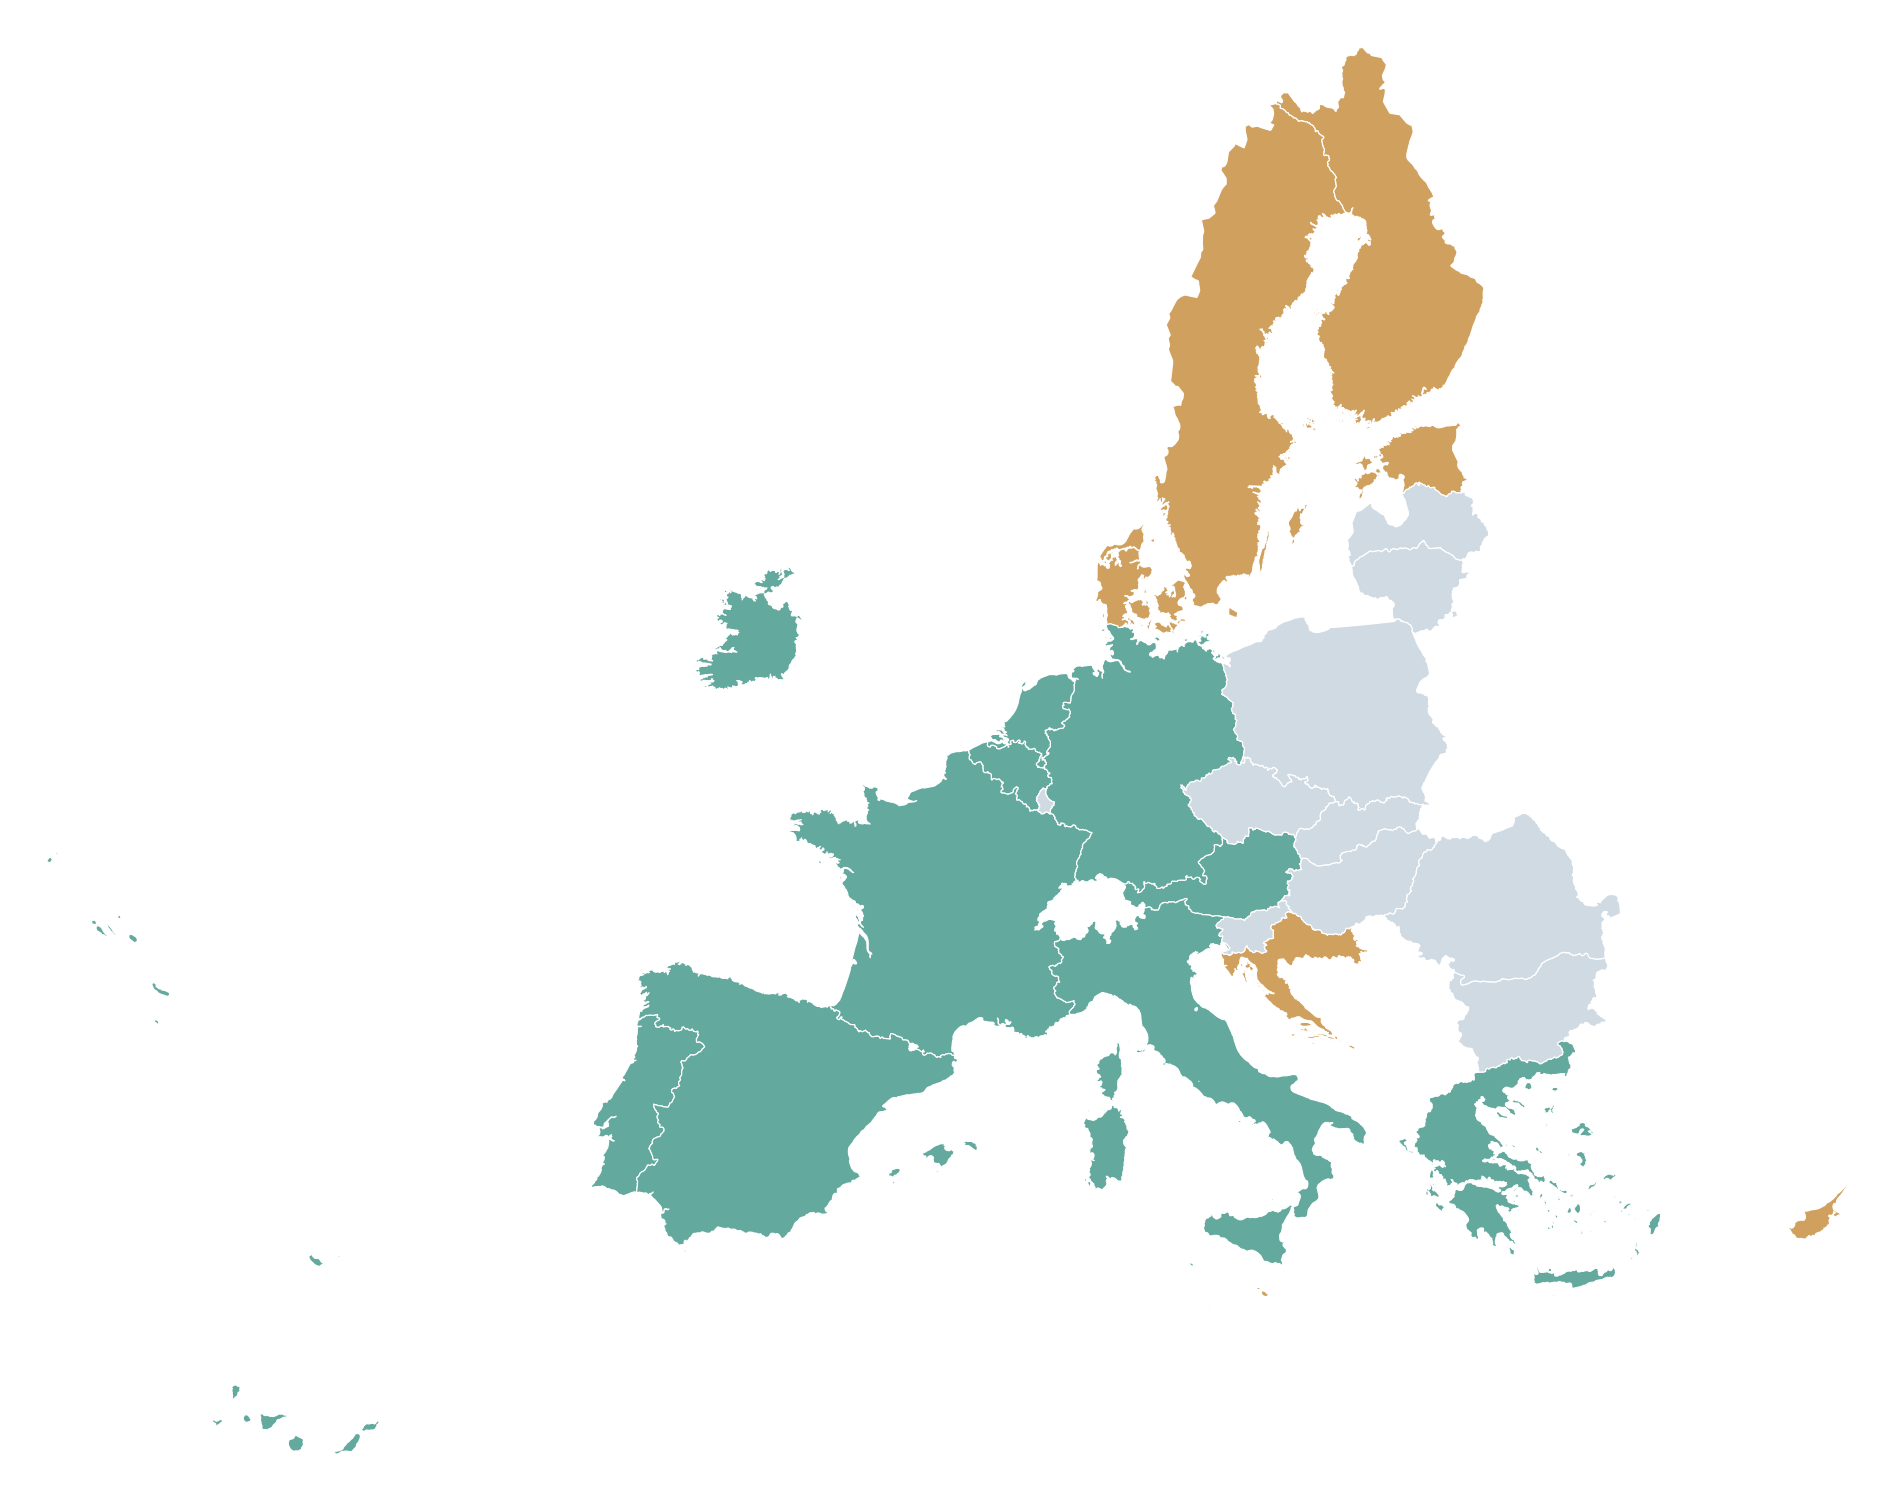
Which EU Countries Use the Euro? (2026). Bulgaria joined in 2026; five countries have yet to adopt the euro, and Denmark has a formal opt-out.
  • Euro area · 21
  • Not adopted · 5
  • Denmark · opt-out

Which EU Countries Use the Euro? (2026)Which EU Countries Use the Euro?

Bulgaria joined in 2026; five countries have yet to adopt the euro, and Denmark has a formal opt-out.21 of 27 members use the euro in 2026.

Source: European Commission · 2026

Create a Eurozone Map

EXAMPLE MAP / TRAVELEXAMPLE / TRAVEL

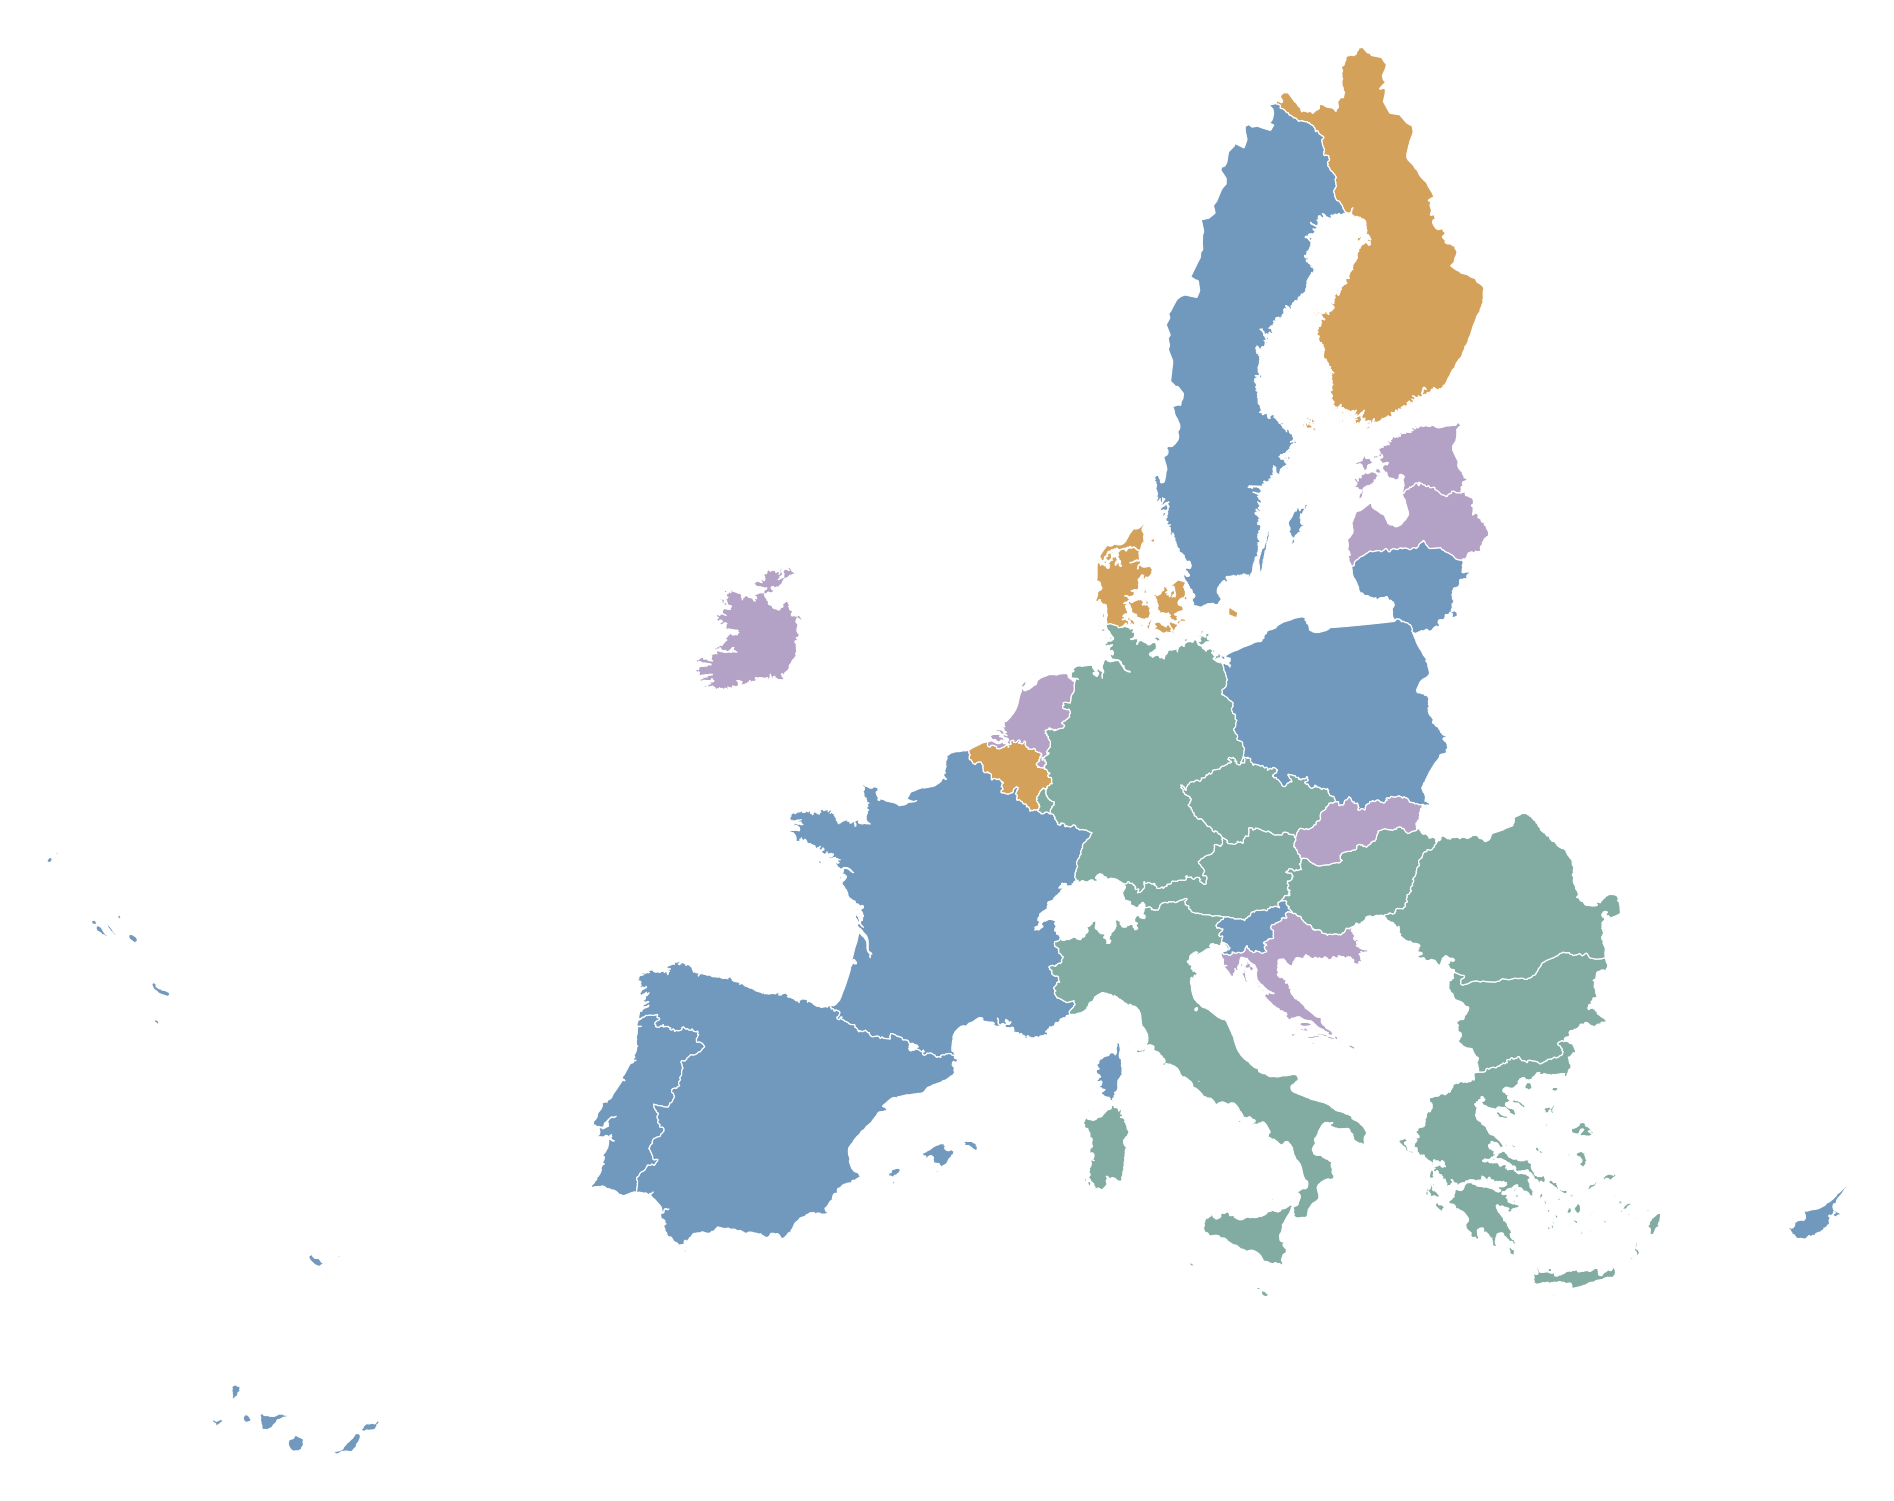
EU Countries I've Visited. Make a personal map of where you've been and where you'd like to go.
  • Visited
  • Want to visit
  • Not yet visited

EU Countries I've Visited

Make a personal map of where you've been and where you'd like to go.Customize a map of your travels.

Illustrative example · Not actual travel dataIllustrative example · Fictional

Create My Travel Map

EU ECONOMIC DATA / 2025

How Much Government Debt Do EU Countries Have?

Compare government debt as a share of GDP across the EU's 27 member states, using official Eurostat data.Compare the share of government debt in each EU economy.

Government debt-to-GDP compares the outstanding debt of general government with the size of an economy. It is different from the annual government deficit.

EU ECONOMIC DATA / 2025

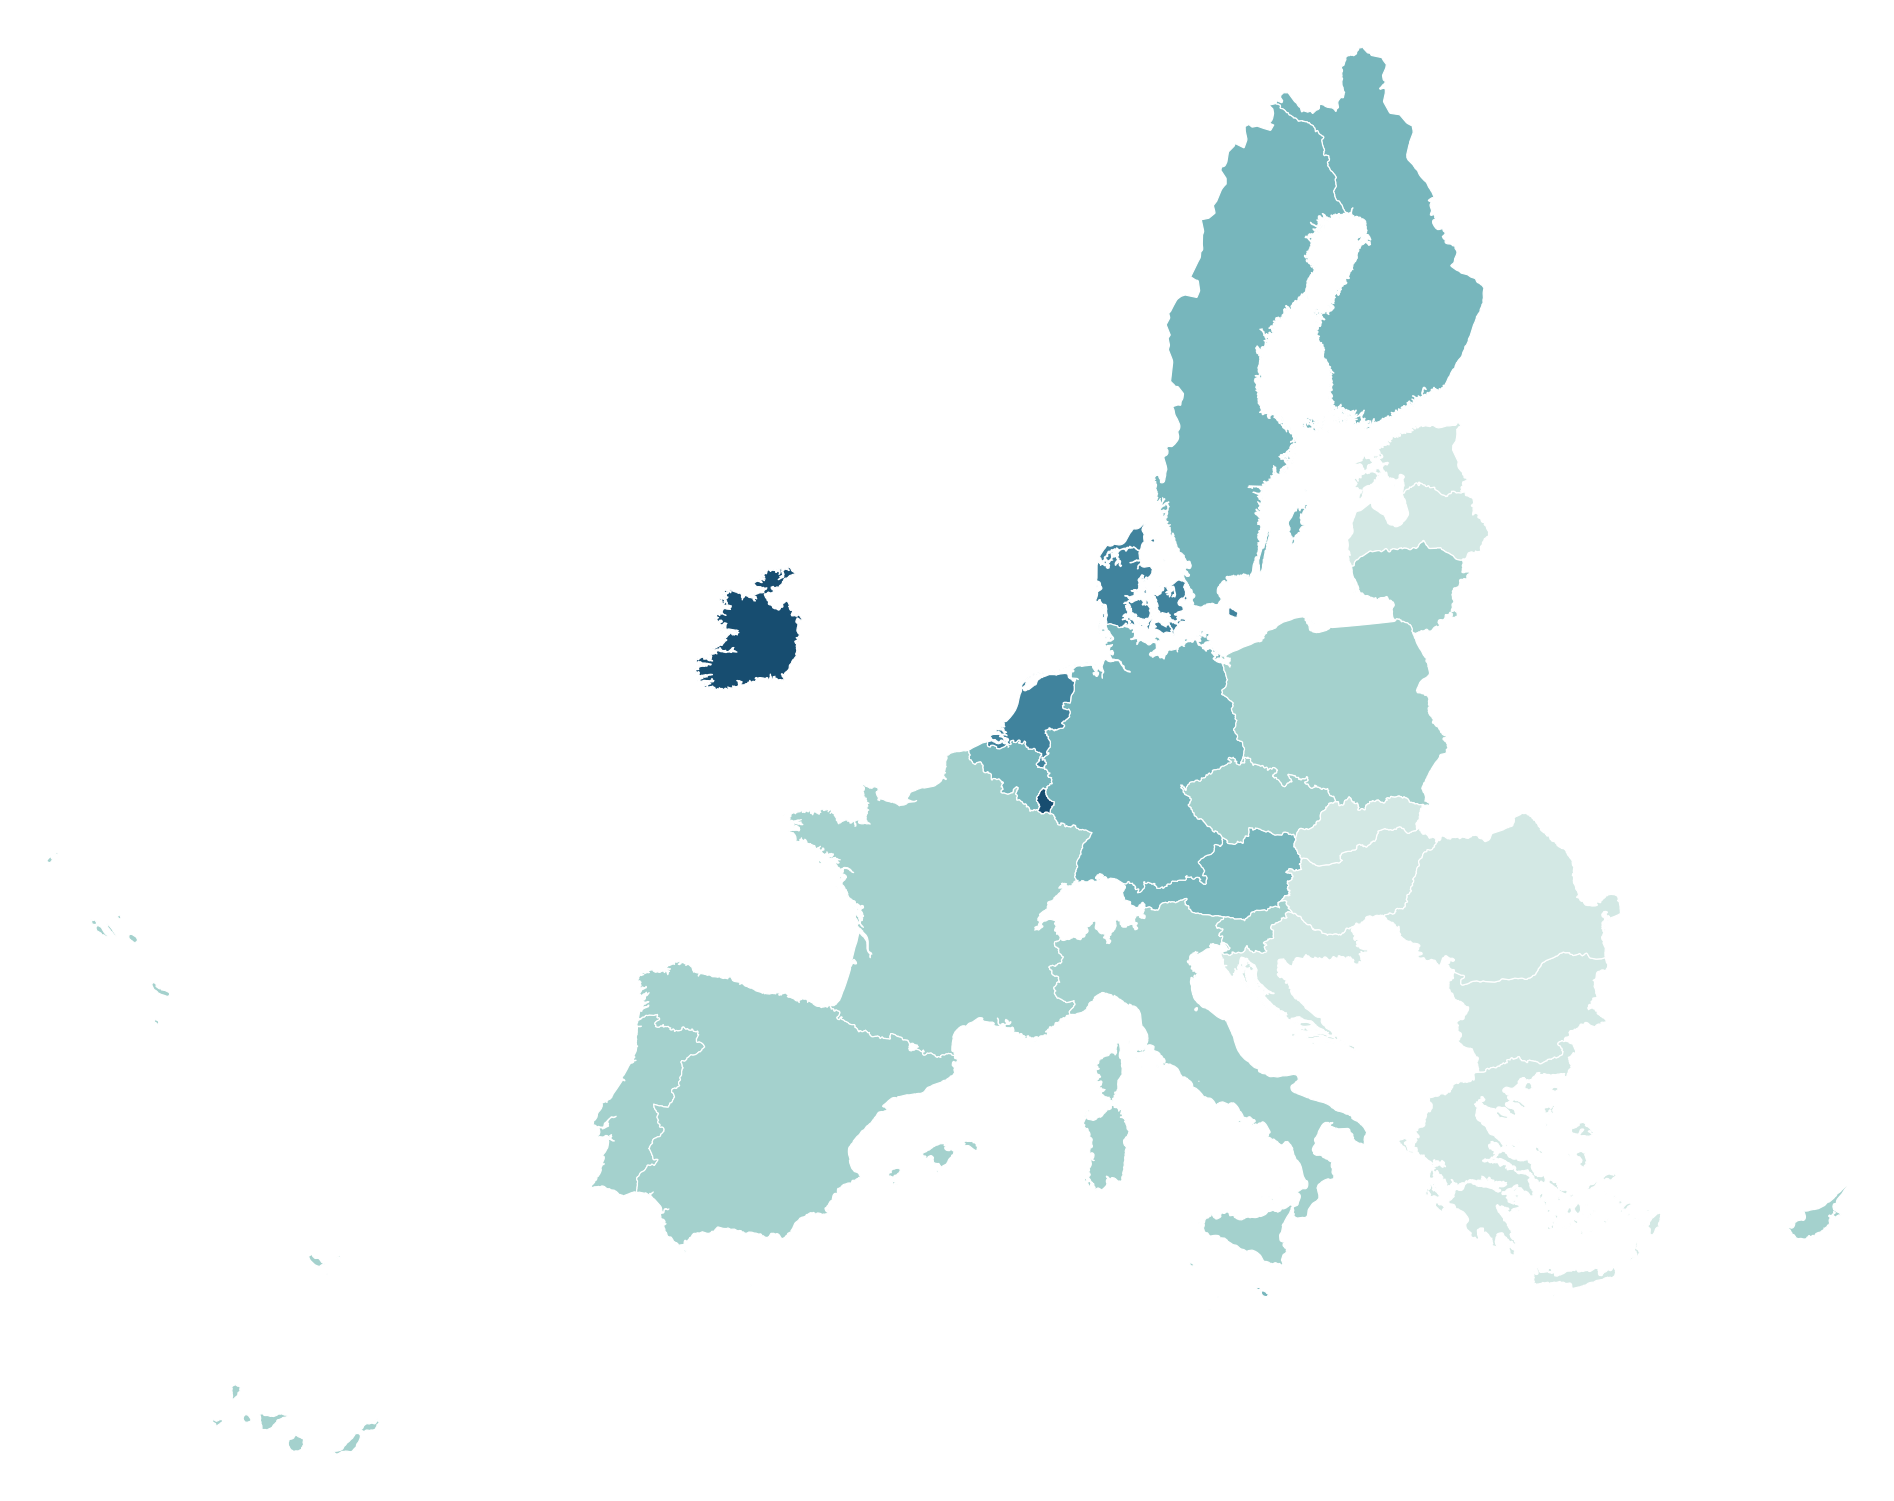
Government Debt as a % of GDP (2025). Annual general government gross debt relative to economic output, by EU country.
  • Below 40%
  • 40–59.9%
  • 60–79.9%
  • 80–99.9%
  • 100–129.9%
  • 130%+
Government debt-to-GDP · six classes
Greece
145.4%Debt-to-GDP · 2025
EU aggregate
81.5%Debt-to-GDP · 2025
Estonia
24.0%Debt-to-GDP · 2025

Debt-to-GDP compares outstanding public debt to economic output. This is different from the annual government deficit.

Source: Eurostat · General government gross debt · 2025 (Oct 2026 revision).Source: Eurostat · Oct 2026 revision

Create a Government Debt Map

HOW IT WORKS

How to Create Your Own EU Countries MapHow to Create Your EU Countries Map

Choose the EU-27 map, customize country colors, add context and download a high-resolution PNG.

  1. 01

    Open the EU Map

    Start with the 27 European Union member states in MapSculpt.Start with all 27 member states.

  2. 02

    Color the CountriesColor Countries

    Apply individual colors or organize countries into meaningful categories.Apply colors or categories.

  3. 03

    Add Context

    Include a title, legend and data source to explain your map.Include a title, legend and source.

  4. 04

    Download Your MapDownload PNG

    Export a high-resolution PNG for reports, presentations or online posts.Export a high-resolution map.

MAKE IT YOUR OWNEDITOR FEATURES

Customize Every Detail of Your EU Map.Customize Every Detail.

Color Every Member StateColor All Countries

Individually customize all 27 EU countries.27 countries, your own palette.

Categories and Legends

Create meaningful color groups and explain them with a clear legend.Explain your country groupings.

Titles and Sources

Add the information people need to understand your map.Give your map clear context.

Editorial Map Styles

Choose a professional style suited to presentations and publication.Choose a polished map style.

Statistical VisualizationsStatistical Maps

Create comparisons using data from reliable sources.Visualize comparable country data.

High-Resolution PNG

Download maps for reports, slides, websites and social media.Export for posts or presentations.

THE DATA BEHIND THE MAPSSTATISTICAL METHODS

Explore the Statistics Behind Each EU Map.How to Read the EU Maps

Understand the indicators used in the examples, their reference years, and how each color band is defined.GDP per capita uses PPS, with EU = 100. Government debt measures the outstanding debt of general government relative to GDP.

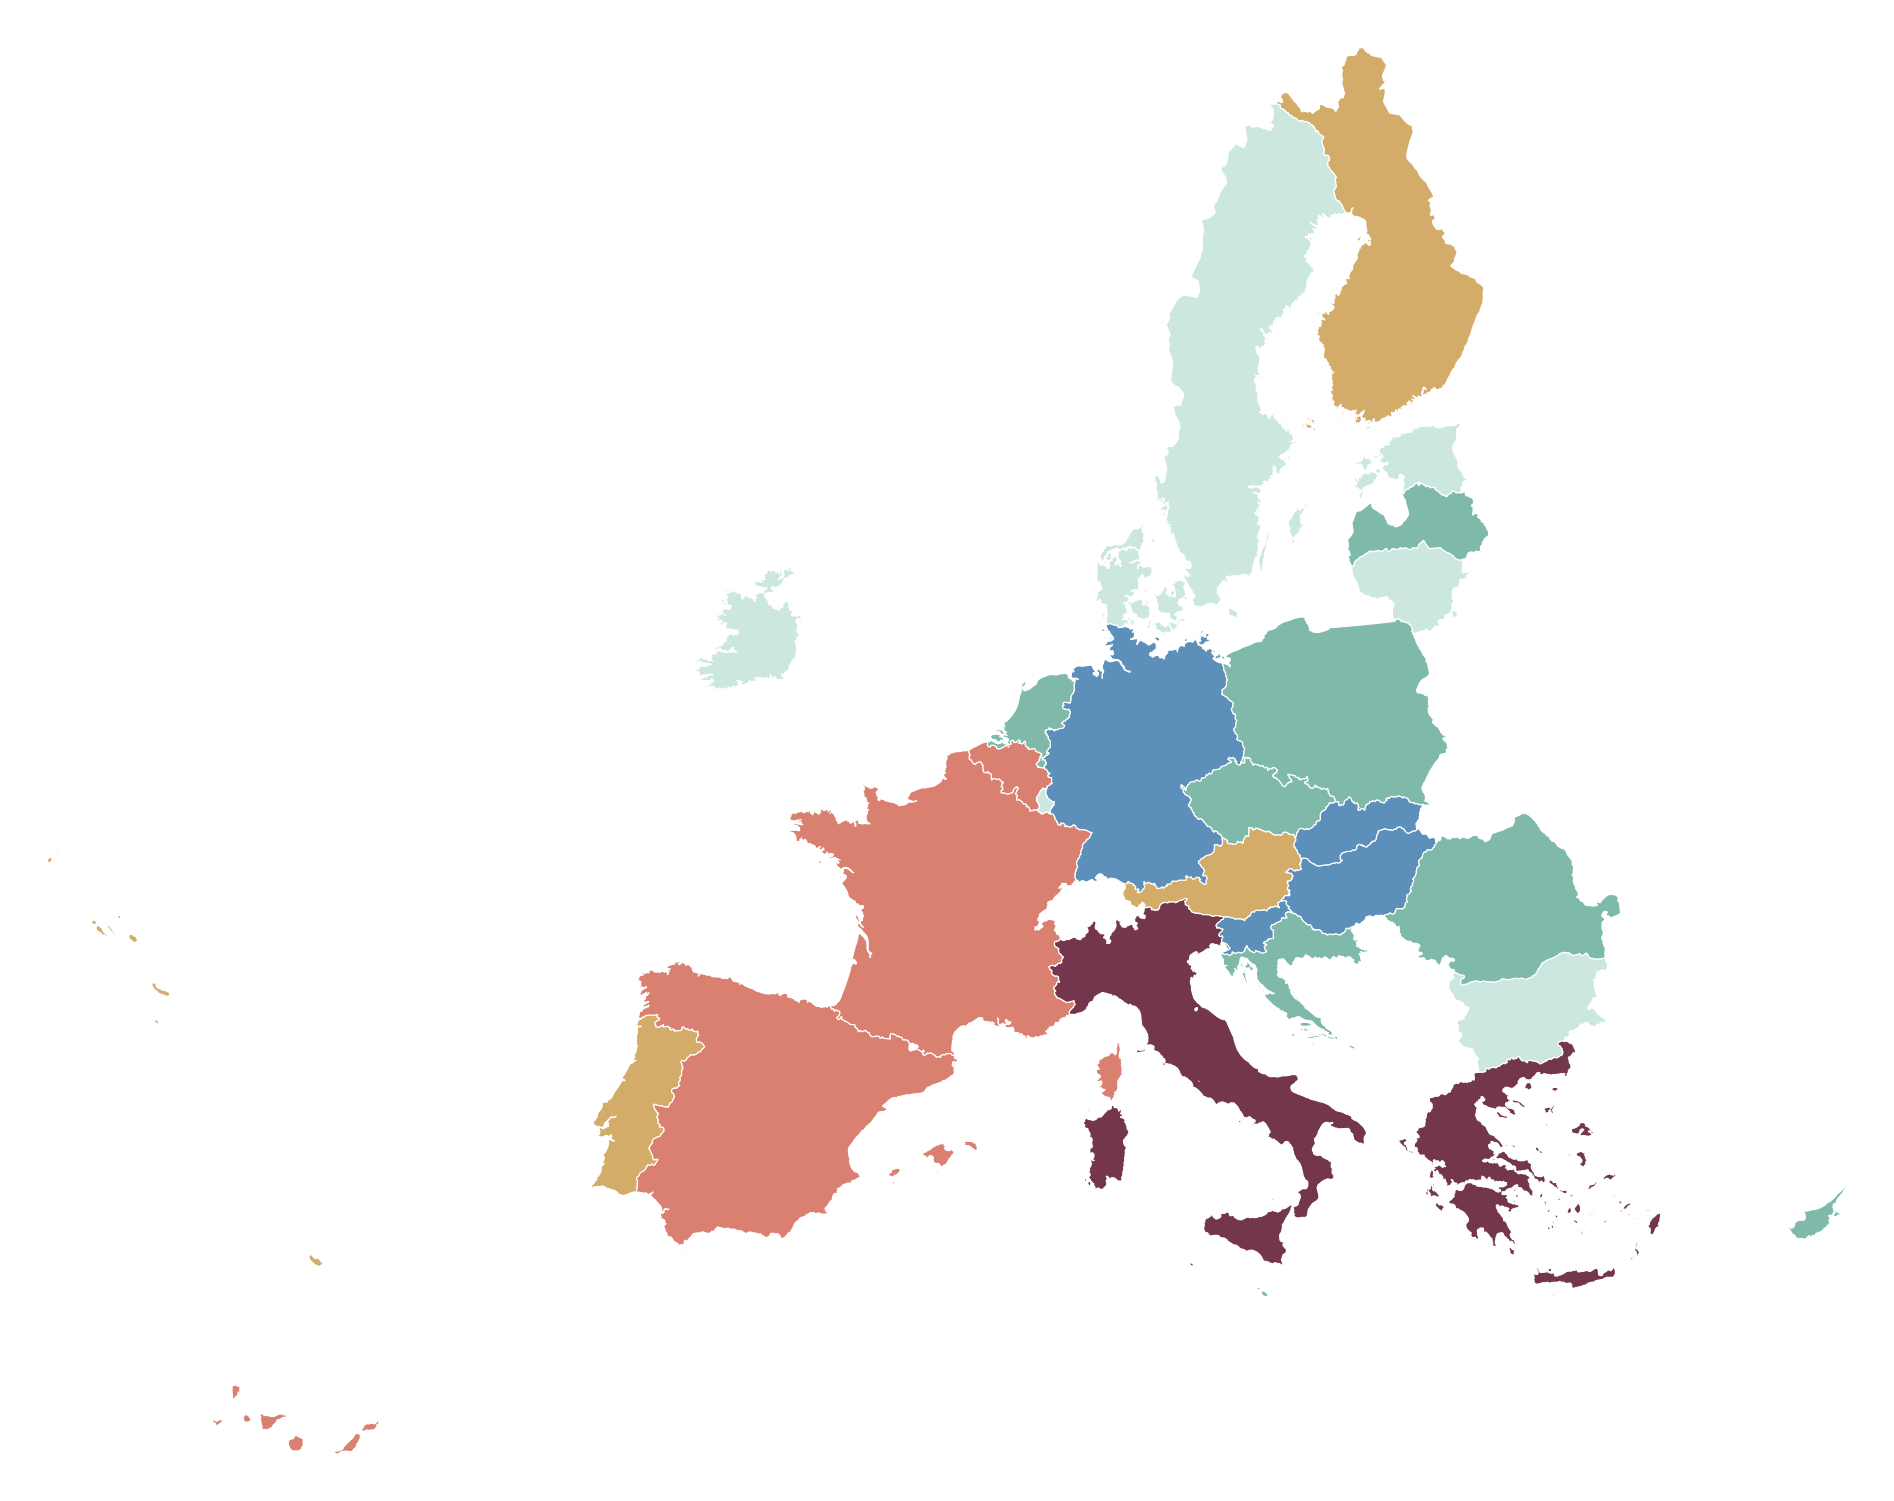
GDP PER CAPITA IN PPS

EU average = 100 · 2025

Purchasing power standards adjust for price differences between countries. A value of 120 means GDP per person is 20% above the EU level.

This index is not a salary or household disposable income measure.

Source: Eurostat · tec00114 · 2025

GOVERNMENT DEBT / GDP

2025 annual gross government debt

Compare the outstanding general government debt relative to each country's economic output, expressed as a percentage.

Government debt is a stock; the annual deficit is a flow.

EU TREATY REFERENCE

60% of GDP

Treaty reference value

NOT AN AUTOMATIC PENALTY

Exceeding 60% does not itself trigger an automatic sanction.The debt reference value of 60% is not an automatic penalty threshold.

Sources: Eurostat · prc_ppp_ind_1 / tec00114 · gov_10dd_edpt1

This index is not a salary or household disposable income measure.

The debt reference value of 60% is not an automatic penalty threshold.

Source: Eurostat · tec00114 · 2025

Source: Eurostat · Oct 2026 revision

EUROPEAN UNION / GEOGRAPHIC COVERAGECOVERAGE

All 27 EU Member StatesAll 27 EU Countries

Every country in this map belongs to the European Union. The EU-27 map is not a map of every country in geographical Europe.Every EU member state is included; non-EU countries are not selectable.

MAP COVERAGE

27 individually editable countries

Color every member state, from Portugal and Ireland to Finland, Cyprus and Malta.Includes Malta and Cyprus.

Norway, Switzerland, Iceland and the United Kingdom are not EU members and are not selectable here.

WHAT THIS MAP INCLUDES

EU member states
27 countries
Euro-area members
21 countries
Outside the euro area
6 countries
Editable countries
All 27

Source: MapSculpt · Production EU Countries geometry

Includes Malta and Cyprus.

27 editable countries

EU-27 · complete member-state set

Source: MapSculpt · Production EU Countries geometry

EUROPEAN UNION / MEMBER STATESEUROPEAN UNION

The 27 Countries of the European UnionThe 27 EU Member States

Explore all EU-27 member states and their 2026 euro-area status. Every country is individually editable in the MapSculpt template.Country names, ISO codes and euro-area status.

MEMBER STATES

27 countries · ISO codes and currency status27 countries · 2026

  • Austria · ATEuro areaGDP per capita · PPS index · EU=100: 118. Government Debt as a % of GDP (2025): 80.7%.
  • Belgium · BEEuro areaGDP per capita · PPS index · EU=100: 114. Government Debt as a % of GDP (2025): 108.1%.
  • Bulgaria · BGEuro area · since 2026GDP per capita · PPS index · EU=100: 68. Government Debt as a % of GDP (2025): 29.9%.
  • Croatia · HREuro areaGDP per capita · PPS index · EU=100: 78. Government Debt as a % of GDP (2025): 55.7%.
  • Cyprus · CYEuro areaGDP per capita · PPS index · EU=100: 98. Government Debt as a % of GDP (2025): 52.3%.
  • Czechia · CZNot yet adoptedGDP per capita · PPS index · EU=100: 92. Government Debt as a % of GDP (2025): 44.2%.
  • Denmark · DKFormal opt-outGDP per capita · PPS index · EU=100: 127. Government Debt as a % of GDP (2025): 27.2%.
  • Estonia · EEEuro areaGDP per capita · PPS index · EU=100: 79. Government Debt as a % of GDP (2025): 24.0%.
  • Finland · FIEuro areaGDP per capita · PPS index · EU=100: 101. Government Debt as a % of GDP (2025): 88.4%.
  • France · FREuro areaGDP per capita · PPS index · EU=100: 98. Government Debt as a % of GDP (2025): 115.7%.
  • Germany · DEEuro areaGDP per capita · PPS index · EU=100: 115. Government Debt as a % of GDP (2025): 62.8%.
  • Greece · GREuro areaGDP per capita · PPS index · EU=100: 68. Government Debt as a % of GDP (2025): 145.4%.
  • Hungary · HUNot yet adoptedGDP per capita · PPS index · EU=100: 76. Government Debt as a % of GDP (2025): 74.4%.
  • Ireland · IEEuro areaGDP per capita · PPS index · EU=100: 238. Government Debt as a % of GDP (2025): 34.8%.
  • Italy · ITEuro areaGDP per capita · PPS index · EU=100: 96. Government Debt as a % of GDP (2025): 136.7%.
  • Latvia · LVEuro areaGDP per capita · PPS index · EU=100: 71. Government Debt as a % of GDP (2025): 46.2%.
  • Lithuania · LTEuro areaGDP per capita · PPS index · EU=100: 87. Government Debt as a % of GDP (2025): 39.3%.
  • Luxembourg · LUEuro areaGDP per capita · PPS index · EU=100: 239. Government Debt as a % of GDP (2025): 26.0%.
  • Malta · MTEuro areaGDP per capita · PPS index · EU=100: 110. Government Debt as a % of GDP (2025): 46.3%.
  • Netherlands · NLEuro areaGDP per capita · PPS index · EU=100: 133. Government Debt as a % of GDP (2025): 44.7%.
  • Poland · PLNot yet adoptedGDP per capita · PPS index · EU=100: 81. Government Debt as a % of GDP (2025): 59.6%.
  • Portugal · PTEuro areaGDP per capita · PPS index · EU=100: 81. Government Debt as a % of GDP (2025): 89.2%.
  • Romania · RONot yet adoptedGDP per capita · PPS index · EU=100: 78. Government Debt as a % of GDP (2025): 58.9%.
  • Slovakia · SKEuro areaGDP per capita · PPS index · EU=100: 75. Government Debt as a % of GDP (2025): 60.5%.
  • Slovenia · SIEuro areaGDP per capita · PPS index · EU=100: 90. Government Debt as a % of GDP (2025): 65.1%.
  • Spain · ESEuro areaGDP per capita · PPS index · EU=100: 92. Government Debt as a % of GDP (2025): 100.5%.
  • Sweden · SENot yet adoptedGDP per capita · PPS index · EU=100: 111. Government Debt as a % of GDP (2025): 35.1%.

EURO-AREA MEMBERSHIP

Three membership categories

Euro area
21 countries
Not yet adopted
5 countries
Formal opt-out
Denmark

UNDERSTANDING EUROPE

European Union, Euro Area or Europe?EU, Euro Area or Europe?

Three different geographic and institutional concepts. This editor shows the European Union's 27 member states.EU: 27 member states. Euro area: 21 EU countries using the euro in 2026.

EU MEMBER STATES

27 countries

The European Union is a political and economic union, with 27 members.

Norway, Switzerland, Iceland and the United Kingdom are not members.

MapSculpt · EU Countries template covers EU-27 only

EURO AREA

21 euro-area countries

Twenty-one EU members use the euro in 2026.

Six EU members outside the euro

Five have not yet adopted it; Denmark has a formal opt-out.

GEOGRAPHICAL EUROPE

Includes Norway, Iceland, Switzerland and the United Kingdom.

EU ≠ EURO AREA ≠ EUROPE

This editor includes only the 27 EU member states.

Europe also includes Norway, the UK, Iceland and Switzerland, which are not in the EU.

Five have not yet adopted it; Denmark has a formal opt-out.

27 countries · 21 euro-area countries

This editor includes only the 27 EU member states.

FREQUENTLY ASKED QUESTIONS

Frequently Asked Questions About EU MapsEU Map Questions

How can I create and color a map of EU countries?How can I color EU countries?

Open the EU-27 editor, select and color individual member states, add a legend and title, then download the result as a PNG.Open the EU-27 editor, color countries, add a legend and download your PNG.

How many countries are in the European Union?How many EU countries are there?

The EU has 27 member states. MapSculpt's EU Countries template includes all 27, including Malta and Cyprus.There are 27 member states, all included in this map.

What's the difference between an EU map and a Europe map?How is the EU different from Europe?

The European Union is a political union of 27 countries. Geographical Europe also includes Norway, Switzerland, the United Kingdom and many other non-EU countries.Europe also includes countries outside the political union, such as Norway and the UK.

Can I create an EU GDP per capita map?Can I map EU GDP per capita?

Yes. Use a verified dataset, such as GDP per capita adjusted for purchasing power in PPS, to group and color countries. Label the year and EU average index.Yes. Color the countries with verified PPS index data, and explain the year and EU = 100.

How do I make an EU government debt-to-GDP map?Can I make a government debt map?

Classify each member state using official debt-to-GDP ratios, add a percentage legend and cite the data source. Debt is different from the annual deficit.Yes. Use official debt-to-GDP ratios, clear percentage bands and a cited data source.

Can I create maps for r/MapPorn, r/dataisbeautiful, r/europe and other Reddit communities?

Yes. MapSculpt lets you create custom maps for data visualizations, geographic comparisons and original map posts. You can color countries or regions using, for example, Eurostat data or other official sources, add a clear title, legend and source, and download your map as a high-resolution PNG.

For communities such as r/MapPorn, r/dataisbeautiful, r/europe and other subreddits, use accurate data, explain your methodology where needed, and check each community’s posting rules before submitting.

Can I show which EU countries use the euro?

Yes. Color the 21 euro-area members separately from the five countries that have not yet adopted the euro and Denmark, which has a formal opt-out.

Can I download my EU map for presentations or Reddit?

Yes. Export a high-resolution PNG with a clear title, legend and source. Check image readability and any community-specific posting requirements.

READY TO CREATE YOUR MAP?READY TO CREATE?

Create Your Own Map of the European Union.Create Your Own EU Map.

Color all 27 EU member states, customize your legend and download a high-resolution PNG map.Color all 27 countries, add a legend and download your PNG.

Create My EU Map