Skip to content
MapSculpt

GEOGRAPHIC MAP MAKER / MARYLAND

Maryland
Counties Map Maker

See county-level growth around the Chesapeake and compare it with domestic moves and household income. Baltimore city and Baltimore County remain separately selectable.

Free online editor · No sign-up required

24county-level units
individually editable

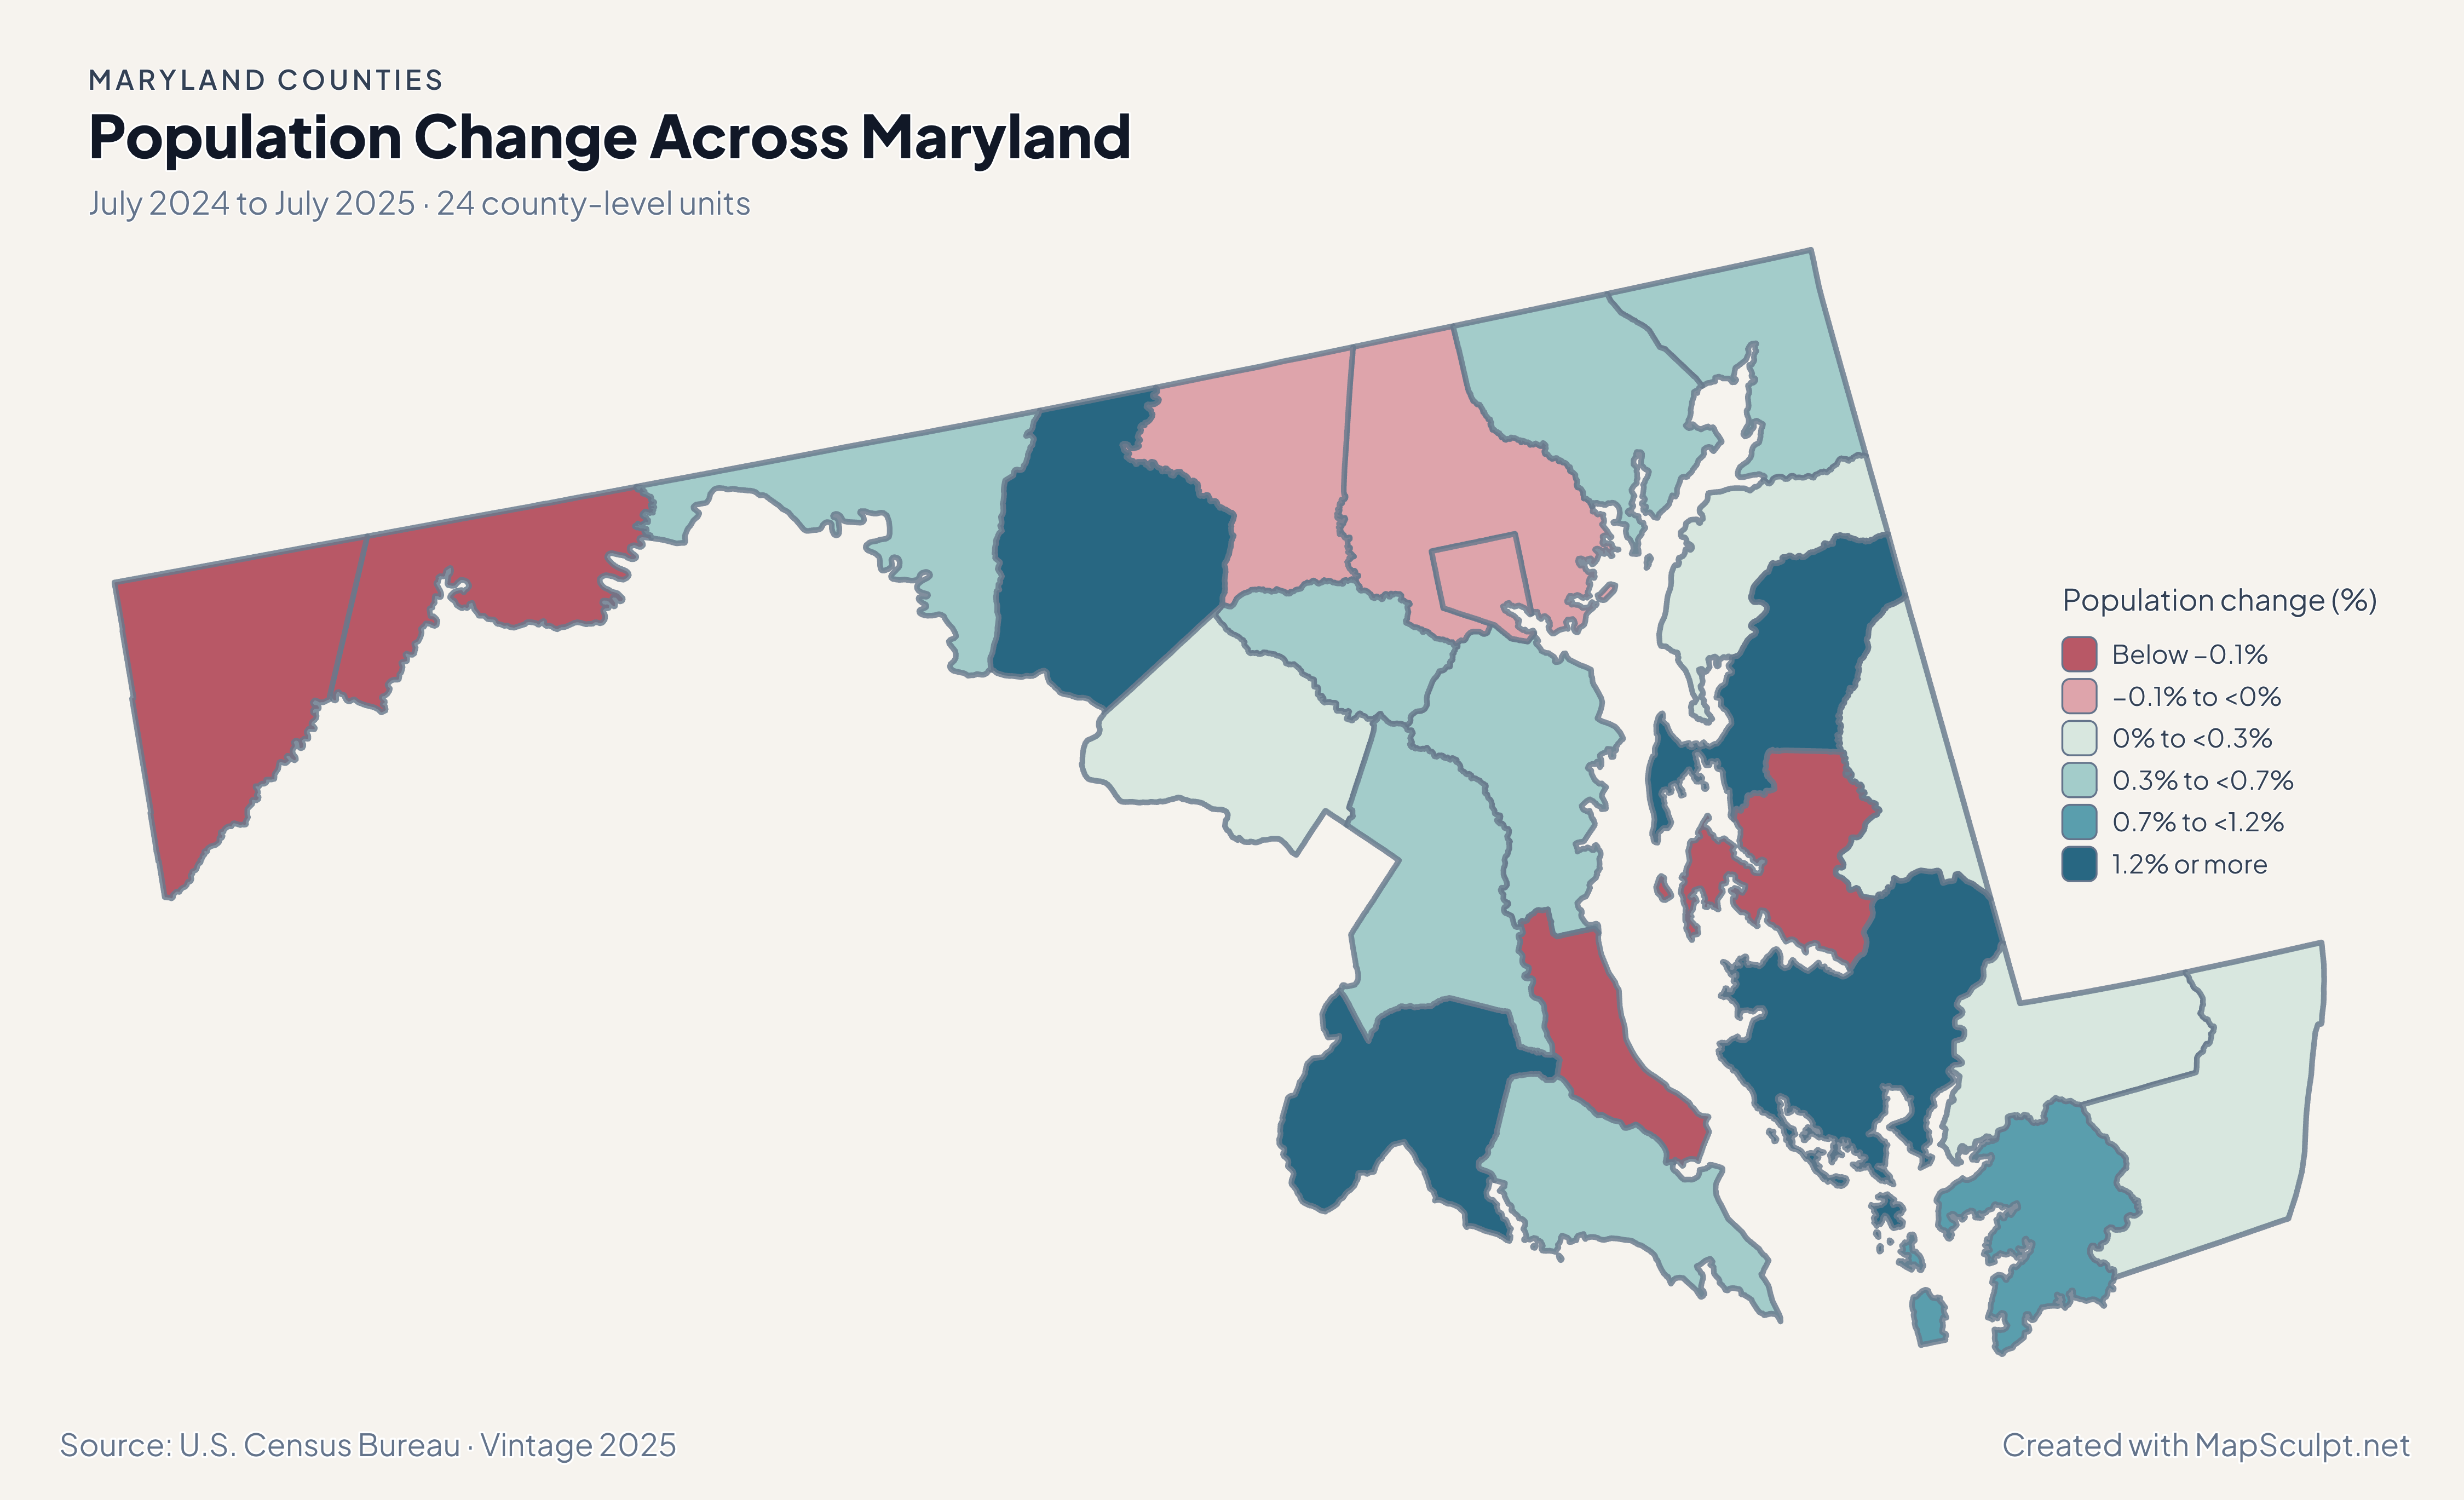
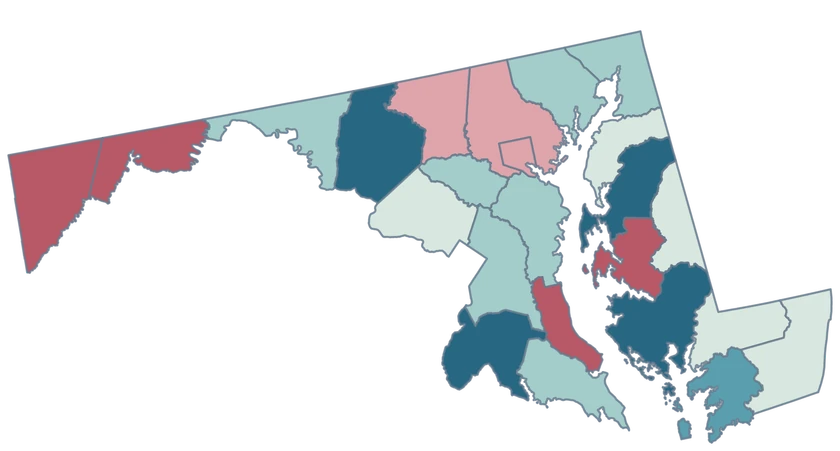
Population Change Across Maryland

July 2024 to July 2025 · 24 county-level units

Maryland population change map showing strong growth in Queen Anne’s, Frederick and Dorchester.

Population change (%)

  • Below −0.1%
  • −0.1% to <0%
  • 0% to <0.3%
  • 0.3% to <0.7%
  • 0.7% to <1.2%
  • 1.2% or more
U.S. Census Bureau · Vintage 2025Download complete PNG Change from each county-level unit’s own July 2024 population.

KNOW YOUR GEOGRAPHY

Counties around the Chesapeake plus Baltimore city

Maryland’s 23 counties and independent Baltimore city make 24 Census county-level units. Baltimore city uses GEOID 24510. Baltimore County, GEOID 24005, is a separate feature.

The statewide map covers western Maryland, the central corridor and the Eastern Shore. The generalized Chesapeake shoreline preserves major coastal features, with multipart geography tied to a single GEOID.

Browse all county GEOIDs ↗

2025 Census boundaries

OFFICIAL DATA

The fastest growth appears in several parts of the state.

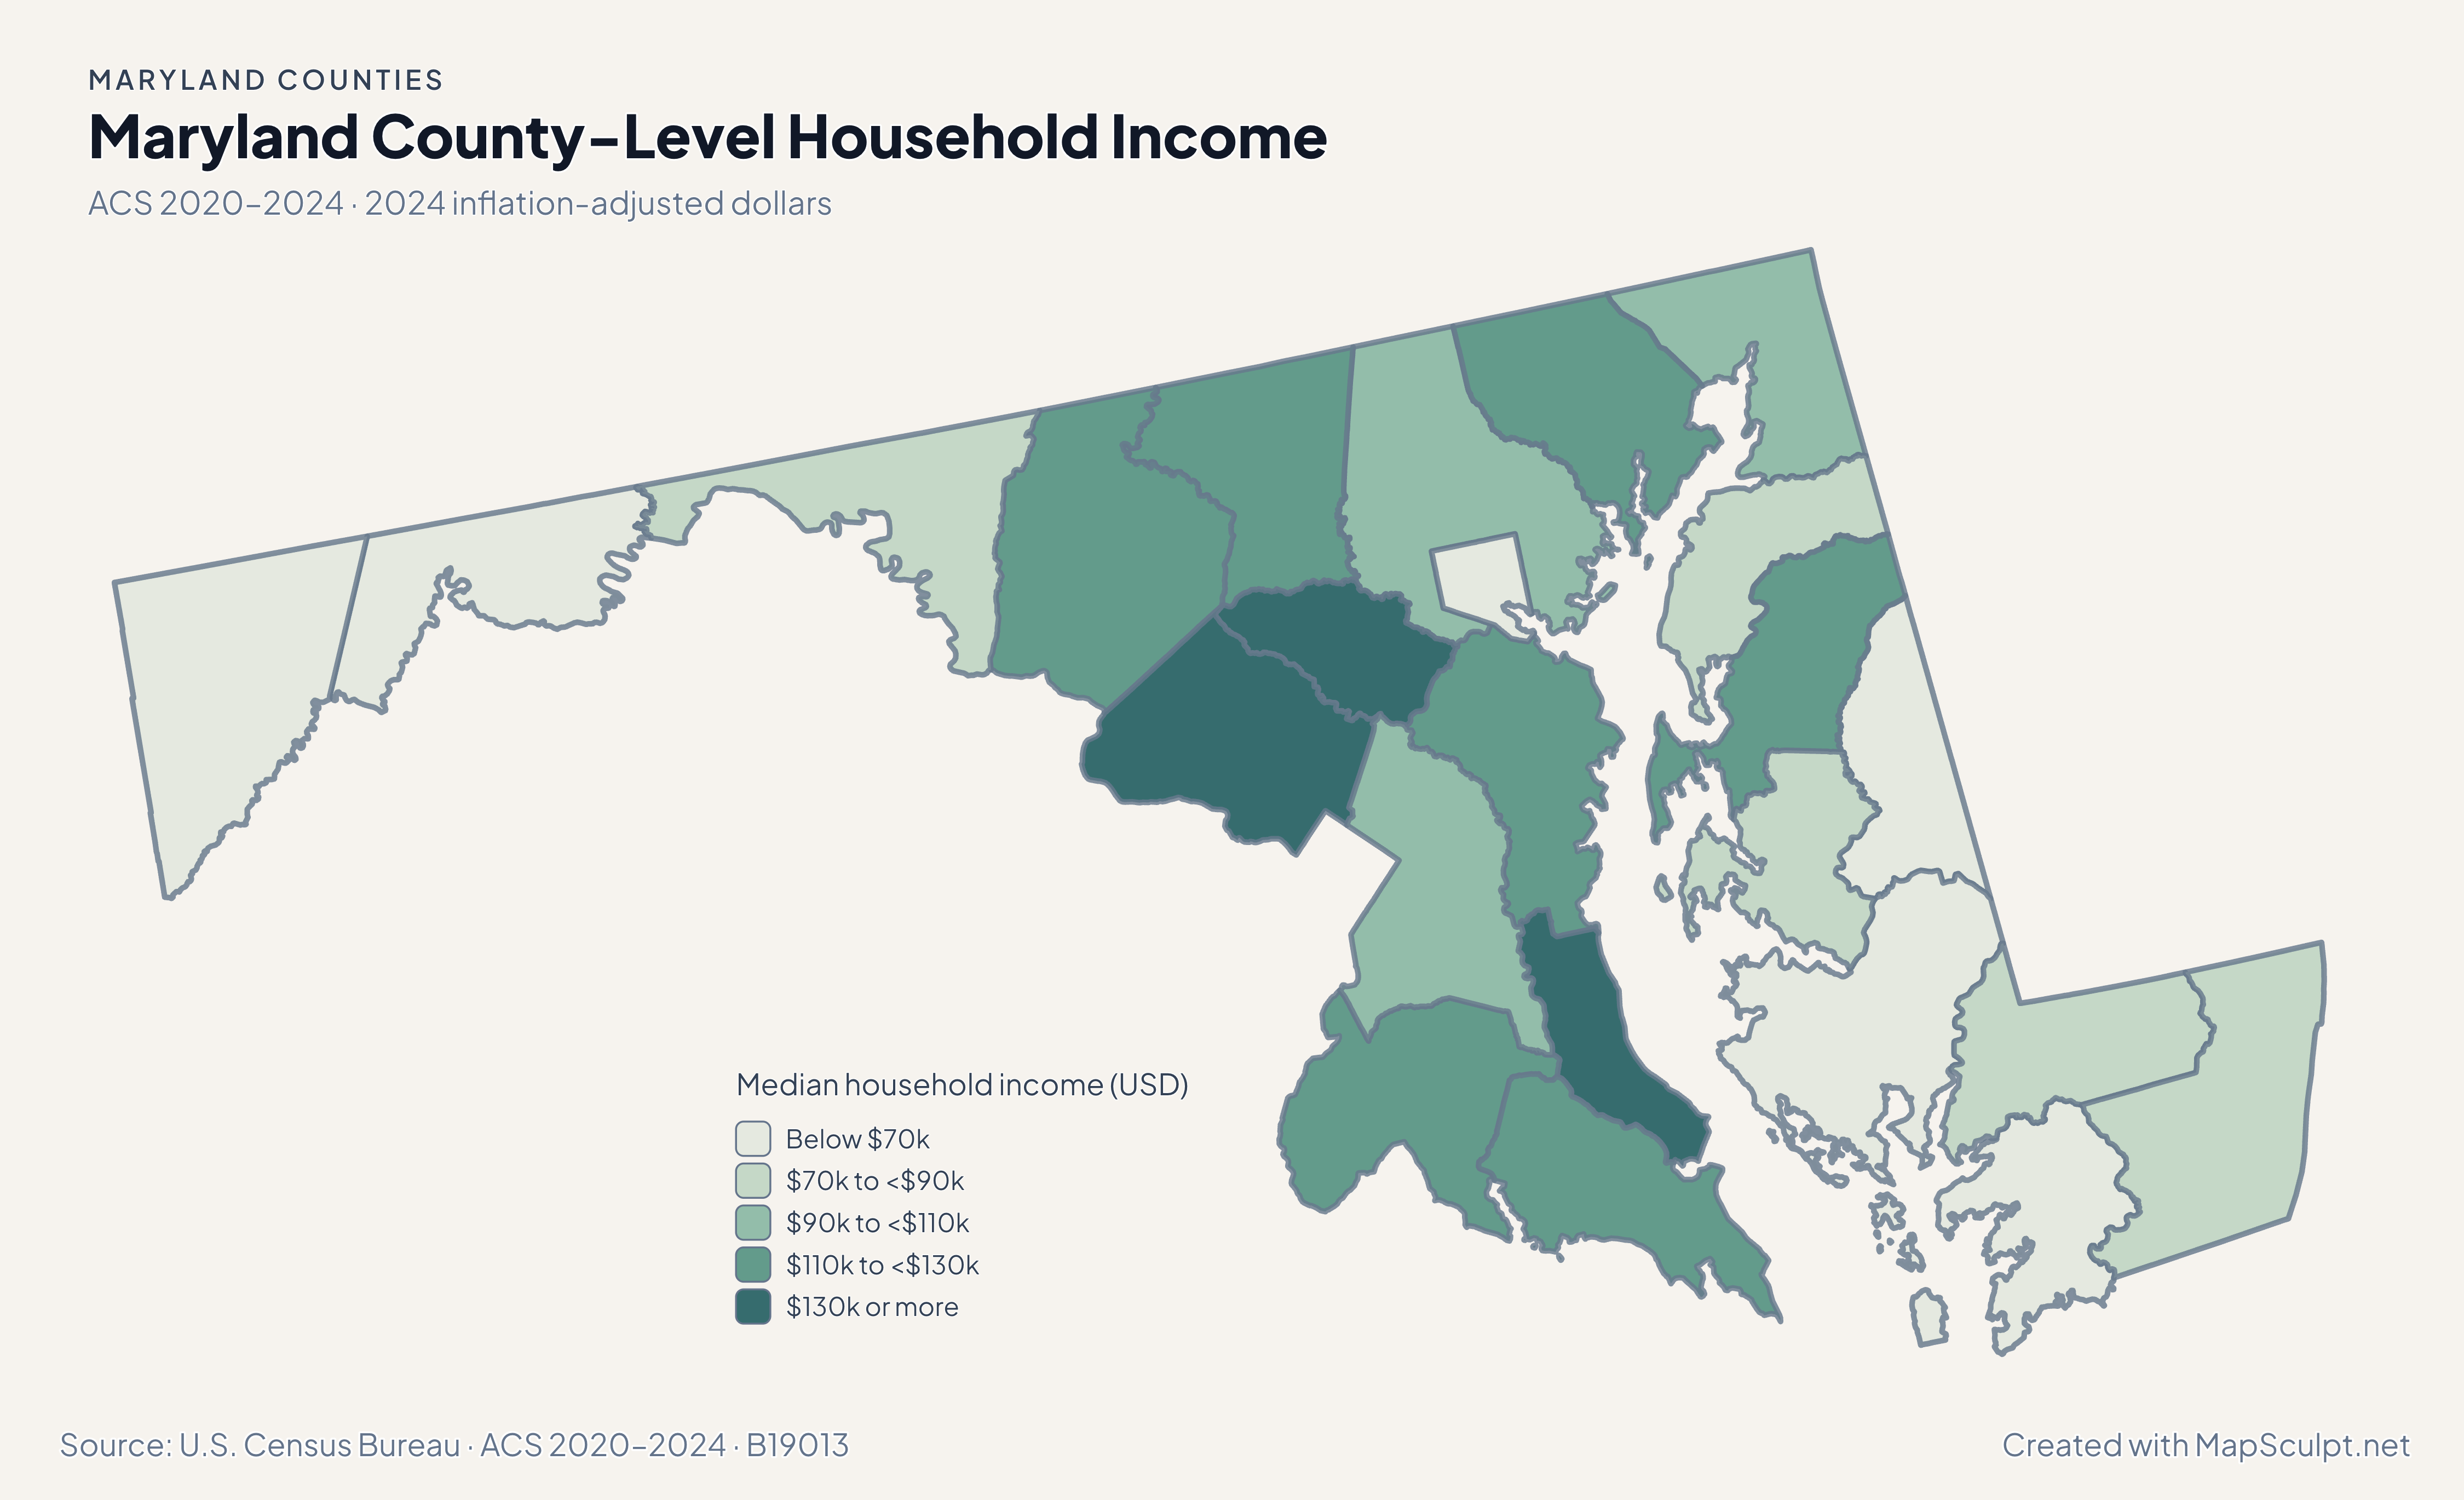
Read the Chesapeake and central corridor using the same Census geography across four different measures.

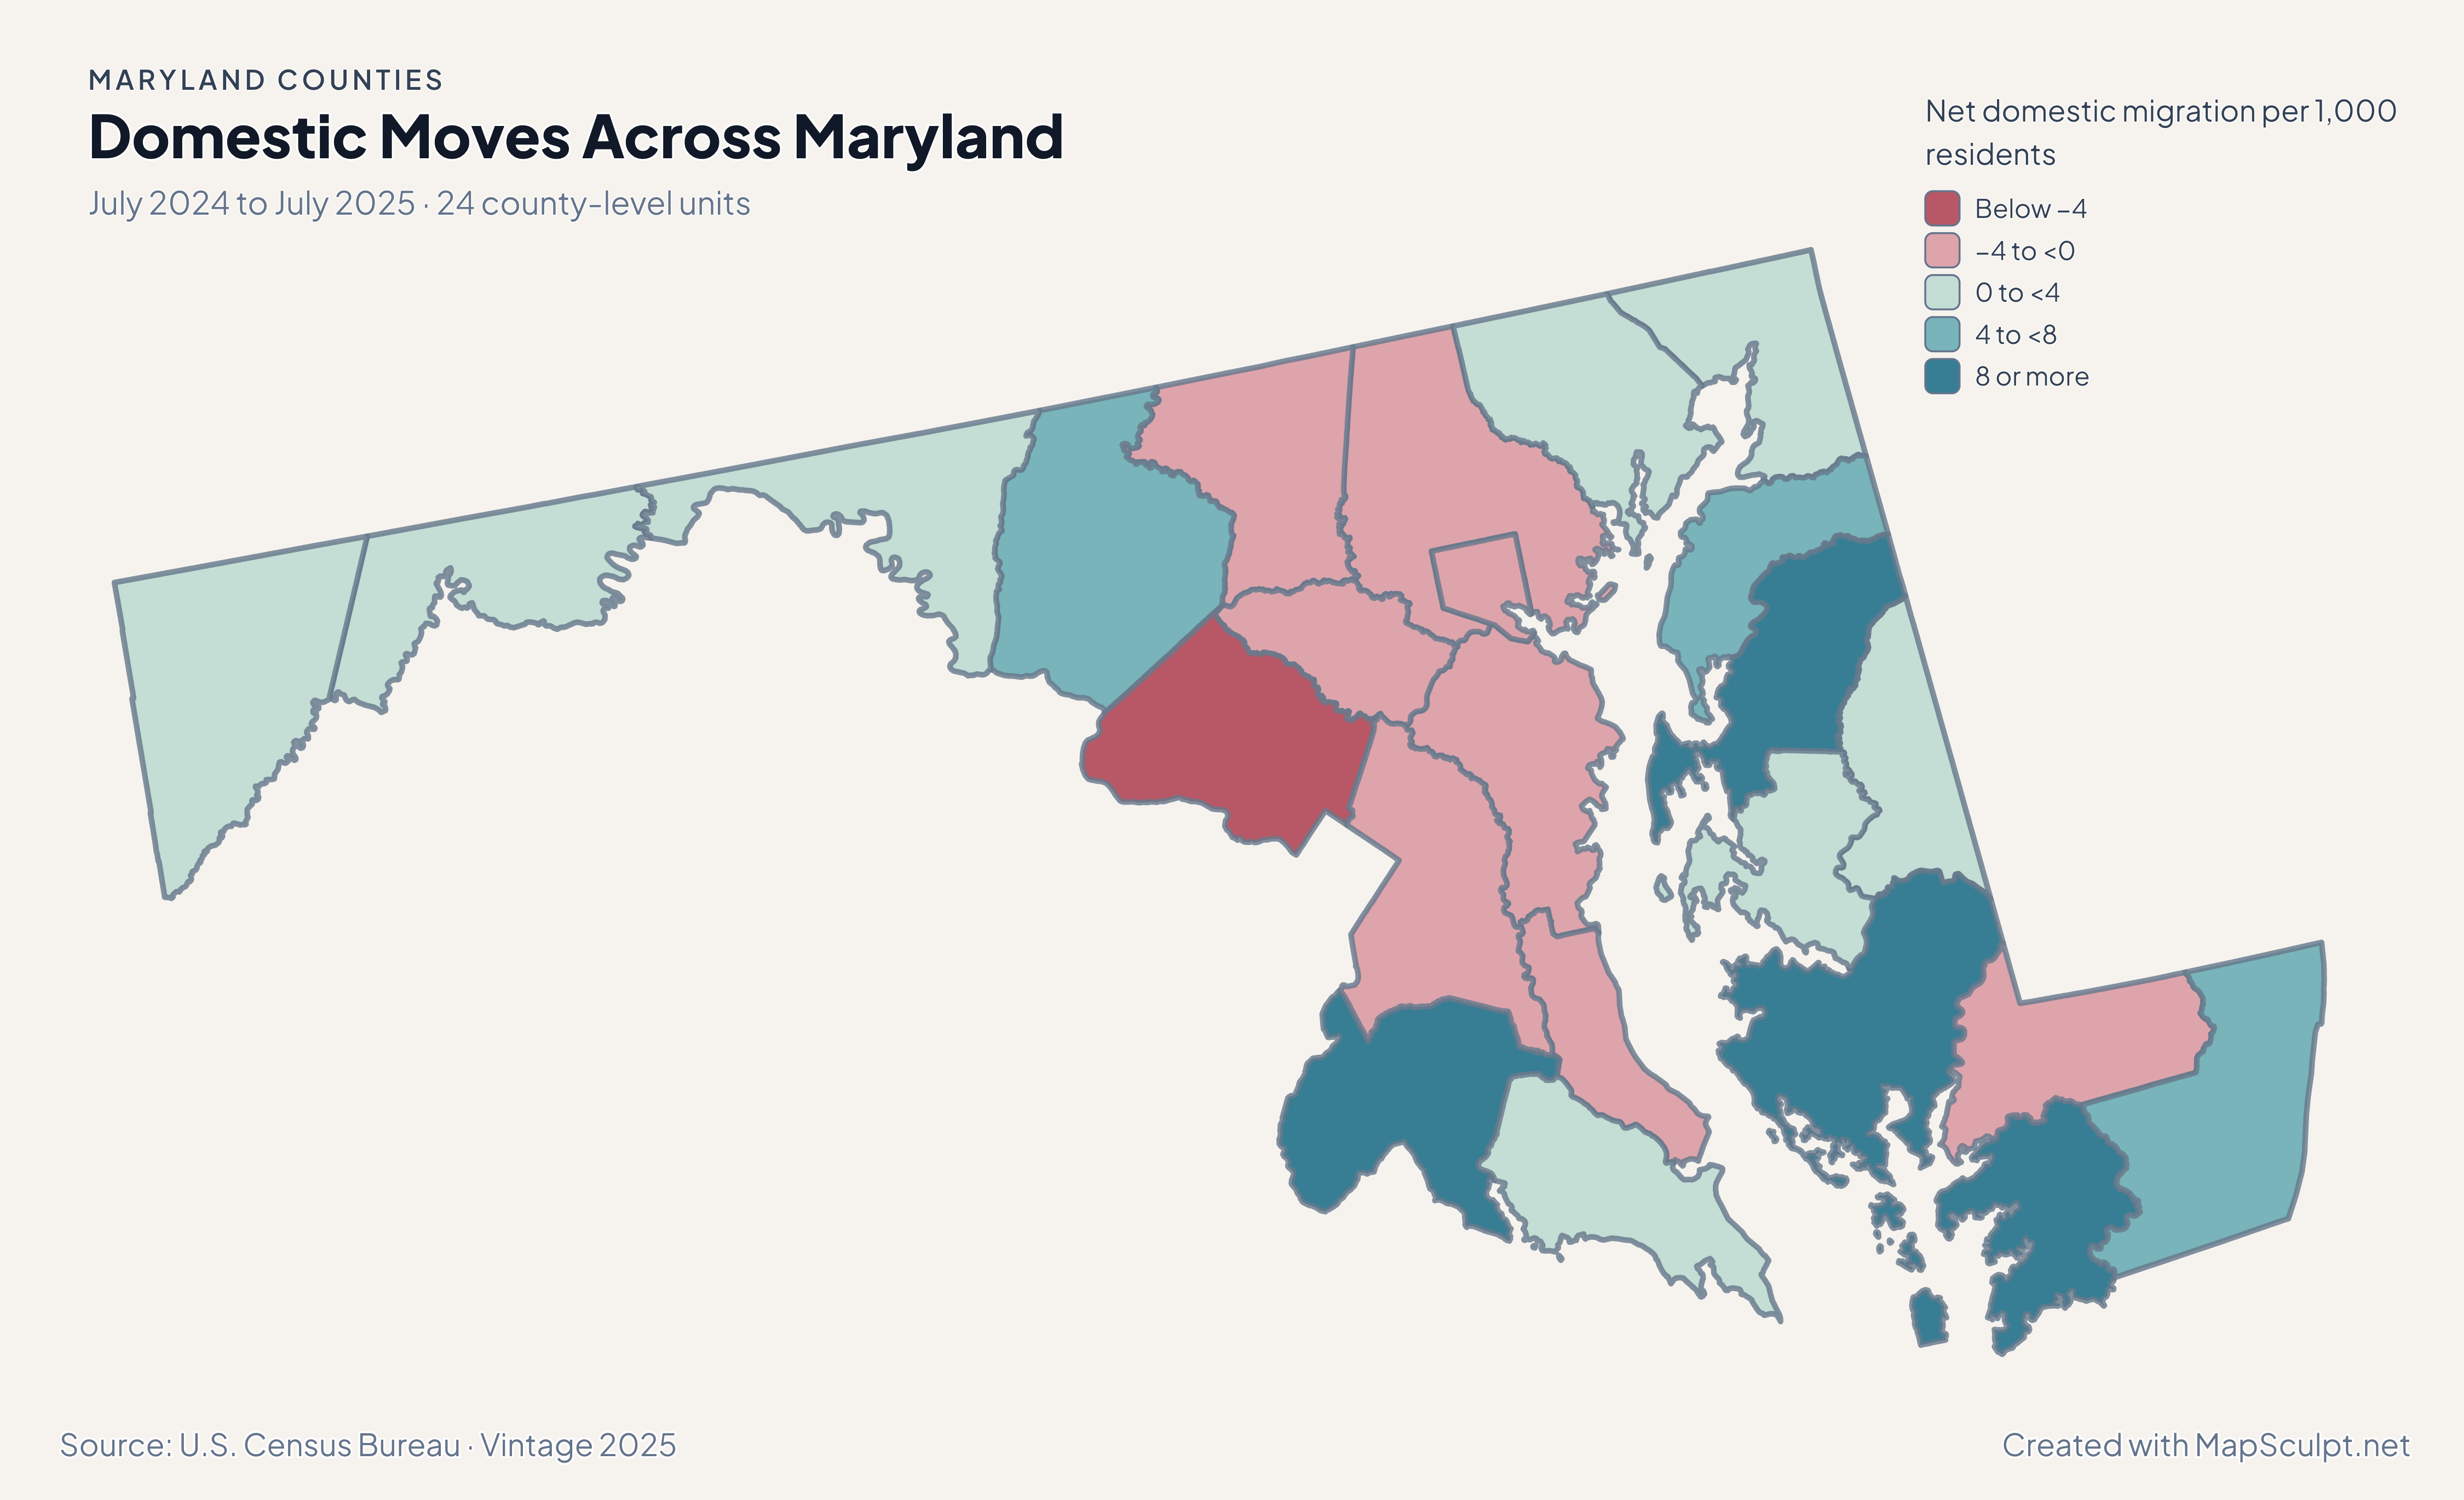
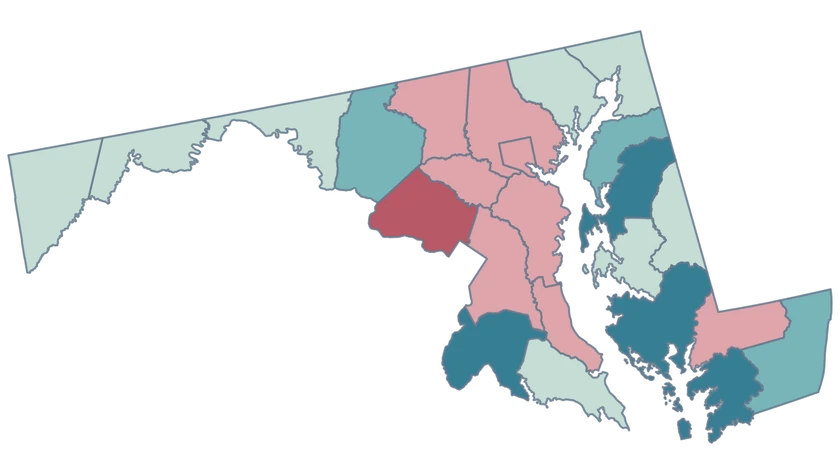
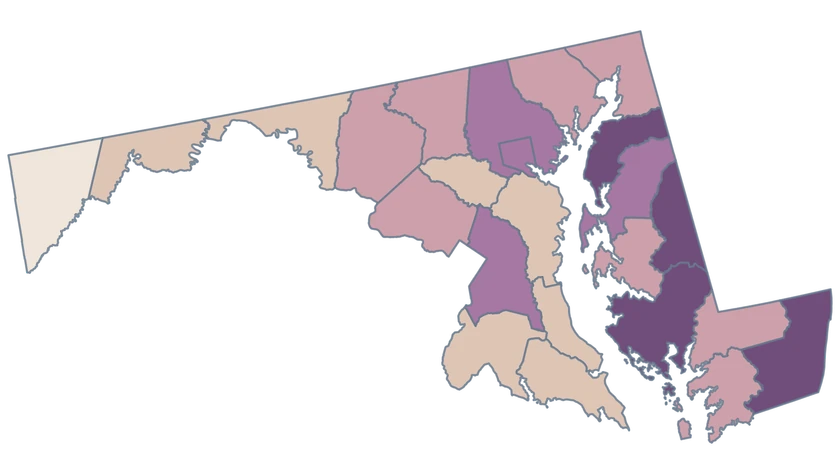
Maryland migration map contrasting a high gain in Dorchester with losses in Montgomery and both Baltimore units.

July 2024 to July 2025 · 24 county-level units

Domestic migration adds another Chesapeake comparison

Dorchester posted 14.81 net domestic movers per 1,000 residents, and Montgomery recorded −9.21. Baltimore city and Baltimore County recorded separate losses of −3.63 and −3.99, respectively.

Net domestic migration per 1,000 residents

  • Below −4
  • −4 to <0
  • 0 to <4
  • 4 to <8
  • 8 or more

U.S. Census Bureau · Vintage 2025

Download complete PNG
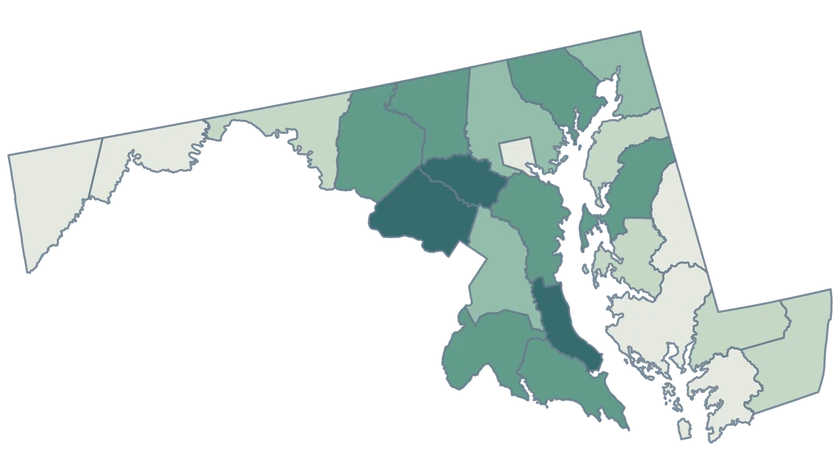
Queen Anne’s grew 1.43%, Frederick 1.35%, and Dorchester 1.26%. Seventeen county-level units grew and seven declined. See the Census estimates ↗

MAKE IT YOURS

From county data to a finished map.

  1. Open the Maryland editor

    Start with all 24 county-level units.

  2. Match your data by GEOID

    Keep GEOIDs as text. The example uses Baltimore city, 24510, and five other official county-level records.

  3. Explain what the colors measure

    Set class breaks, add the reference period, and include a legend and source.

  4. Download the complete map

    Check small features and labels, then export the finished high-resolution PNG.

TRY CSV IMPORT

Practice joining six official GEOIDs.

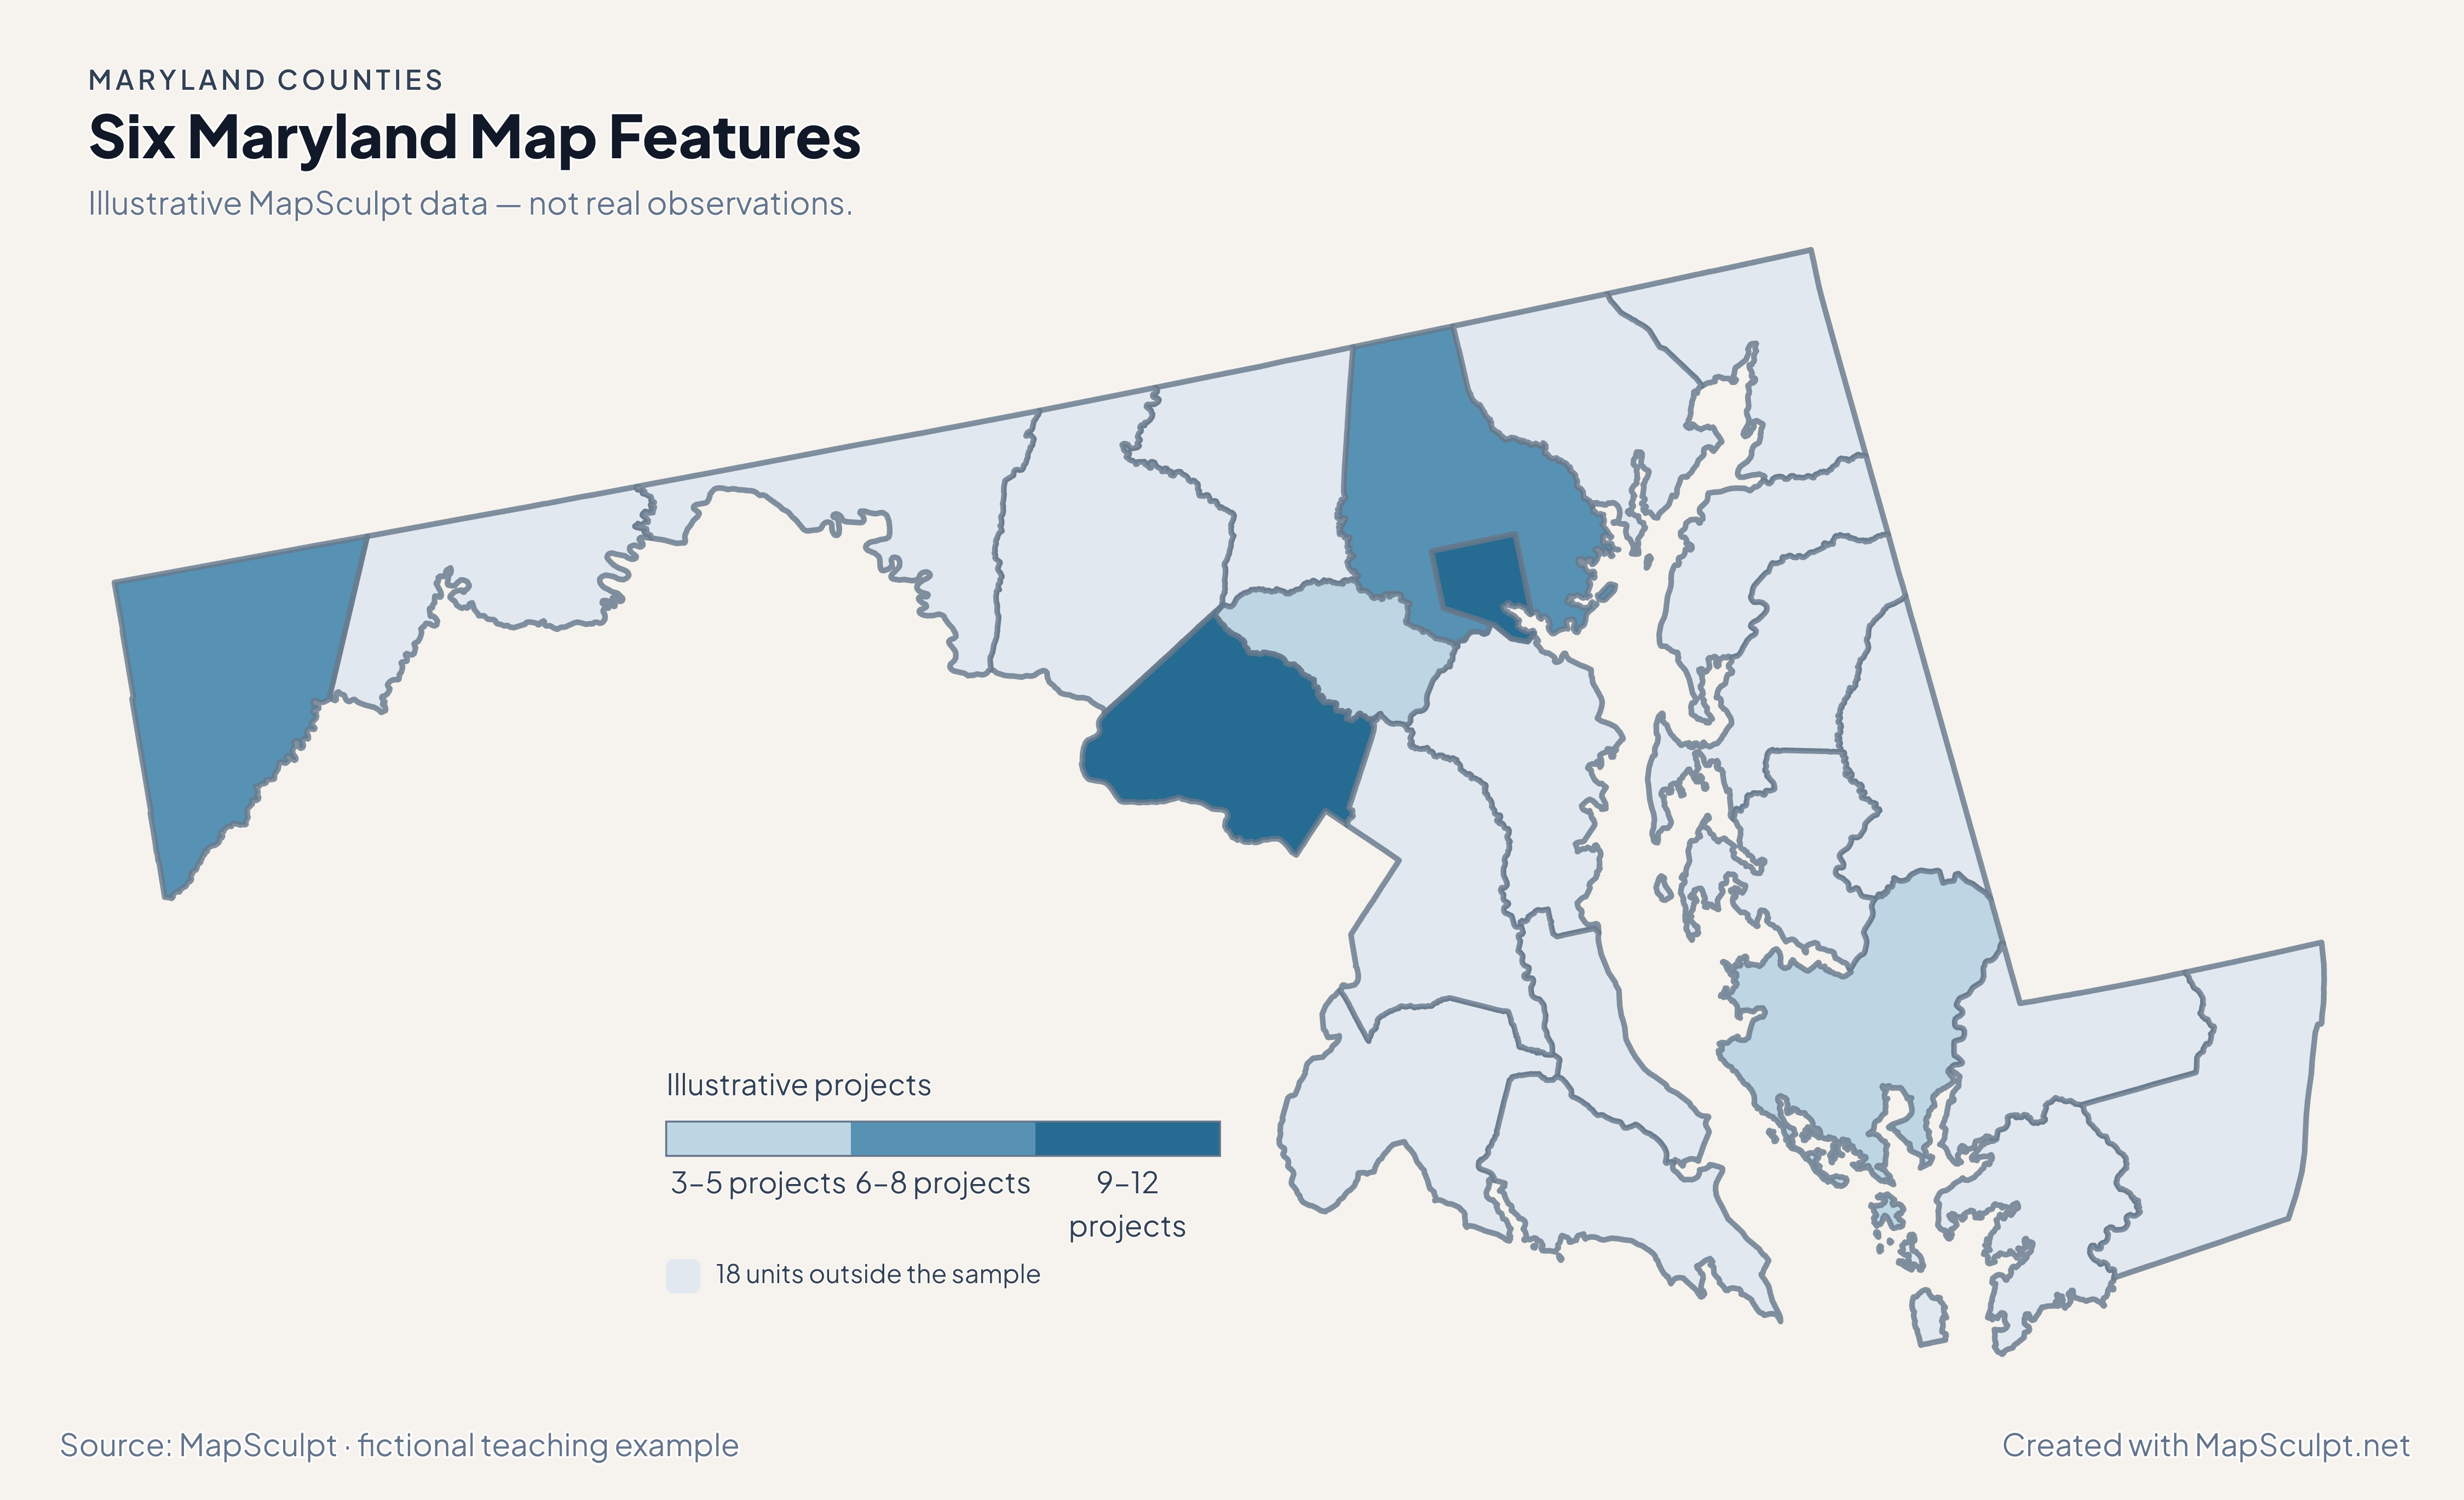
Import the fictional project counts and choose numeric boundaries of 3, 6, 9 and 12. The other 18 county-level units use a neutral fill.

Illustrative MapSculpt data — not real observations.
CountyGEOIDProjects
Baltimore city2451012
Baltimore County240056
Montgomery County240319
Howard County240273
Garrett County240237
Dorchester County240195

Keep GEOIDs as text. The example uses Baltimore city, 24510, and five other official county-level records.

Download illustrative CSV ↓

Six Maryland Map Features

Illustrative MapSculpt data — not real observations.

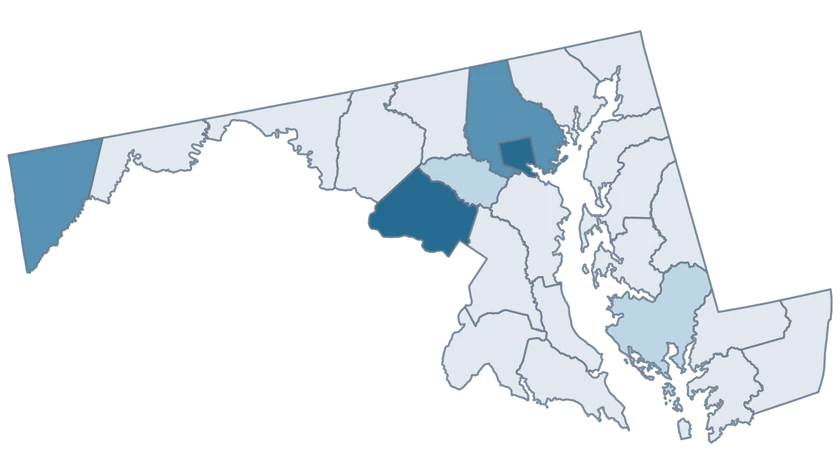
Illustrative Maryland project map identifying six features and leaving 18 neutral.

Illustrative projects

  • 3–5 projects
  • 6–8 projects
  • 9–12 projects
  • 18 units outside the sample
Download complete PNG

CSV → Match 6 county-level units → Style → Export PNG Create a Maryland map

GEOGRAPHY NOTES

Baltimore city keeps a separate Census identity

The Census Bureau includes independent Baltimore city at county level. Keep the city and county on separate rows in a source table, especially when a dataset abbreviates both labels. The directory and illustrative CSV use the official identifiers.

U.S. Census Bureau · TIGER/Line technical documentation

COUNTY REFERENCE

Find all 24 Maryland county-level units and GEOIDs.

Official county and independent city names and five-digit Census GEOIDs. Search by name or code.

  1. Allegany CountyGEOID 24001
  2. Anne Arundel CountyGEOID 24003
  3. Baltimore cityGEOID 24510
  4. Baltimore CountyGEOID 24005
  5. Calvert CountyGEOID 24009
  6. Caroline CountyGEOID 24011
  7. Carroll CountyGEOID 24013
  8. Cecil CountyGEOID 24015
  9. Charles CountyGEOID 24017
  10. Dorchester CountyGEOID 24019
  11. Frederick CountyGEOID 24021
  12. Garrett CountyGEOID 24023
  13. Harford CountyGEOID 24025
  14. Howard CountyGEOID 24027
  15. Kent CountyGEOID 24029
  16. Montgomery CountyGEOID 24031
  17. Prince George's CountyGEOID 24033
  18. Queen Anne's CountyGEOID 24035
  19. Somerset CountyGEOID 24039
  20. St. Mary's CountyGEOID 24037
  21. Talbot CountyGEOID 24041
  22. Washington CountyGEOID 24043
  23. Wicomico CountyGEOID 24045
  24. Worcester CountyGEOID 24047

U.S. Census Bureau · 2025 Cartographic Boundary Files

COMMON QUESTIONS

Maryland county map questions.

Why is Baltimore city a separate entry?

It is an independent city and Census county equivalent. Use 24510 for the city and 24005 for Baltimore County.

How many counties can I color in Maryland?

The map includes 23 counties plus Baltimore city. All 24 units can carry separate fills and data values.

Can I compare counties on both sides of Chesapeake Bay?

Yes. Use observations that share a period, definition and units, and match each one to its five-digit county GEOID.

How can I match Queen Anne’s County in a CSV?

Use GEOID 24035. This avoids differences in apostrophes or naming conventions between datasets.

How detailed is the Chesapeake shoreline?

The map is based on generalized 1:500,000 Census cartographic features, suited to statewide comparisons.

Can I include nearby Washington, D.C., in the same visualization?

Use the national county editor for a map spanning Maryland and the District of Columbia, keeping their separate Census identities.

YOUR NEXT MAP STARTS HERE

Map Maryland around the Chesapeake and beyond.

Join your data by GEOID or select features by hand, then export a PNG with a useful title and source.

Create a Maryland map