Skip to content
MapSculpt

GEOGRAPHIC MAP MAKER / SOUTH CAROLINA

South Carolina
Counties Map Maker

Compare domestic moves along the Lowcountry and Grand Strand with inland gains in the Upstate, then build a custom map from South Carolina’s 46 county boundaries.

Free online editor · No sign-up required

46counties
individually editable

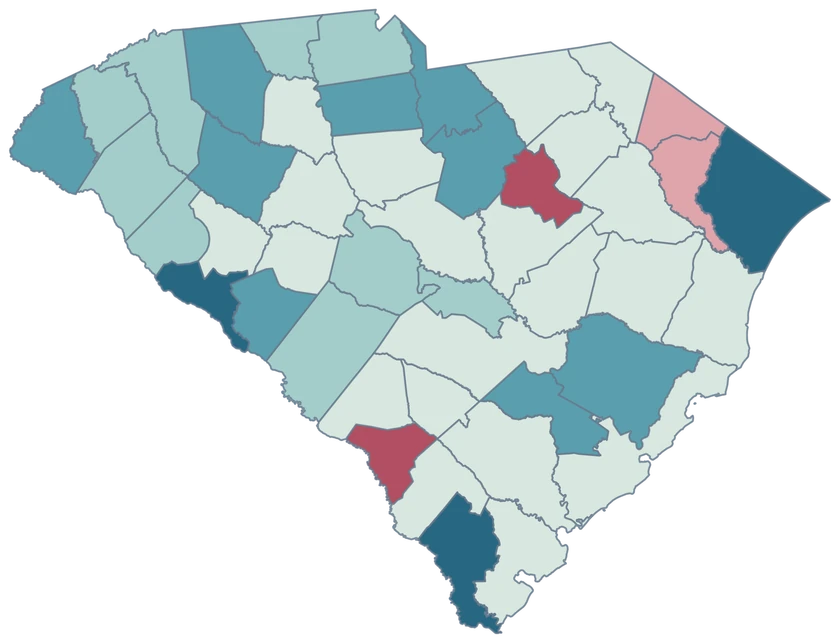
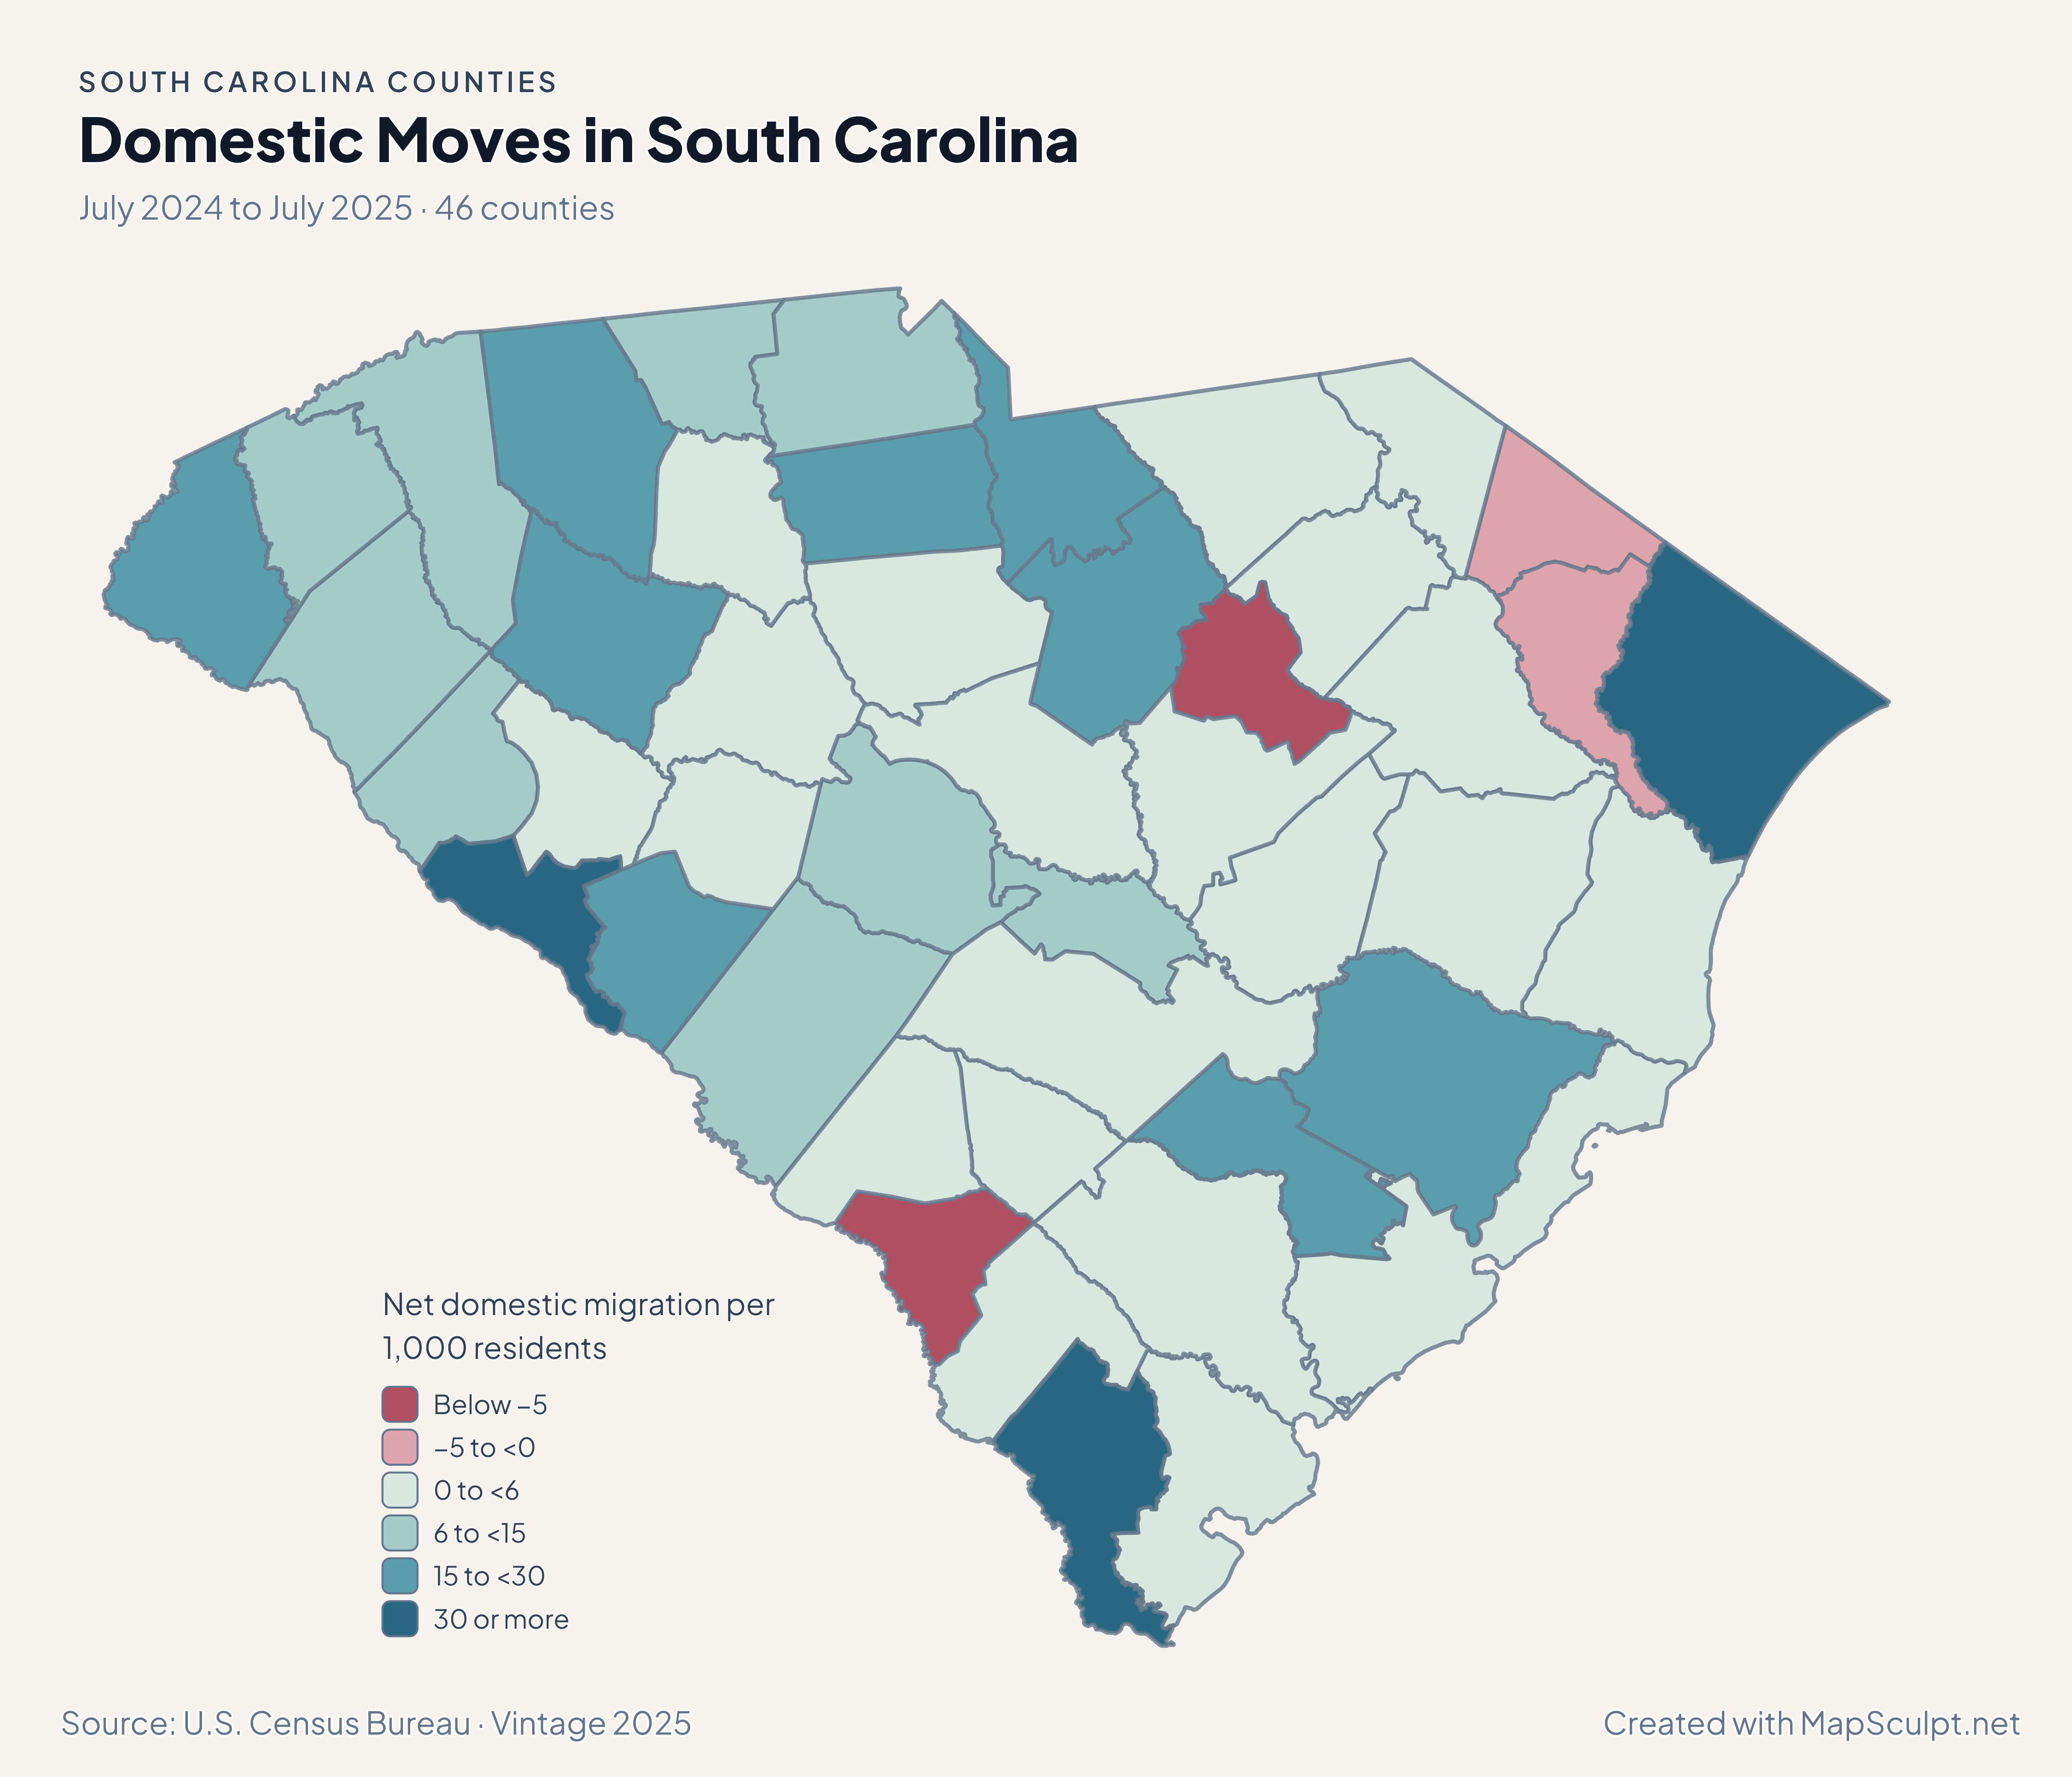
Domestic Moves in South Carolina

July 2024 to July 2025 · 46 counties

South Carolina migration showing strong gains in Jasper and Horry and a loss in Allendale.

Net domestic migration per 1,000 residents

  • Below −5
  • −5 to <0
  • 0 to <6
  • 6 to <15
  • 15 to <30
  • 30 or more
U.S. Census Bureau · Vintage 2025Download complete PNG Net domestic moves are shown per 1,000 residents. Read the companion population map for total change.

KNOW YOUR GEOGRAPHY

The Lowcountry, Grand Strand and Upstate.

The 2025 Census county outlines preserve the coastal and island pieces retained in the cartographic source. The editor assigns those pieces to their county, including Beaufort and Charleston.

Use the county name and five-digit GEOID when joining records. Myrtle Beach is within Horry County, while an observation for a municipality or island may cover far less than a whole county.

Browse all county GEOIDs ↗

2025 Census boundaries

OFFICIAL DATA

Coastal gains are part of a broader growth pattern.

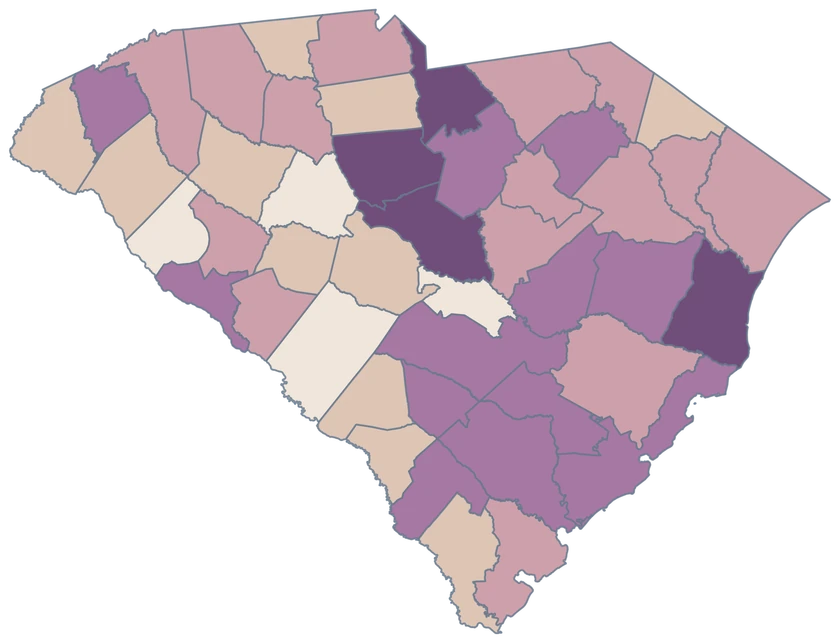
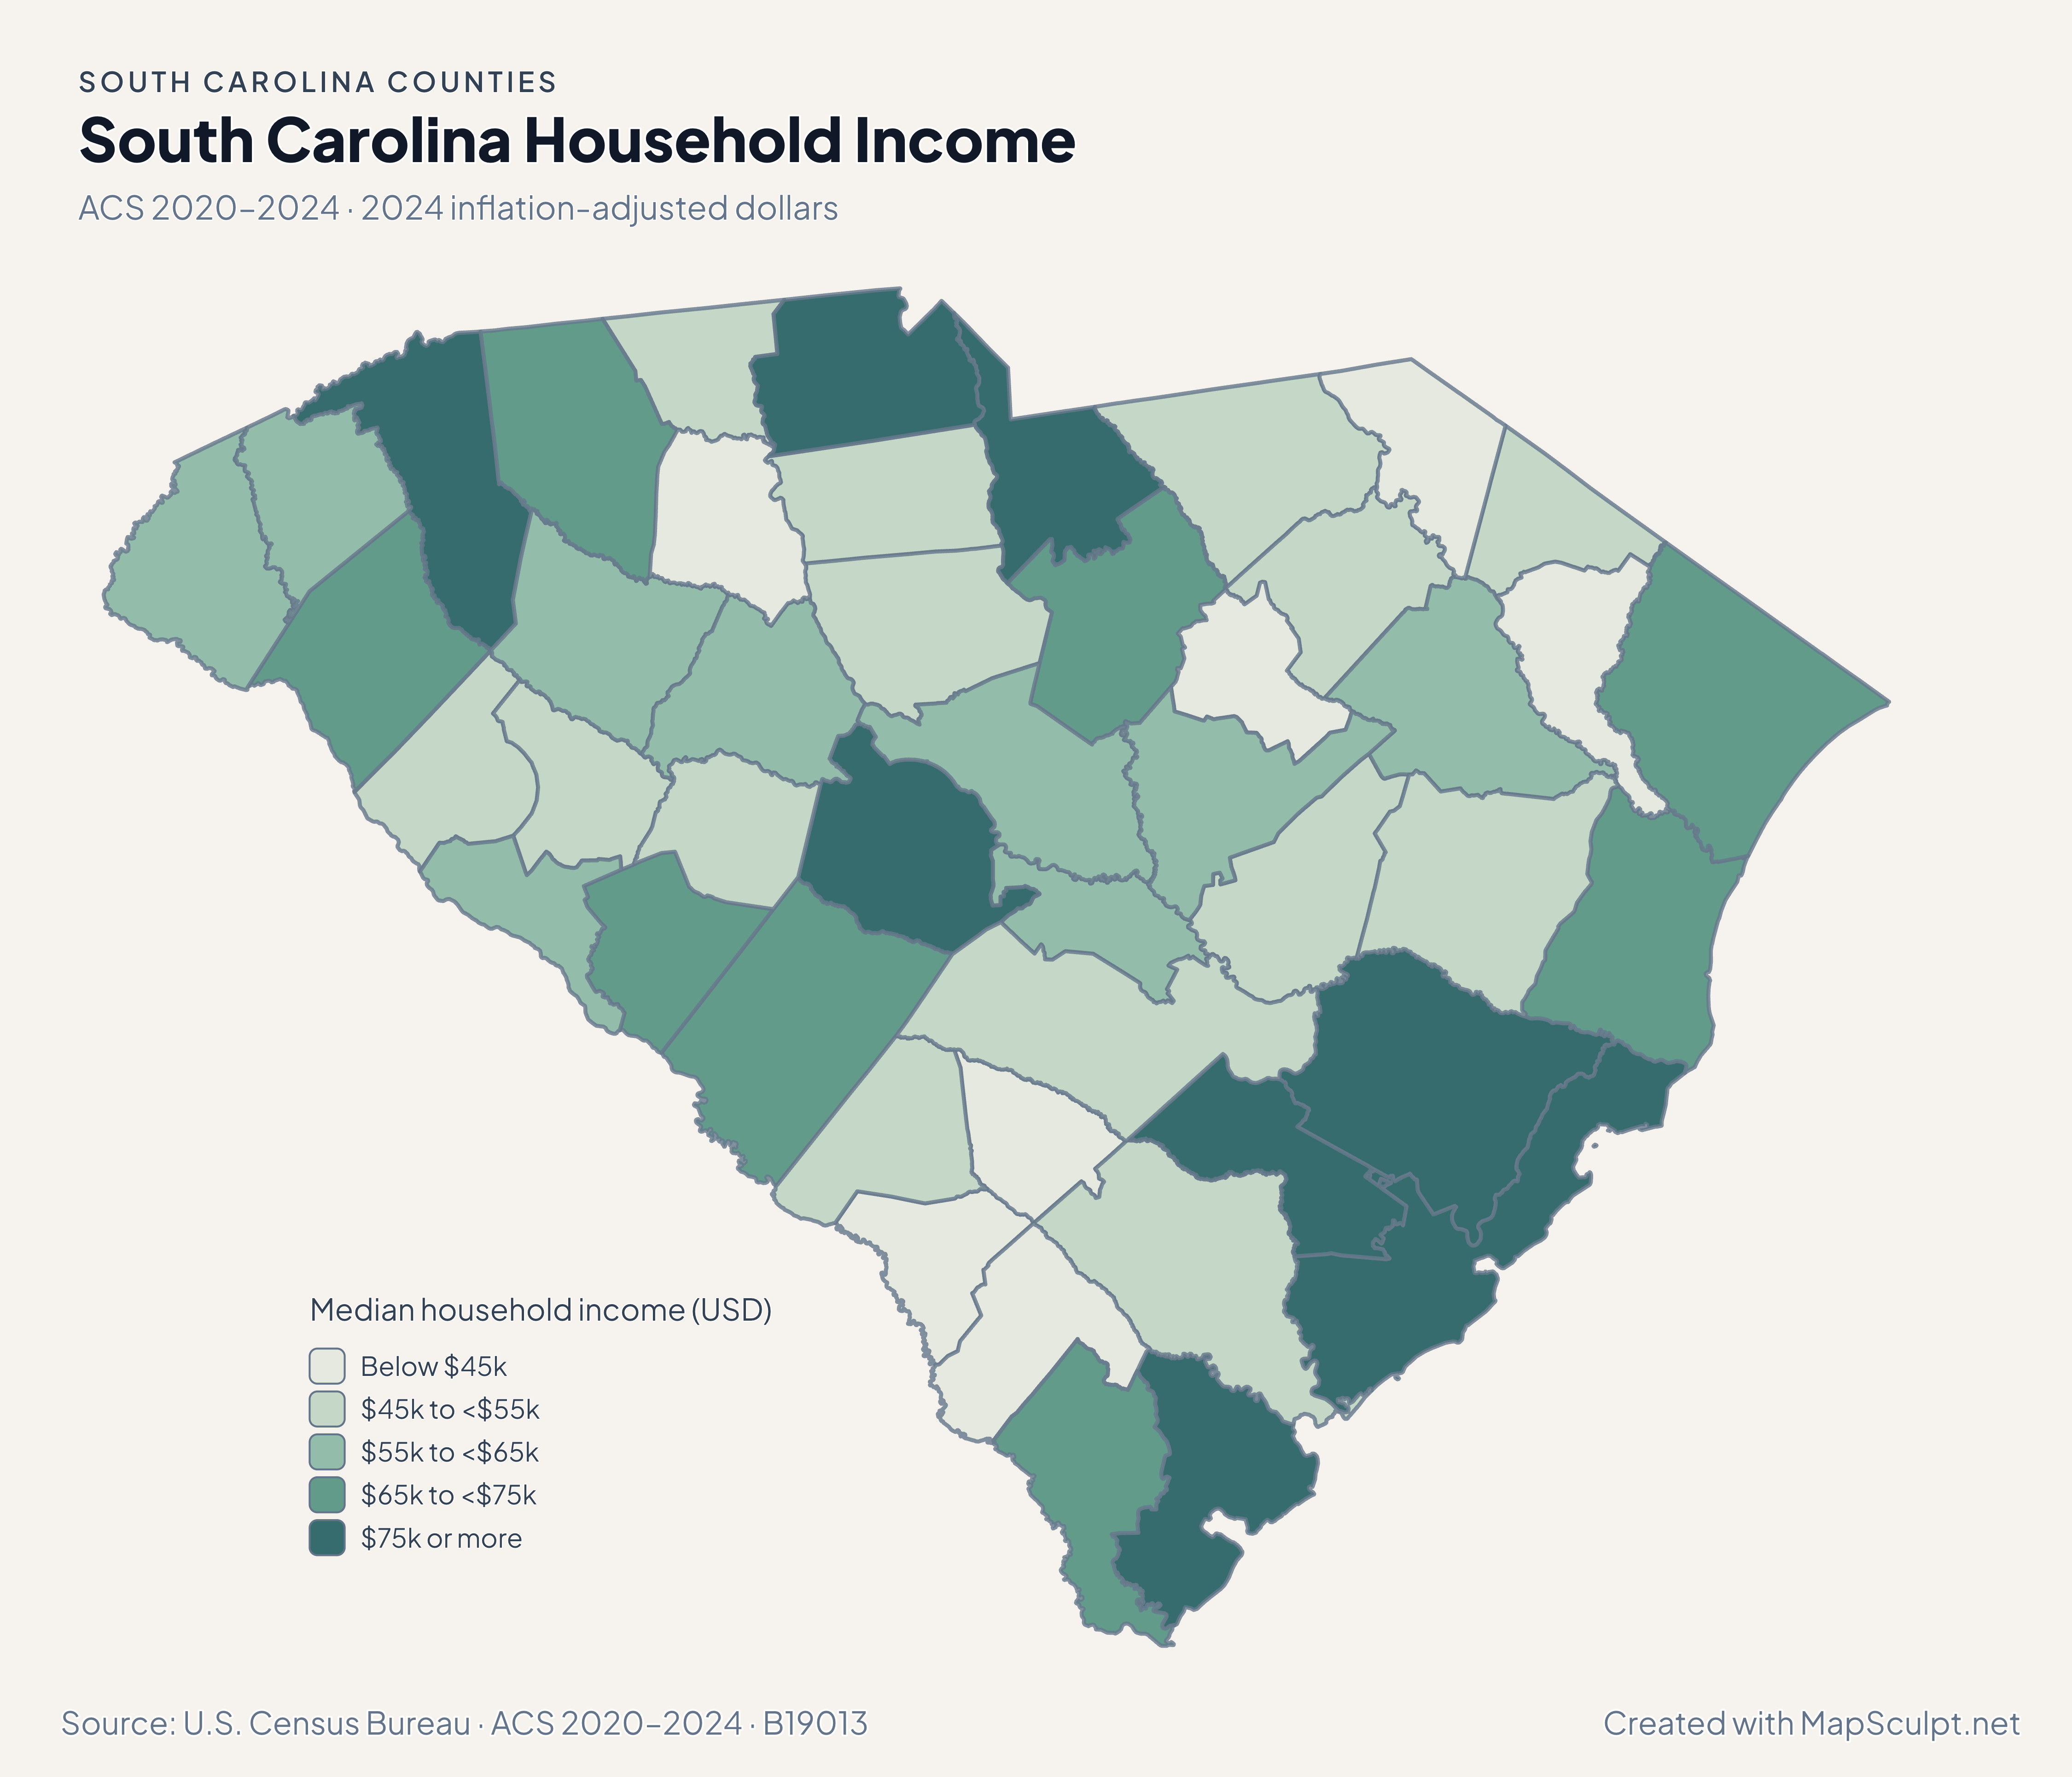
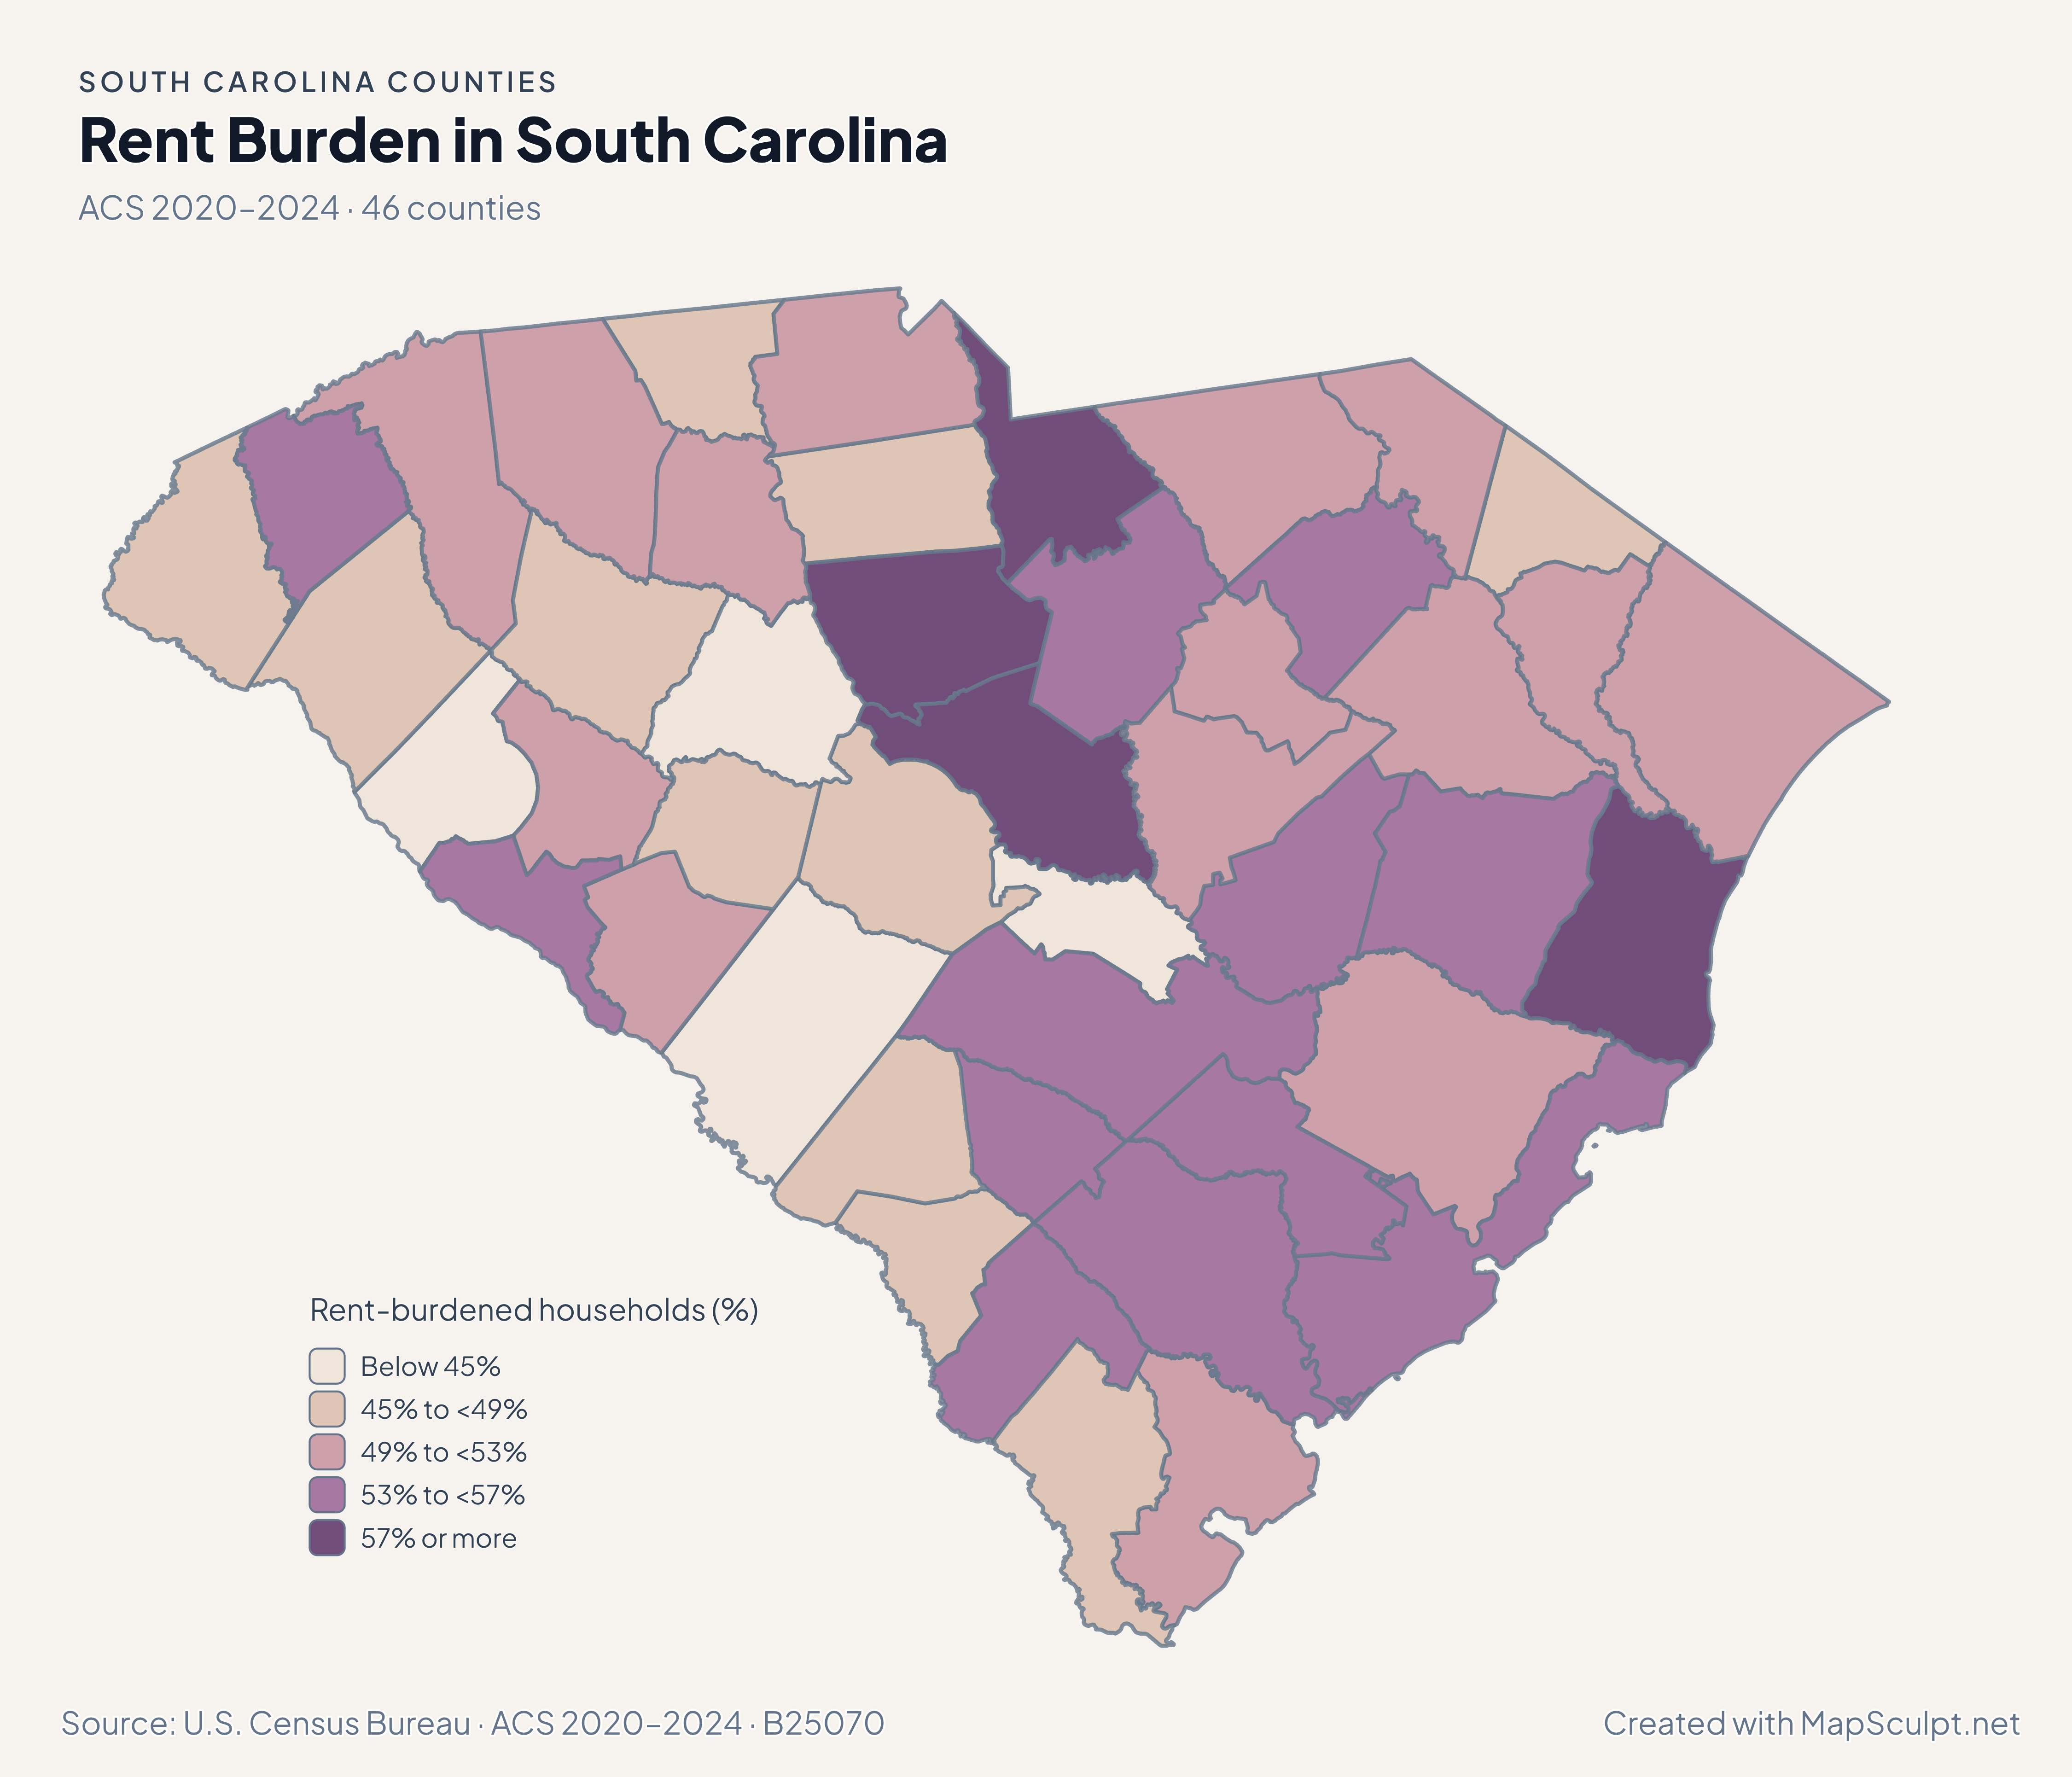
Compare the coast and Upstate at equal units, then see how ACS household income and renter burden vary across the same counties.

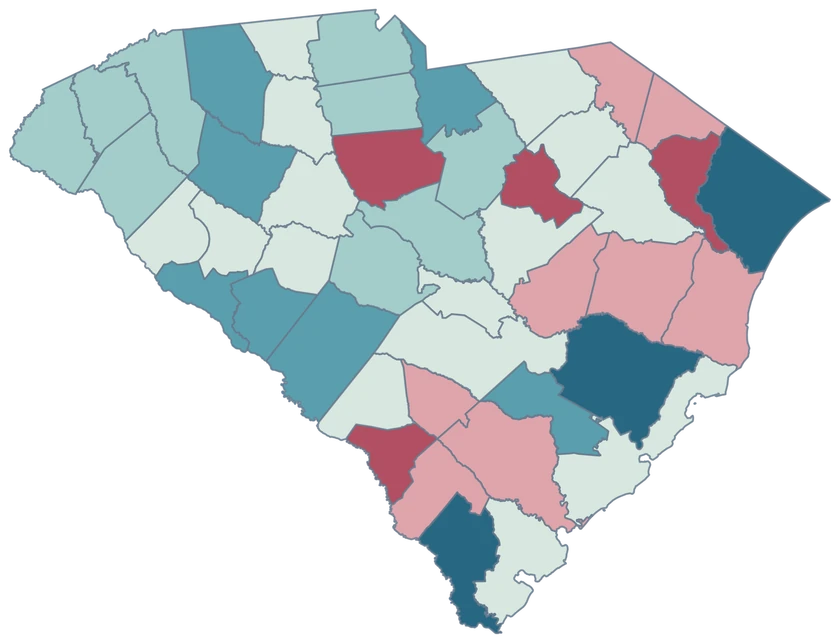
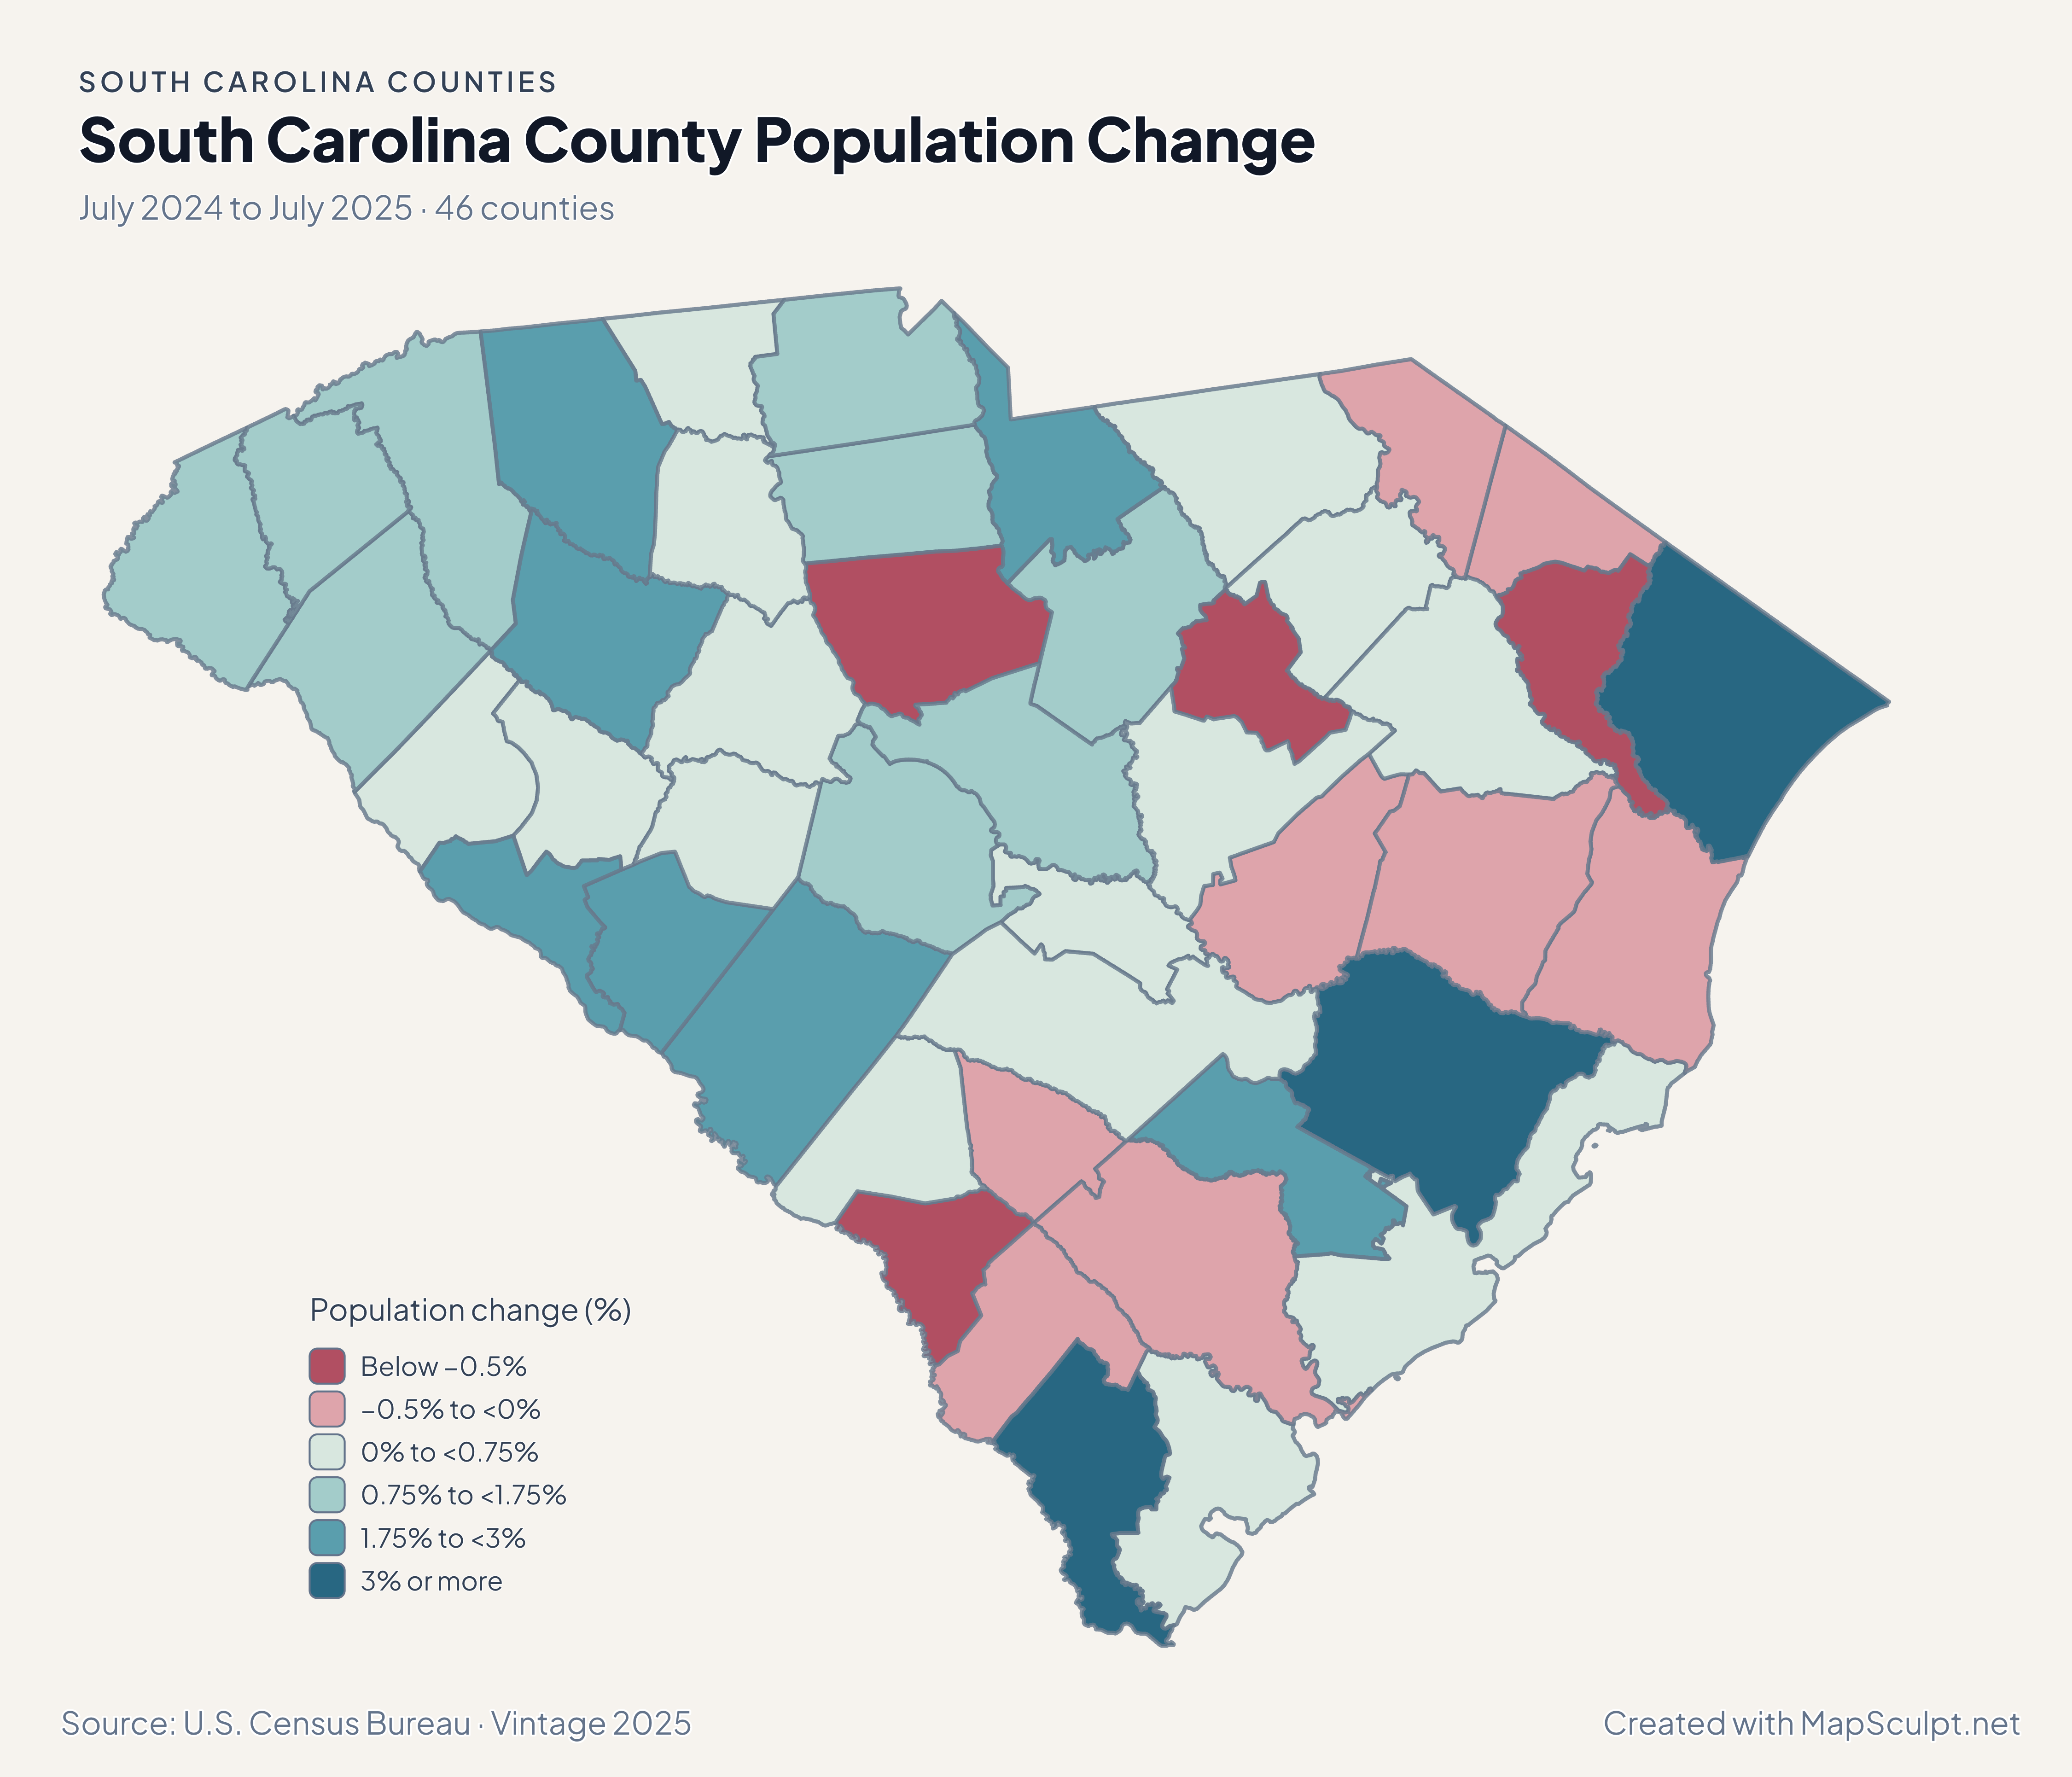
South Carolina population change showing strong coastal gains and growth around Spartanburg.

July 2024 to July 2025 · 46 counties

Growth reaches inland as well as the coast.

Jasper grew 6.04%, the highest county percentage change. Horry gained 3.20% and inland Spartanburg gained 2.95%. These are changes relative to each county’s July 2024 estimate.

Population change (%)

  • Below −0.5%
  • −0.5% to <0%
  • 0% to <0.75%
  • 0.75% to <1.75%
  • 1.75% to <3%
  • 3% or more

U.S. Census Bureau · Vintage 2025

Download complete PNG

Jasper recorded 54.92 net domestic movers per 1,000 residents, Horry 33.79 and Spartanburg 24.59. Allendale recorded a net domestic loss of 17.33 per 1,000. See the Census estimates ↗

MAKE IT YOURS

From county data to a finished map.

  1. Choose the editor

    Open the South Carolina editor to compare coastal counties and the inland Upstate in one map.

  2. Match the county rows

    Use five-digit county GEOIDs for the join. Jasper is 45053 and Horry is 45051.

  3. Write the legend

    For a signed change map, give gains and losses separate colors. Use a higher positive band if a few counties stand out.

  4. Export the map

    Check the Lowcountry islands and coastline in the preview before downloading your PNG.

TRY CSV IMPORT

Practice a six-county join in South Carolina.

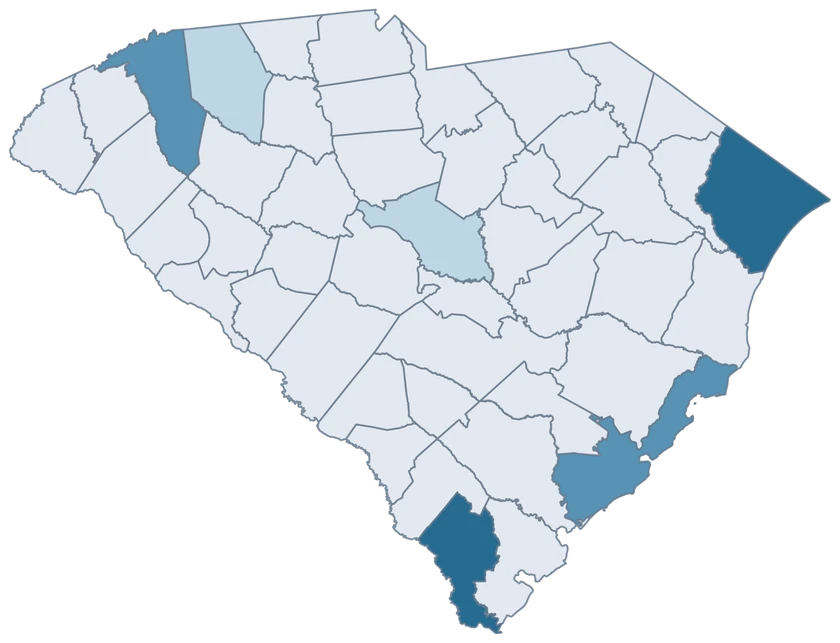
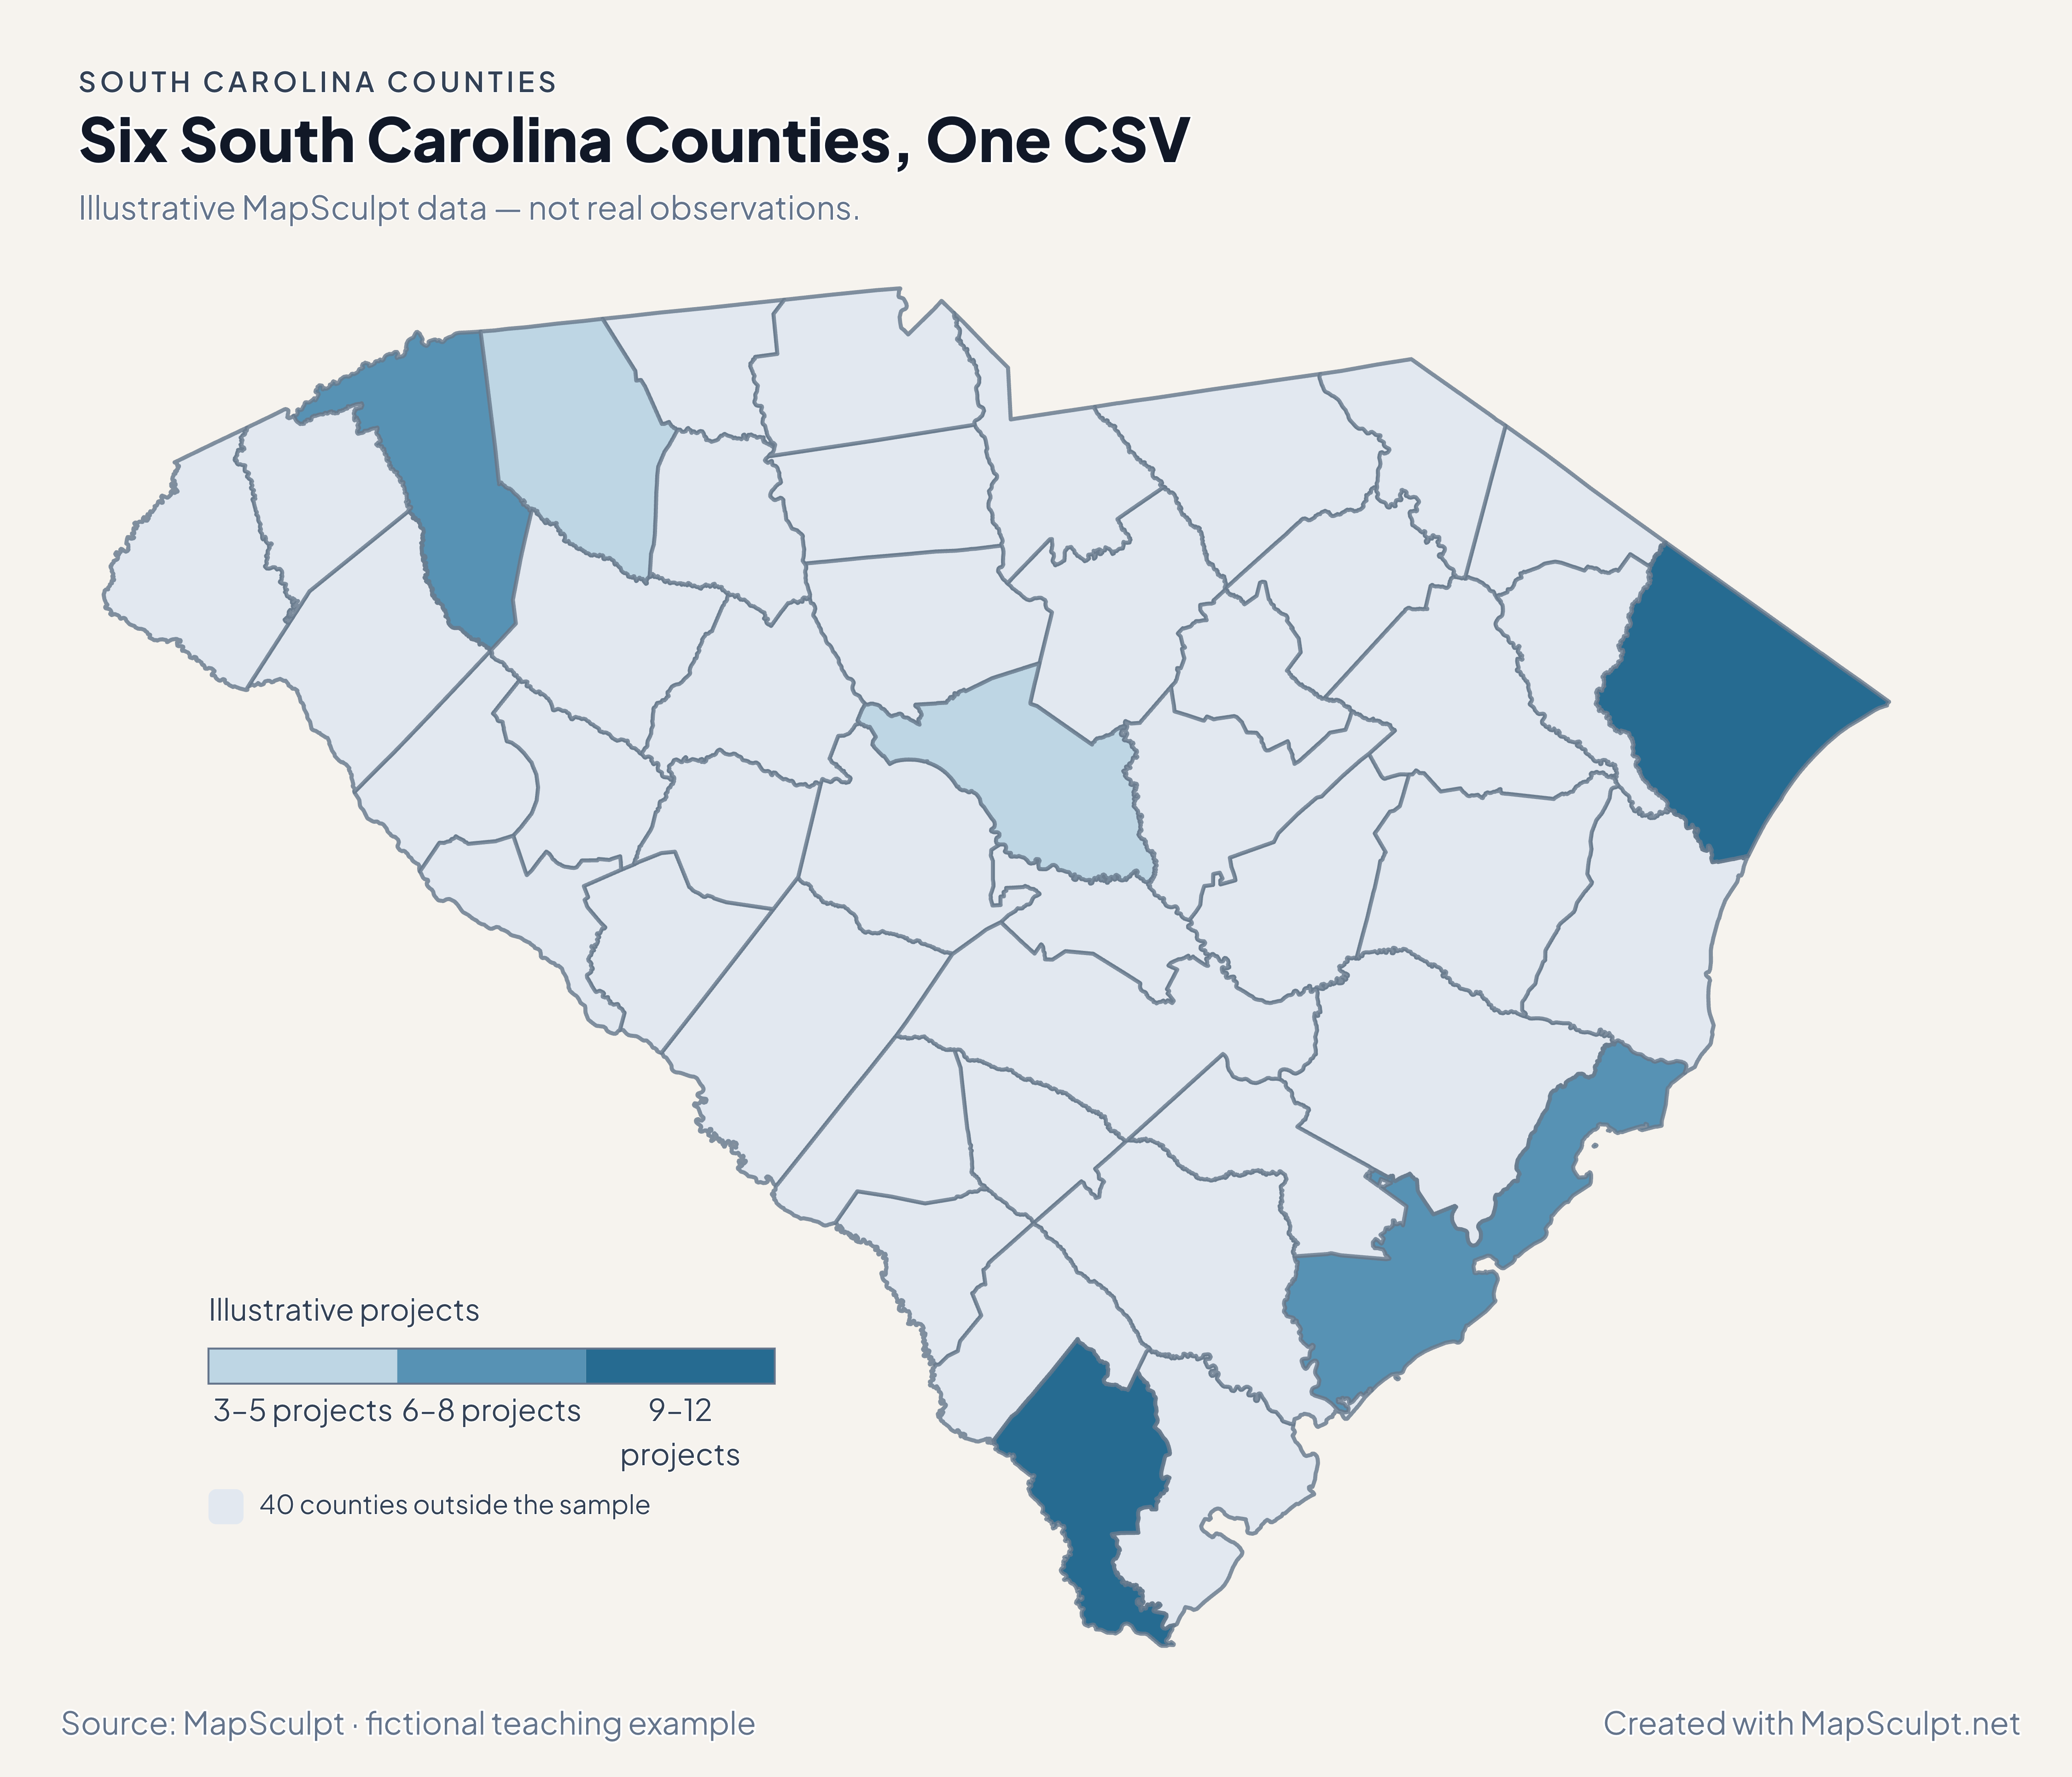
Import the fictional project counts, choose IllustrativeProjects, and set numeric boundaries of 3, 6, 9 and 12. The other 40 counties remain neutral.

Illustrative MapSculpt data — not real observations.
CountyGEOIDProjects
Jasper County4505312
Horry County450519
Charleston County450197
Greenville County450458
Spartanburg County450833
Richland County450795

Keep GEOIDs as text. The sample matches Jasper County with 45053. Check the directory for official names and codes before importing your data.

Download illustrative CSV ↓

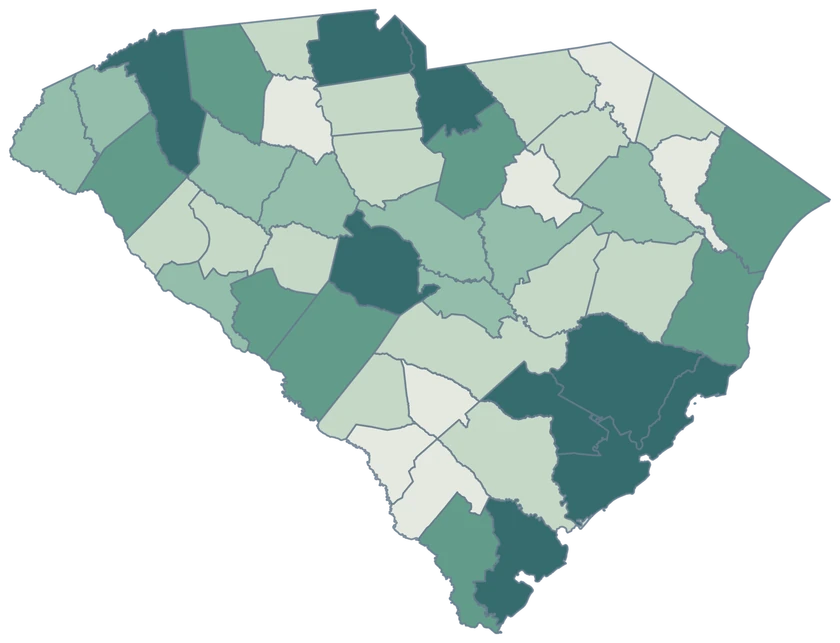
Six South Carolina Counties, One CSV

Illustrative MapSculpt data — not real observations.

Fictional project counts across six South Carolina counties. The other 40 counties are neutral.

Illustrative projects

  • 3–5 projects
  • 6–8 projects
  • 9–12 projects
  • 40 counties outside the sample
Download complete PNG

CSV → Match 6 counties → Style → Export PNG Create a South Carolina map

COUNTY REFERENCE

Find all 46 South Carolina county GEOIDs.

Official county names and five-digit Census GEOIDs. Search by name or code.

  1. Abbeville CountyGEOID 45001
  2. Aiken CountyGEOID 45003
  3. Allendale CountyGEOID 45005
  4. Anderson CountyGEOID 45007
  5. Bamberg CountyGEOID 45009
  6. Barnwell CountyGEOID 45011
  7. Beaufort CountyGEOID 45013
  8. Berkeley CountyGEOID 45015
  9. Calhoun CountyGEOID 45017
  10. Charleston CountyGEOID 45019
  11. Cherokee CountyGEOID 45021
  12. Chester CountyGEOID 45023
  13. Chesterfield CountyGEOID 45025
  14. Clarendon CountyGEOID 45027
  15. Colleton CountyGEOID 45029
  16. Darlington CountyGEOID 45031
  17. Dillon CountyGEOID 45033
  18. Dorchester CountyGEOID 45035
  19. Edgefield CountyGEOID 45037
  20. Fairfield CountyGEOID 45039
  21. Florence CountyGEOID 45041
  22. Georgetown CountyGEOID 45043
  23. Greenville CountyGEOID 45045
  24. Greenwood CountyGEOID 45047
  25. Hampton CountyGEOID 45049
  26. Horry CountyGEOID 45051
  27. Jasper CountyGEOID 45053
  28. Kershaw CountyGEOID 45055
  29. Lancaster CountyGEOID 45057
  30. Laurens CountyGEOID 45059
  31. Lee CountyGEOID 45061
  32. Lexington CountyGEOID 45063
  33. Marion CountyGEOID 45067
  34. Marlboro CountyGEOID 45069
  35. McCormick CountyGEOID 45065
  36. Newberry CountyGEOID 45071
  37. Oconee CountyGEOID 45073
  38. Orangeburg CountyGEOID 45075
  39. Pickens CountyGEOID 45077
  40. Richland CountyGEOID 45079
  41. Saluda CountyGEOID 45081
  42. Spartanburg CountyGEOID 45083
  43. Sumter CountyGEOID 45085
  44. Union CountyGEOID 45087
  45. Williamsburg CountyGEOID 45089
  46. York CountyGEOID 45091

U.S. Census Bureau · 2025 Cartographic Boundary Files

COMMON QUESTIONS

South Carolina county map questions.

Does the county outline include the Sea Islands?

It includes island pieces retained by the 2025 cartographic source and colors them with their county.

Which county GEOID covers Myrtle Beach area data?

Use 45051 when an estimate covers Horry County. Myrtle Beach city figures use a smaller geography.

How do I compare Charleston and Upstate counties?

Keep the same measure, units and reference period across counties. Use Charleston’s county GEOID 45019 and the official codes for the Upstate counties you select.

Why does Jasper stand out in both population maps?

Jasper had the highest percentage population gain and net domestic migration rate among South Carolina counties in this release. The two maps measure different quantities.

Can I map the Charlotte area on both sides of the state line?

Use the national county editor for York and any North Carolina counties in your comparison.

Can I isolate a coastal city or barrier island?

The editor selects whole counties. Use an appropriate finer boundary source when the city or island is the geographic unit.

YOUR NEXT MAP STARTS HERE

Map a South Carolina comparison of your own.

Join official county identifiers to your values, choose a readable legend, and download your finished South Carolina map.

Create a South Carolina map