Skip to content
MapSculpt

GEOGRAPHIC MAP MAKER / COLORADO

Colorado
Counties Map Maker

Compare domestic moves across the Front Range and the western mountains, or use Colorado’s 64 county boundaries for a map of your own observations.

Free online editor · No sign-up required

64counties
individually editable

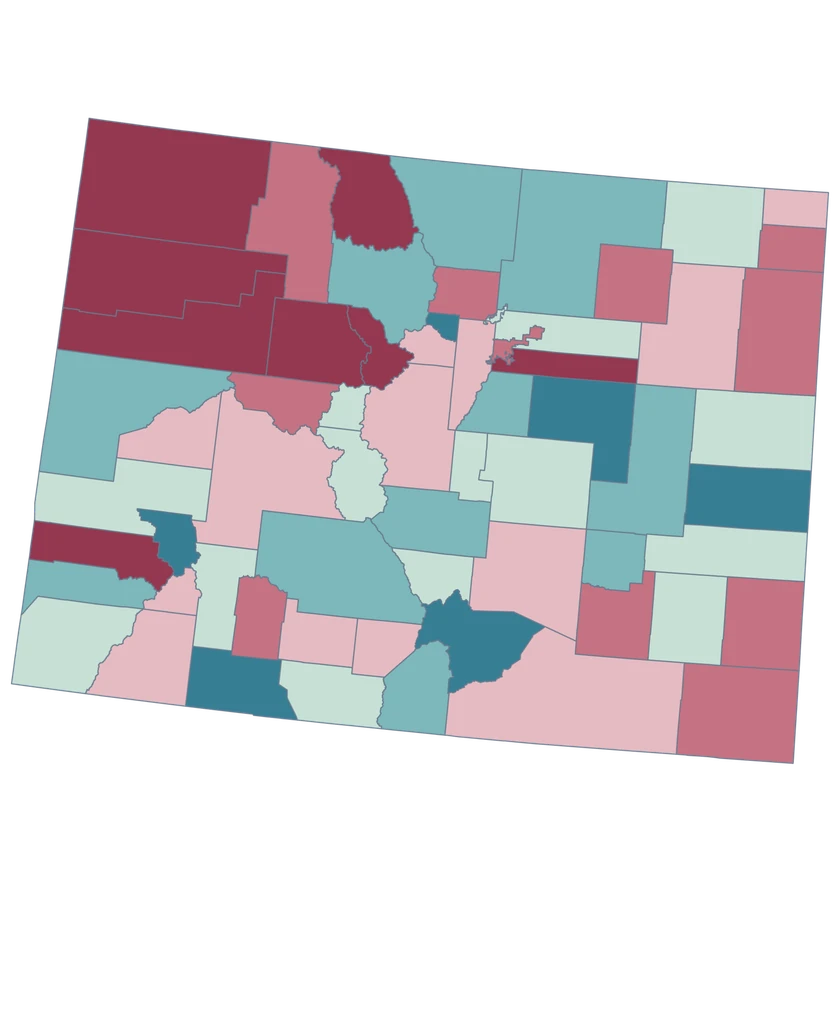
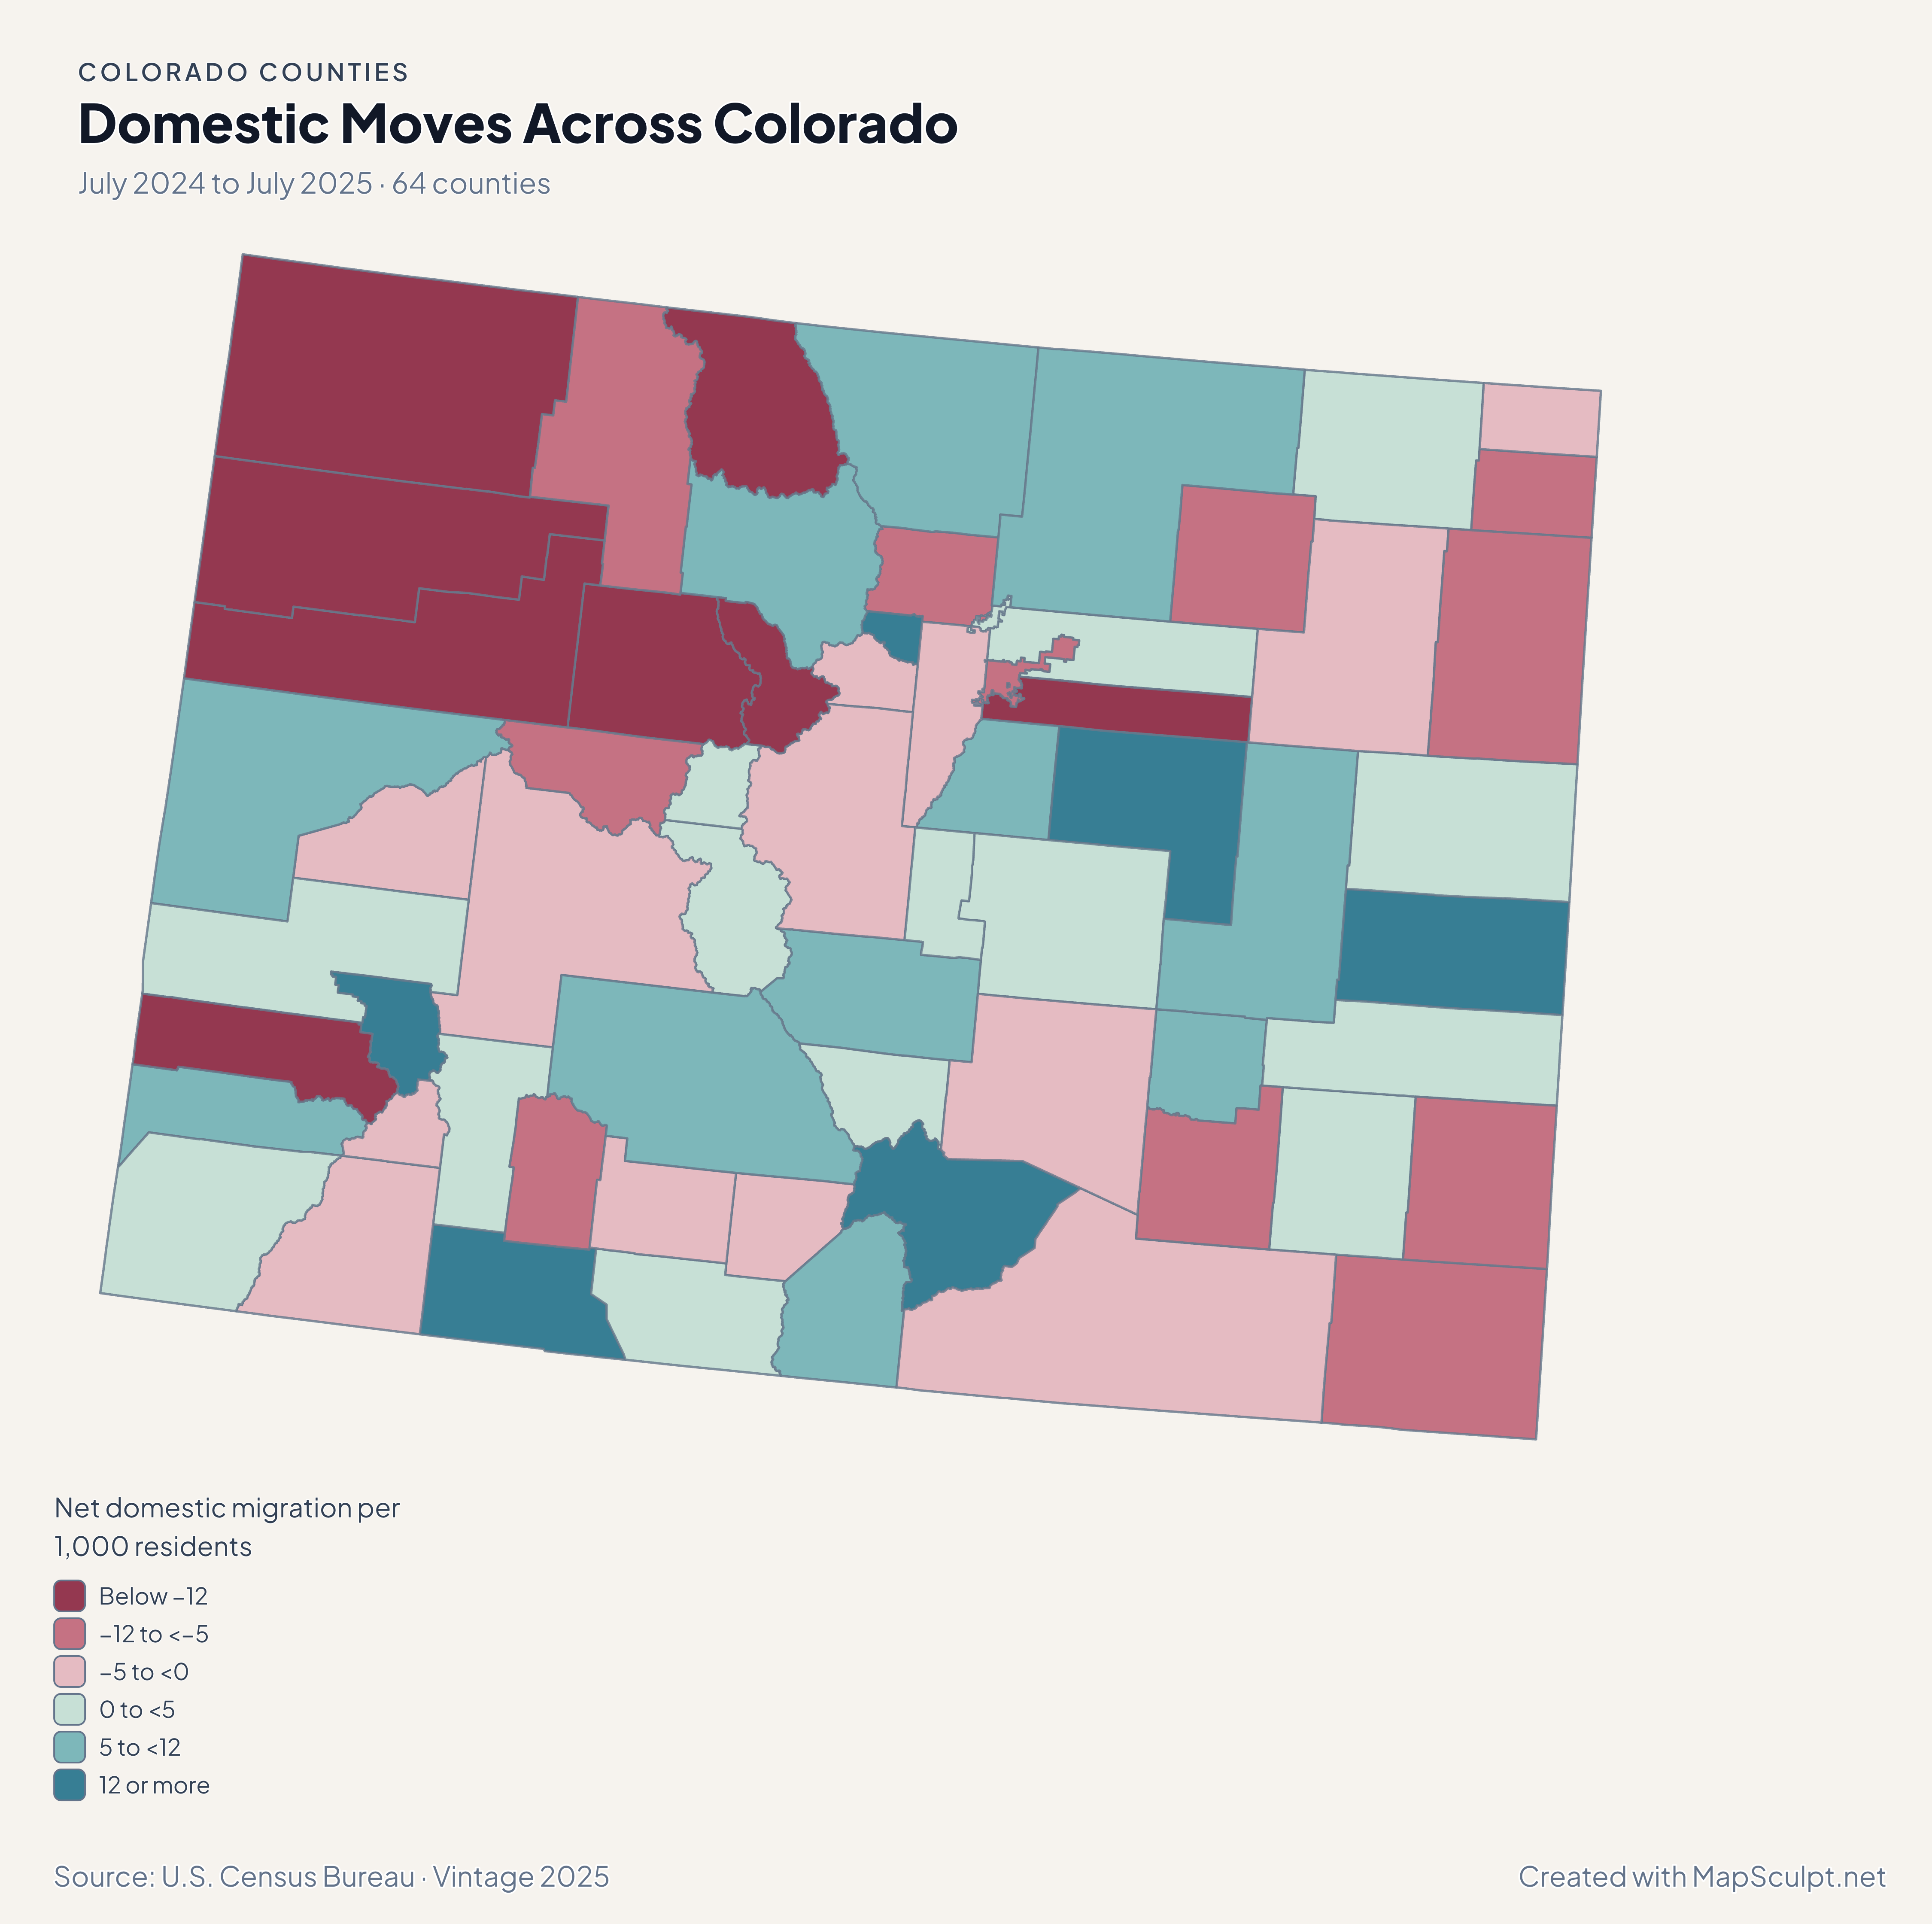
Domestic Moves Across Colorado

July 2024 to July 2025 · 64 counties

Colorado domestic migration map contrasting Denver and Eagle losses with gains in Douglas and Mesa.

Net domestic migration per 1,000 residents

  • Below −12
  • −12 to <−5
  • −5 to <0
  • 0 to <5
  • 5 to <12
  • 12 or more
U.S. Census Bureau · Vintage 2025Download complete PNG A migration rate measures the balance of moves within the US per 1,000 residents. It does not measure total population change.

KNOW YOUR GEOGRAPHY

Plains, mountain counties and small metro outlines.

The county map spans Colorado’s eastern plains, the Front Range and the Western Slope. Denver and Broomfield are each a consolidated city and county, represented here by separate county-level GEOIDs.

Use a zoomed view to select small metro polygons. A county fill covers the entire feature, so municipality, elevation and ski-area data need the appropriate geography or a county-level aggregation.

Browse all county GEOIDs ↗

2025 Census boundaries

OFFICIAL DATA

Which parts of Colorado gained domestic movers?

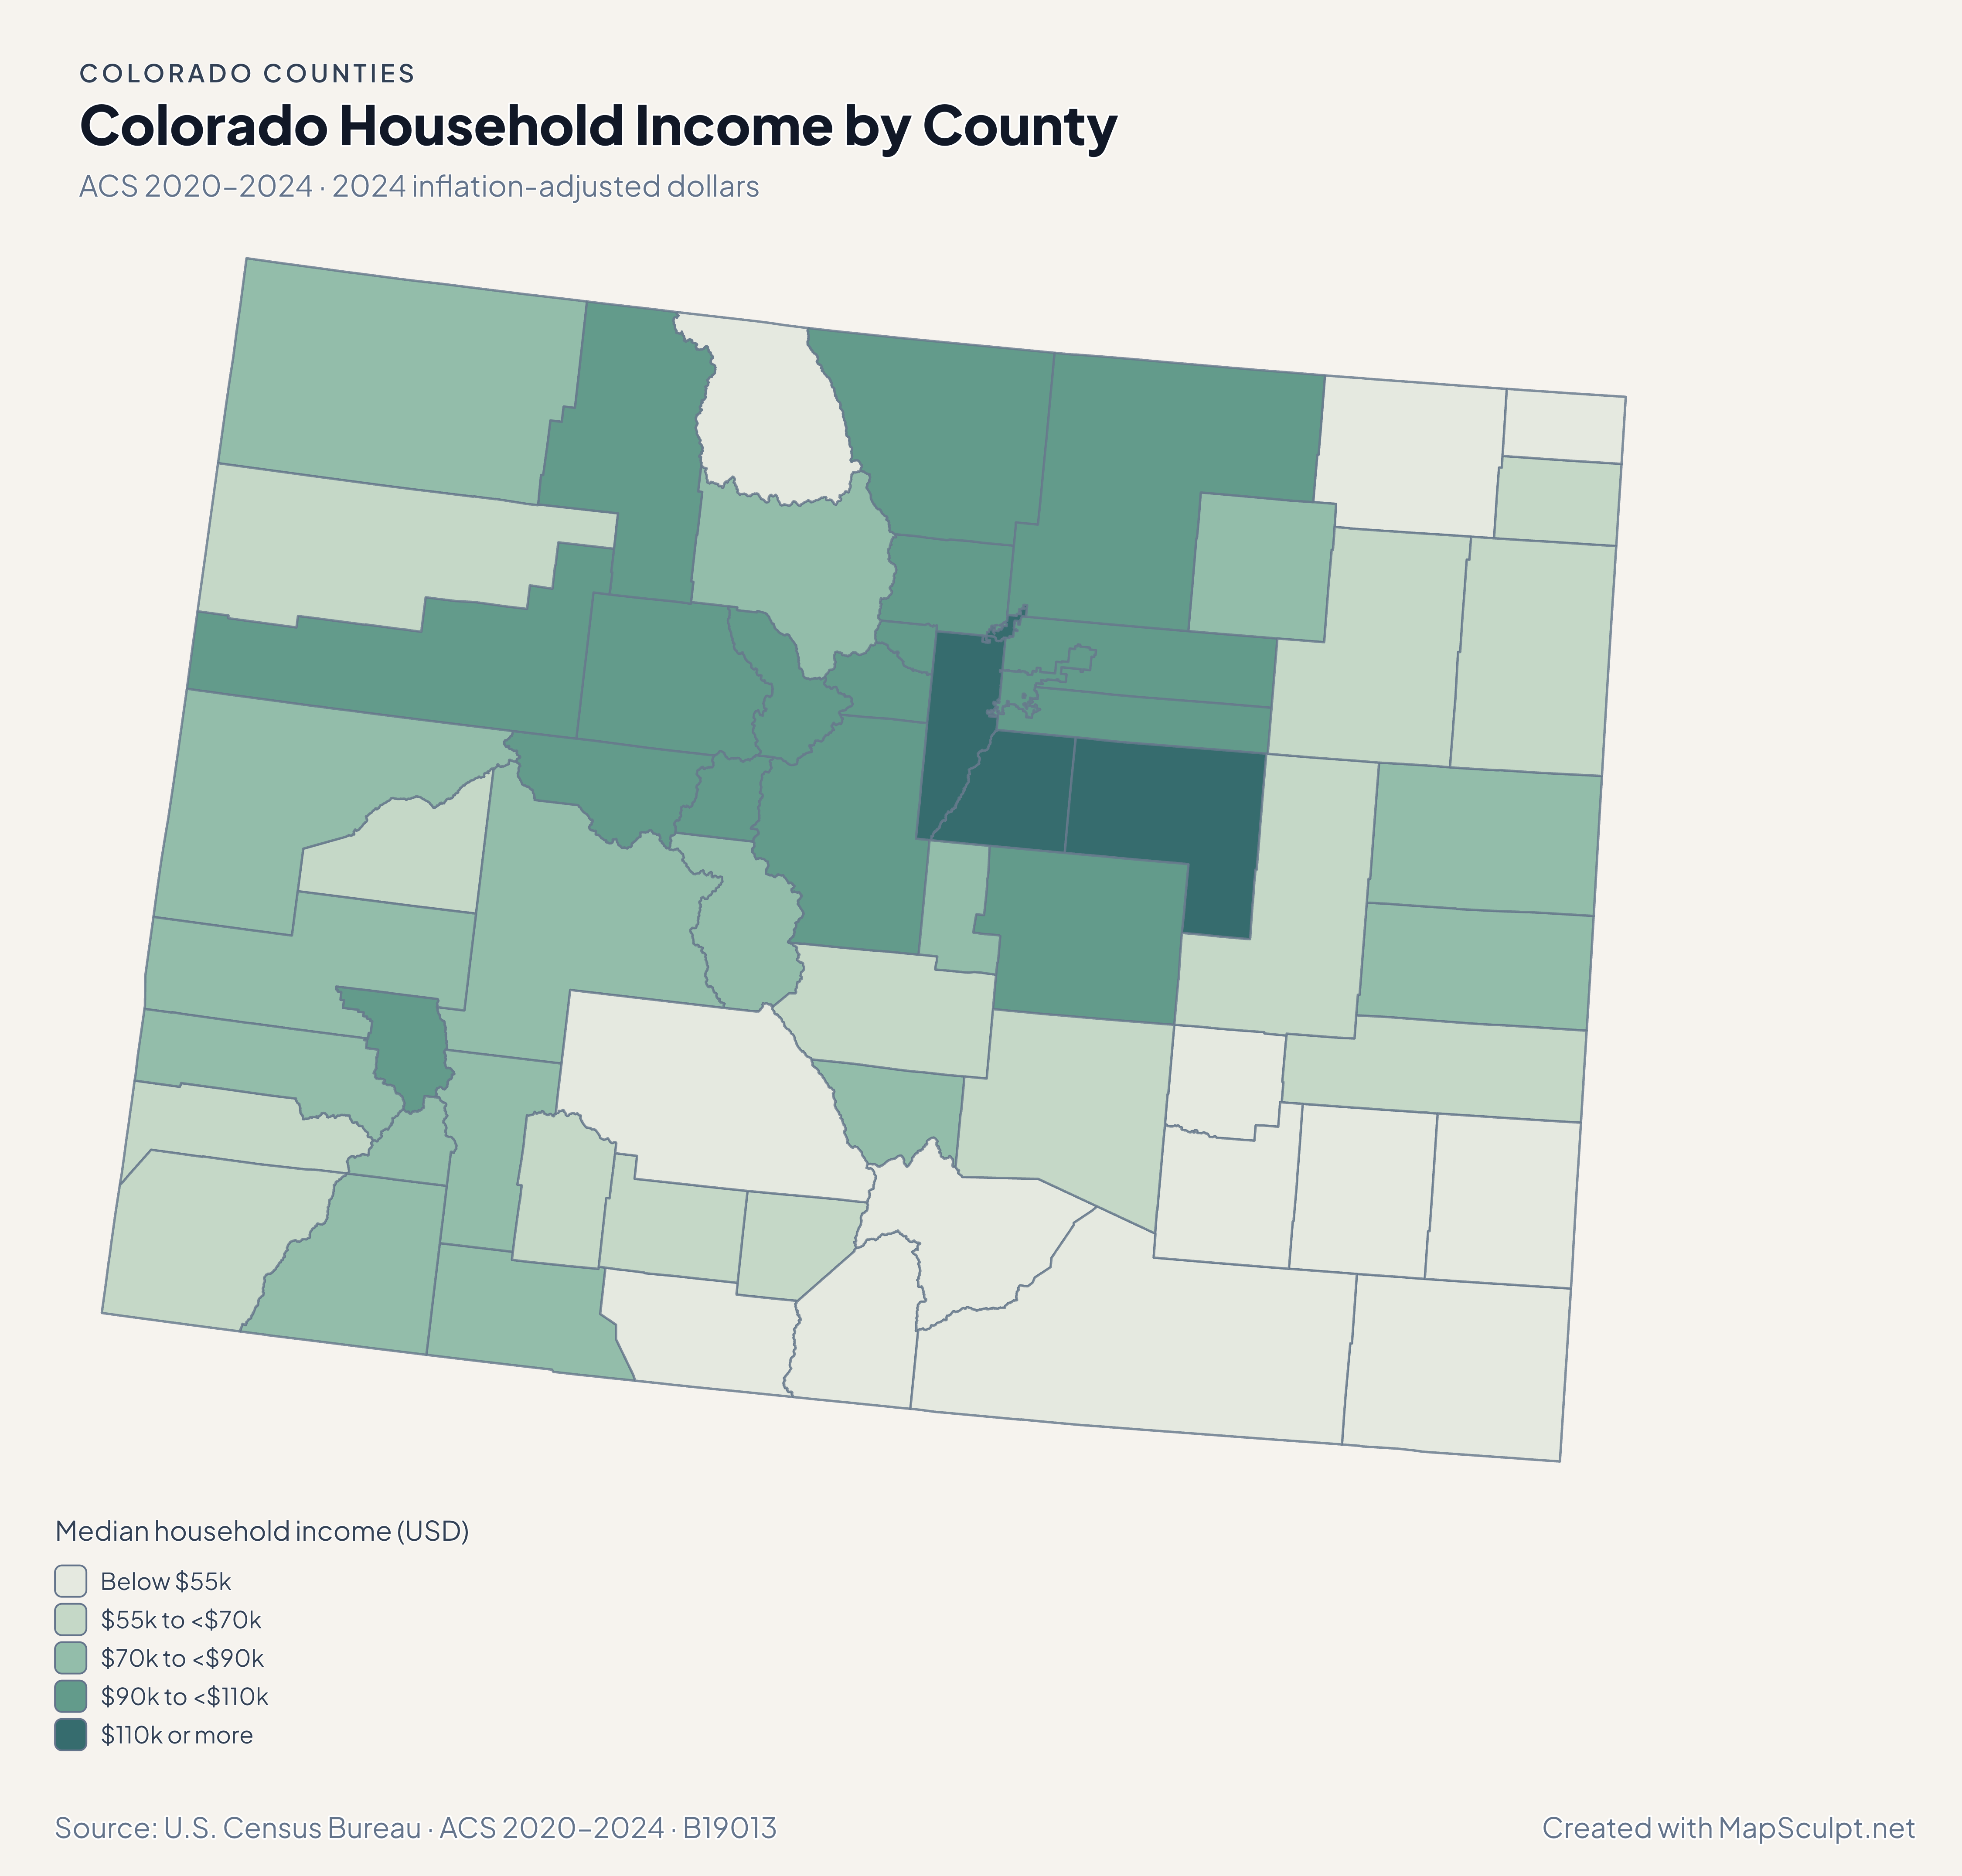
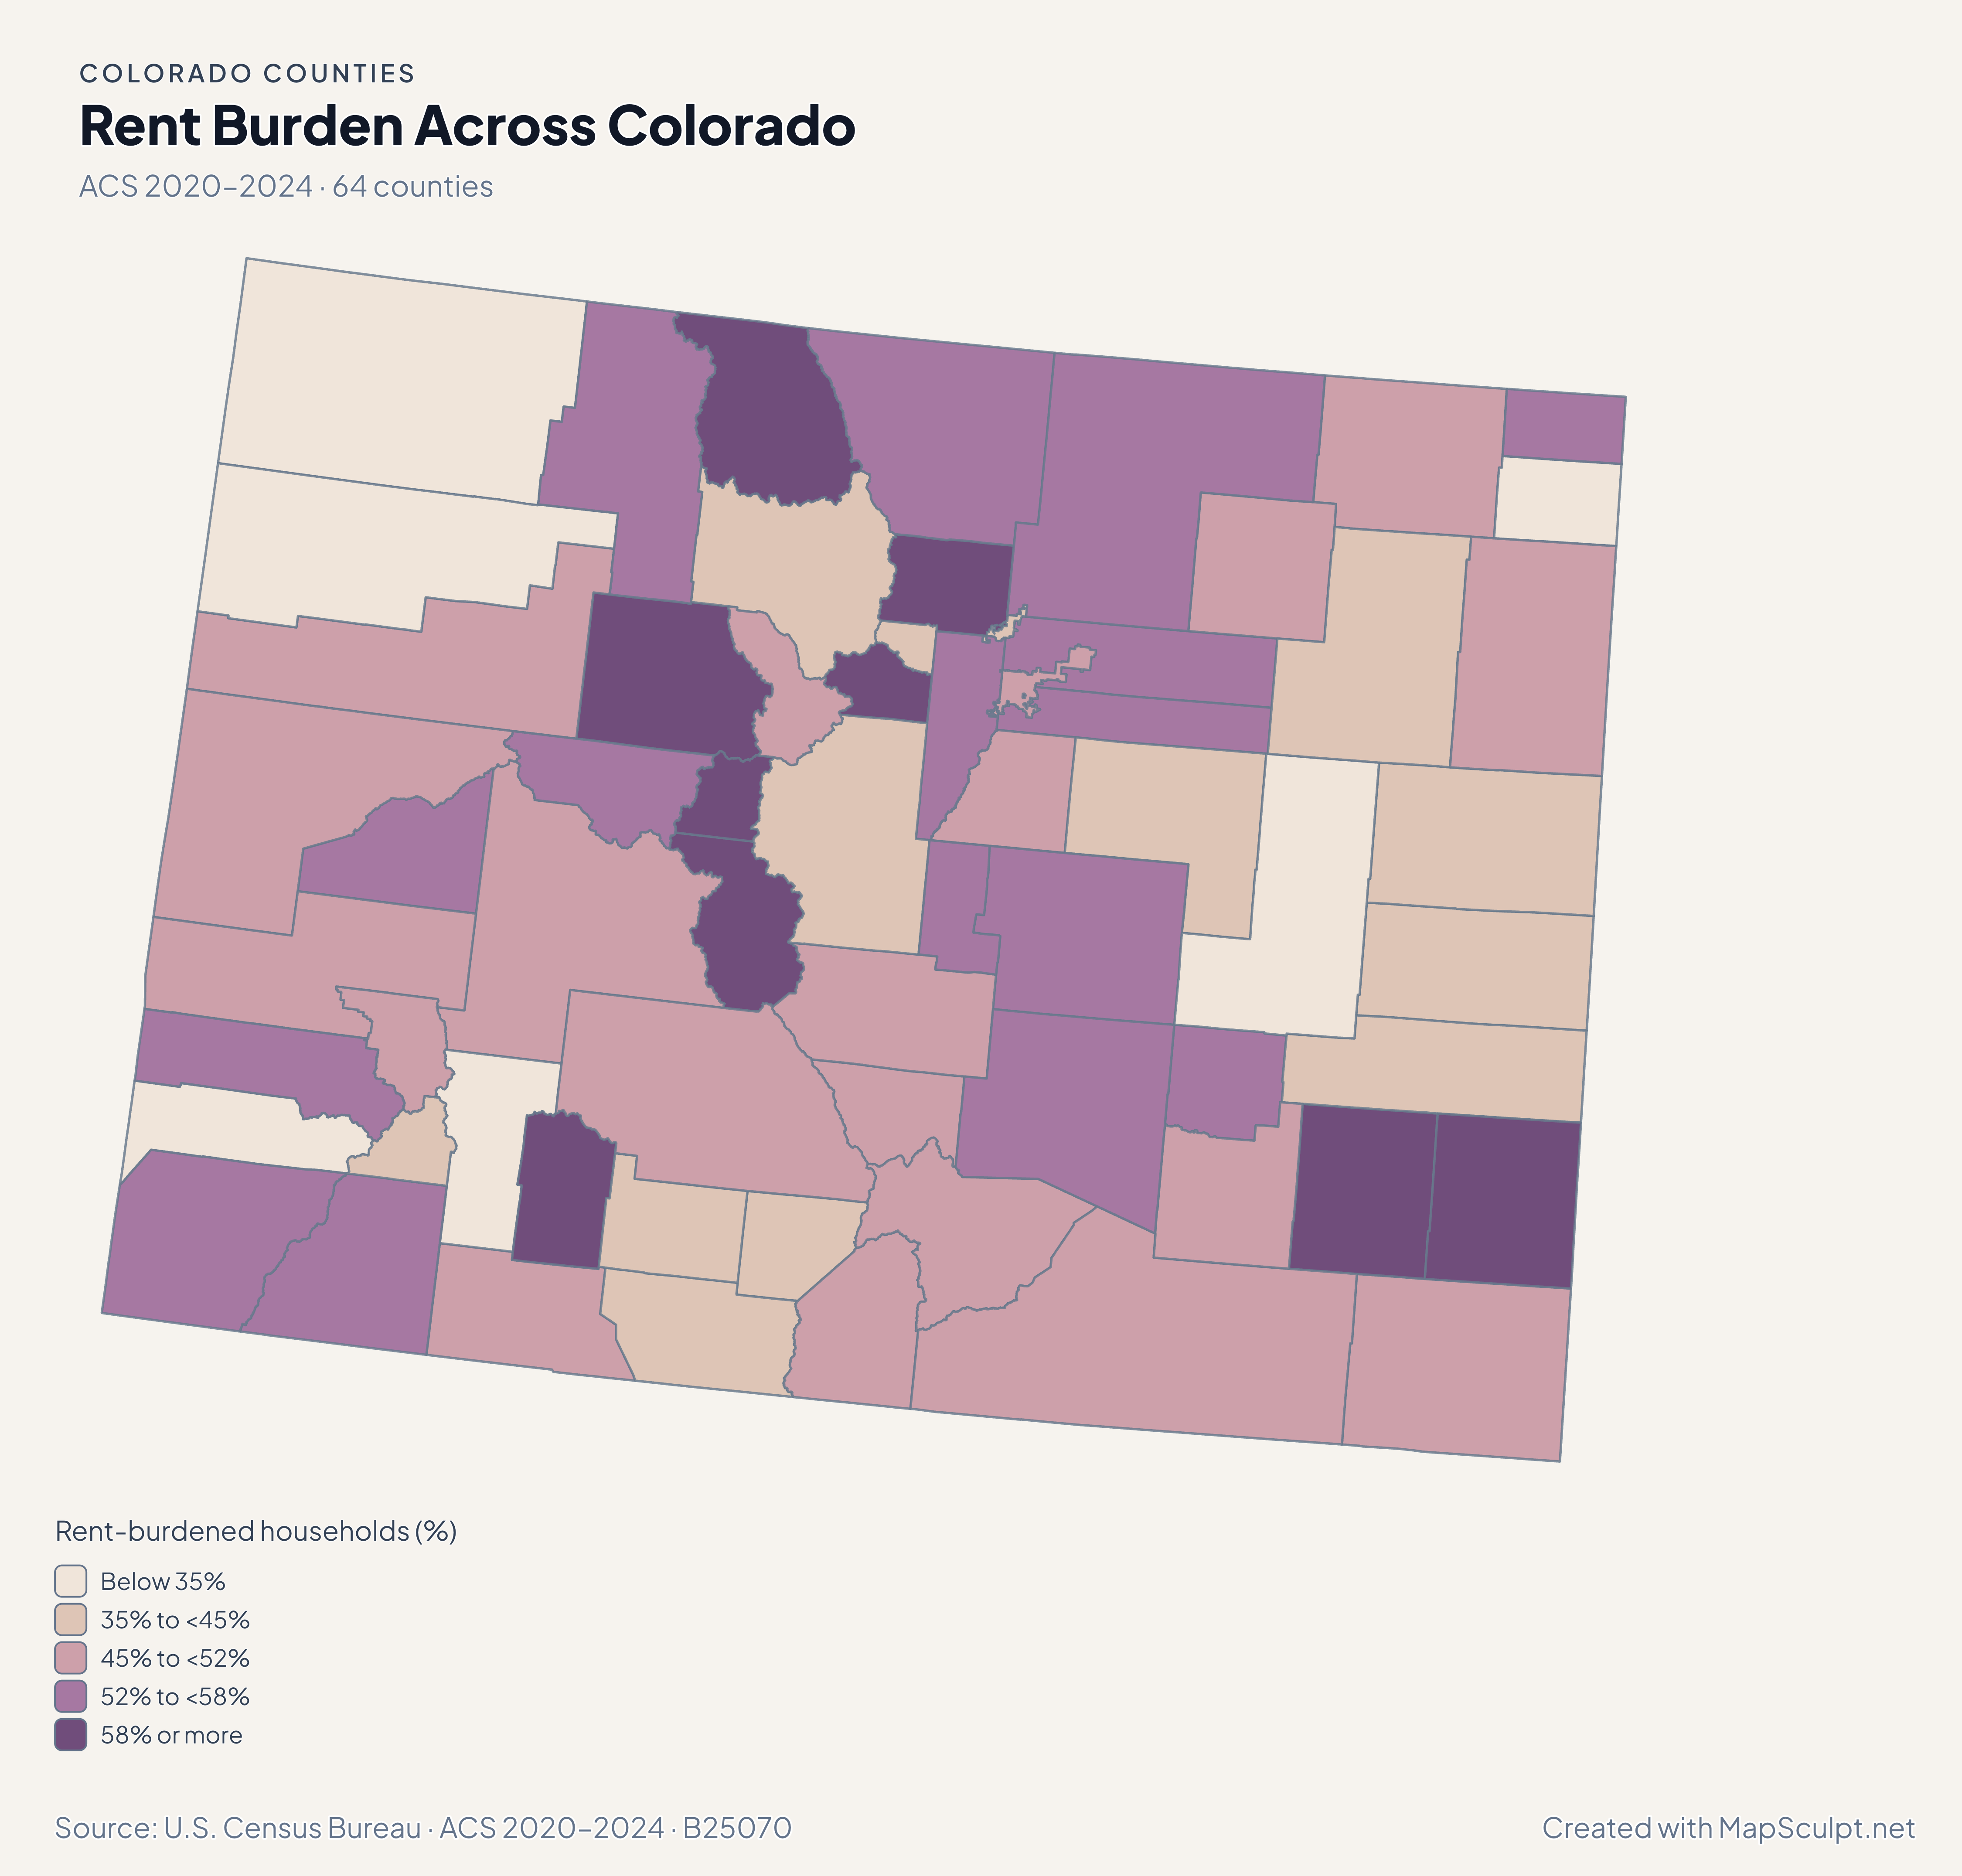
Read the signed migration and population maps together, then compare estimated incomes and renter costs at the same county scale.

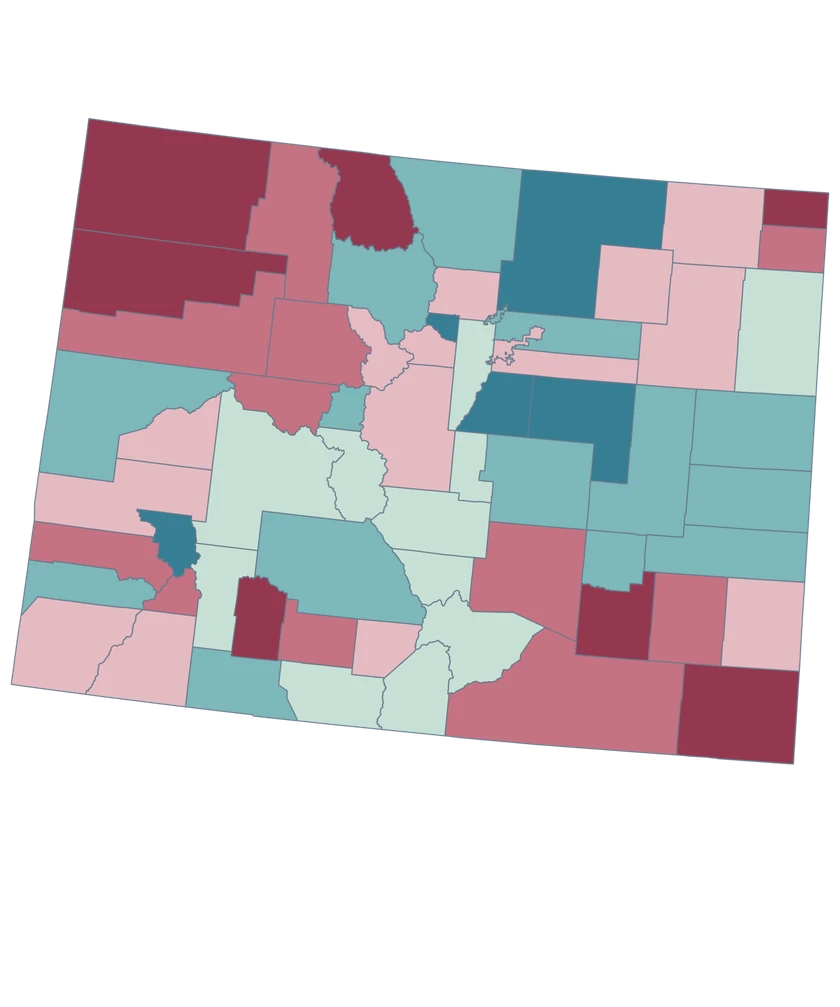
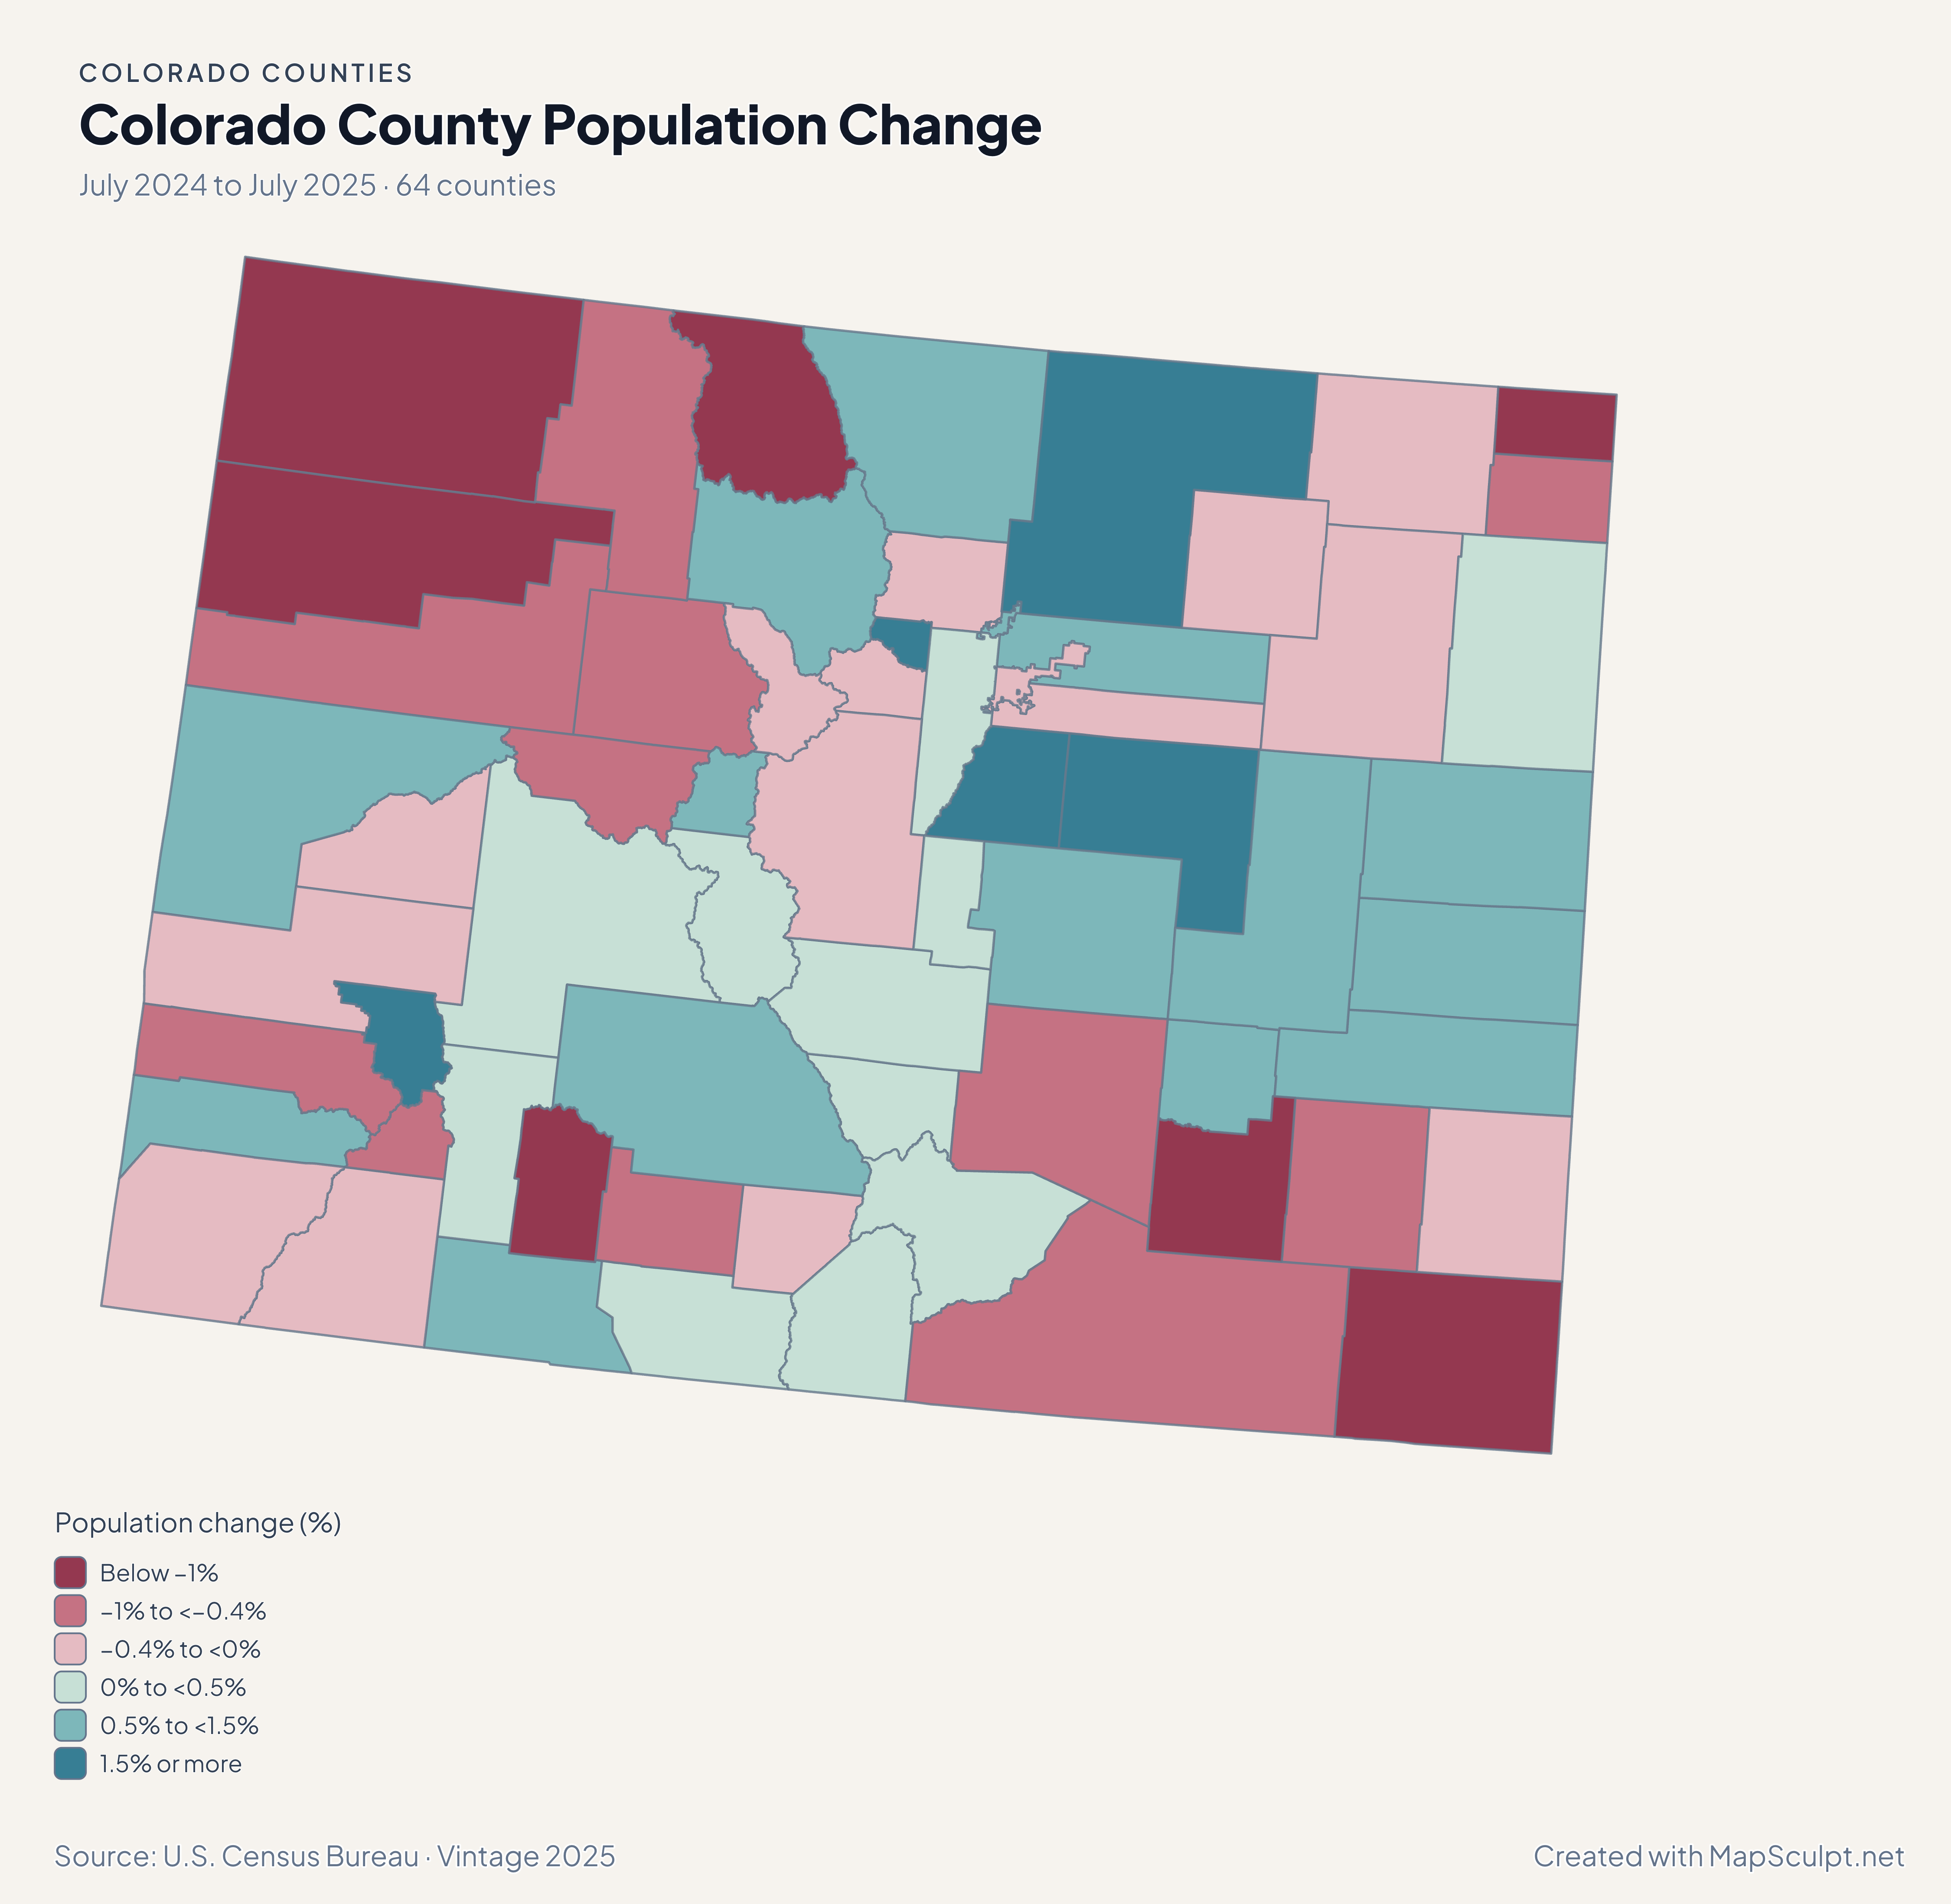
Colorado population change with Denver in a decline band and Douglas and Elbert in the highest growth band.

July 2024 to July 2025 · 64 counties

Growth varies along the Front Range.

Douglas gained 1.61% between July 2024 and July 2025, while Denver declined 0.13%. Farther east, Elbert grew 4.06%, the largest percentage gain in the state.

Population change (%)

  • Below −1%
  • −1% to <−0.4%
  • −0.4% to <0%
  • 0% to <0.5%
  • 0.5% to <1.5%
  • 1.5% or more

U.S. Census Bureau · Vintage 2025

Download complete PNG

Denver recorded a net domestic loss of 10.83 per 1,000 residents, while Douglas gained 8.40. West of the divide, Mesa gained 10.10 and Eagle lost 12.16. Each rate uses its own county’s average July population. See the Census estimates ↗

MAKE IT YOURS

From county data to a finished map.

  1. Choose the editor

    For a Front Range comparison, work in the statewide editor and zoom in to inspect Denver and Broomfield.

  2. Match the county rows

    Join county-wide rows with five-digit GEOIDs. Keep the leading zero in 08031 for Denver County.

  3. Write the legend

    When mapping migration, place a break at zero and label each rate per 1,000 residents.

  4. Export the map

    Open the PNG preview and check the small metro polygons against the surrounding counties.

TRY CSV IMPORT

Practice a six-county join in Colorado.

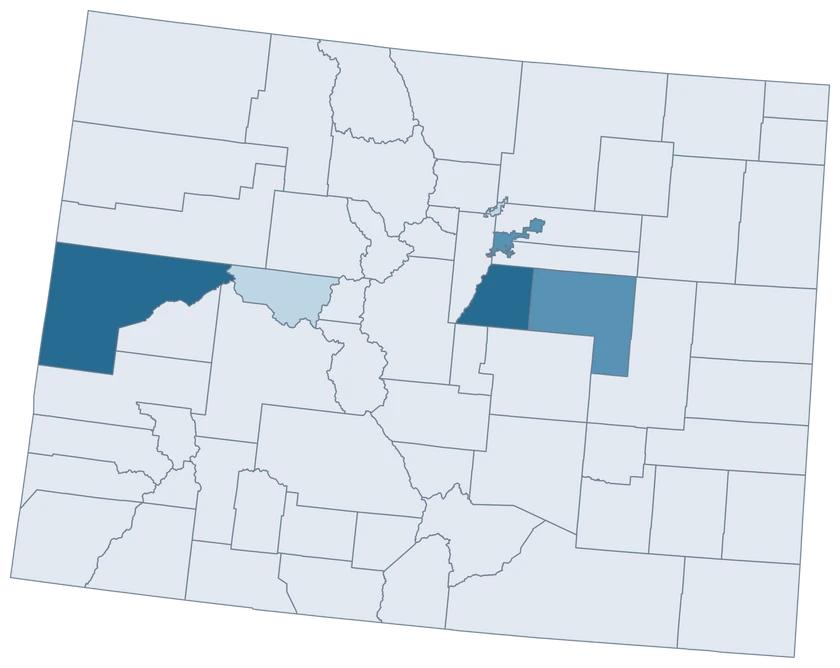
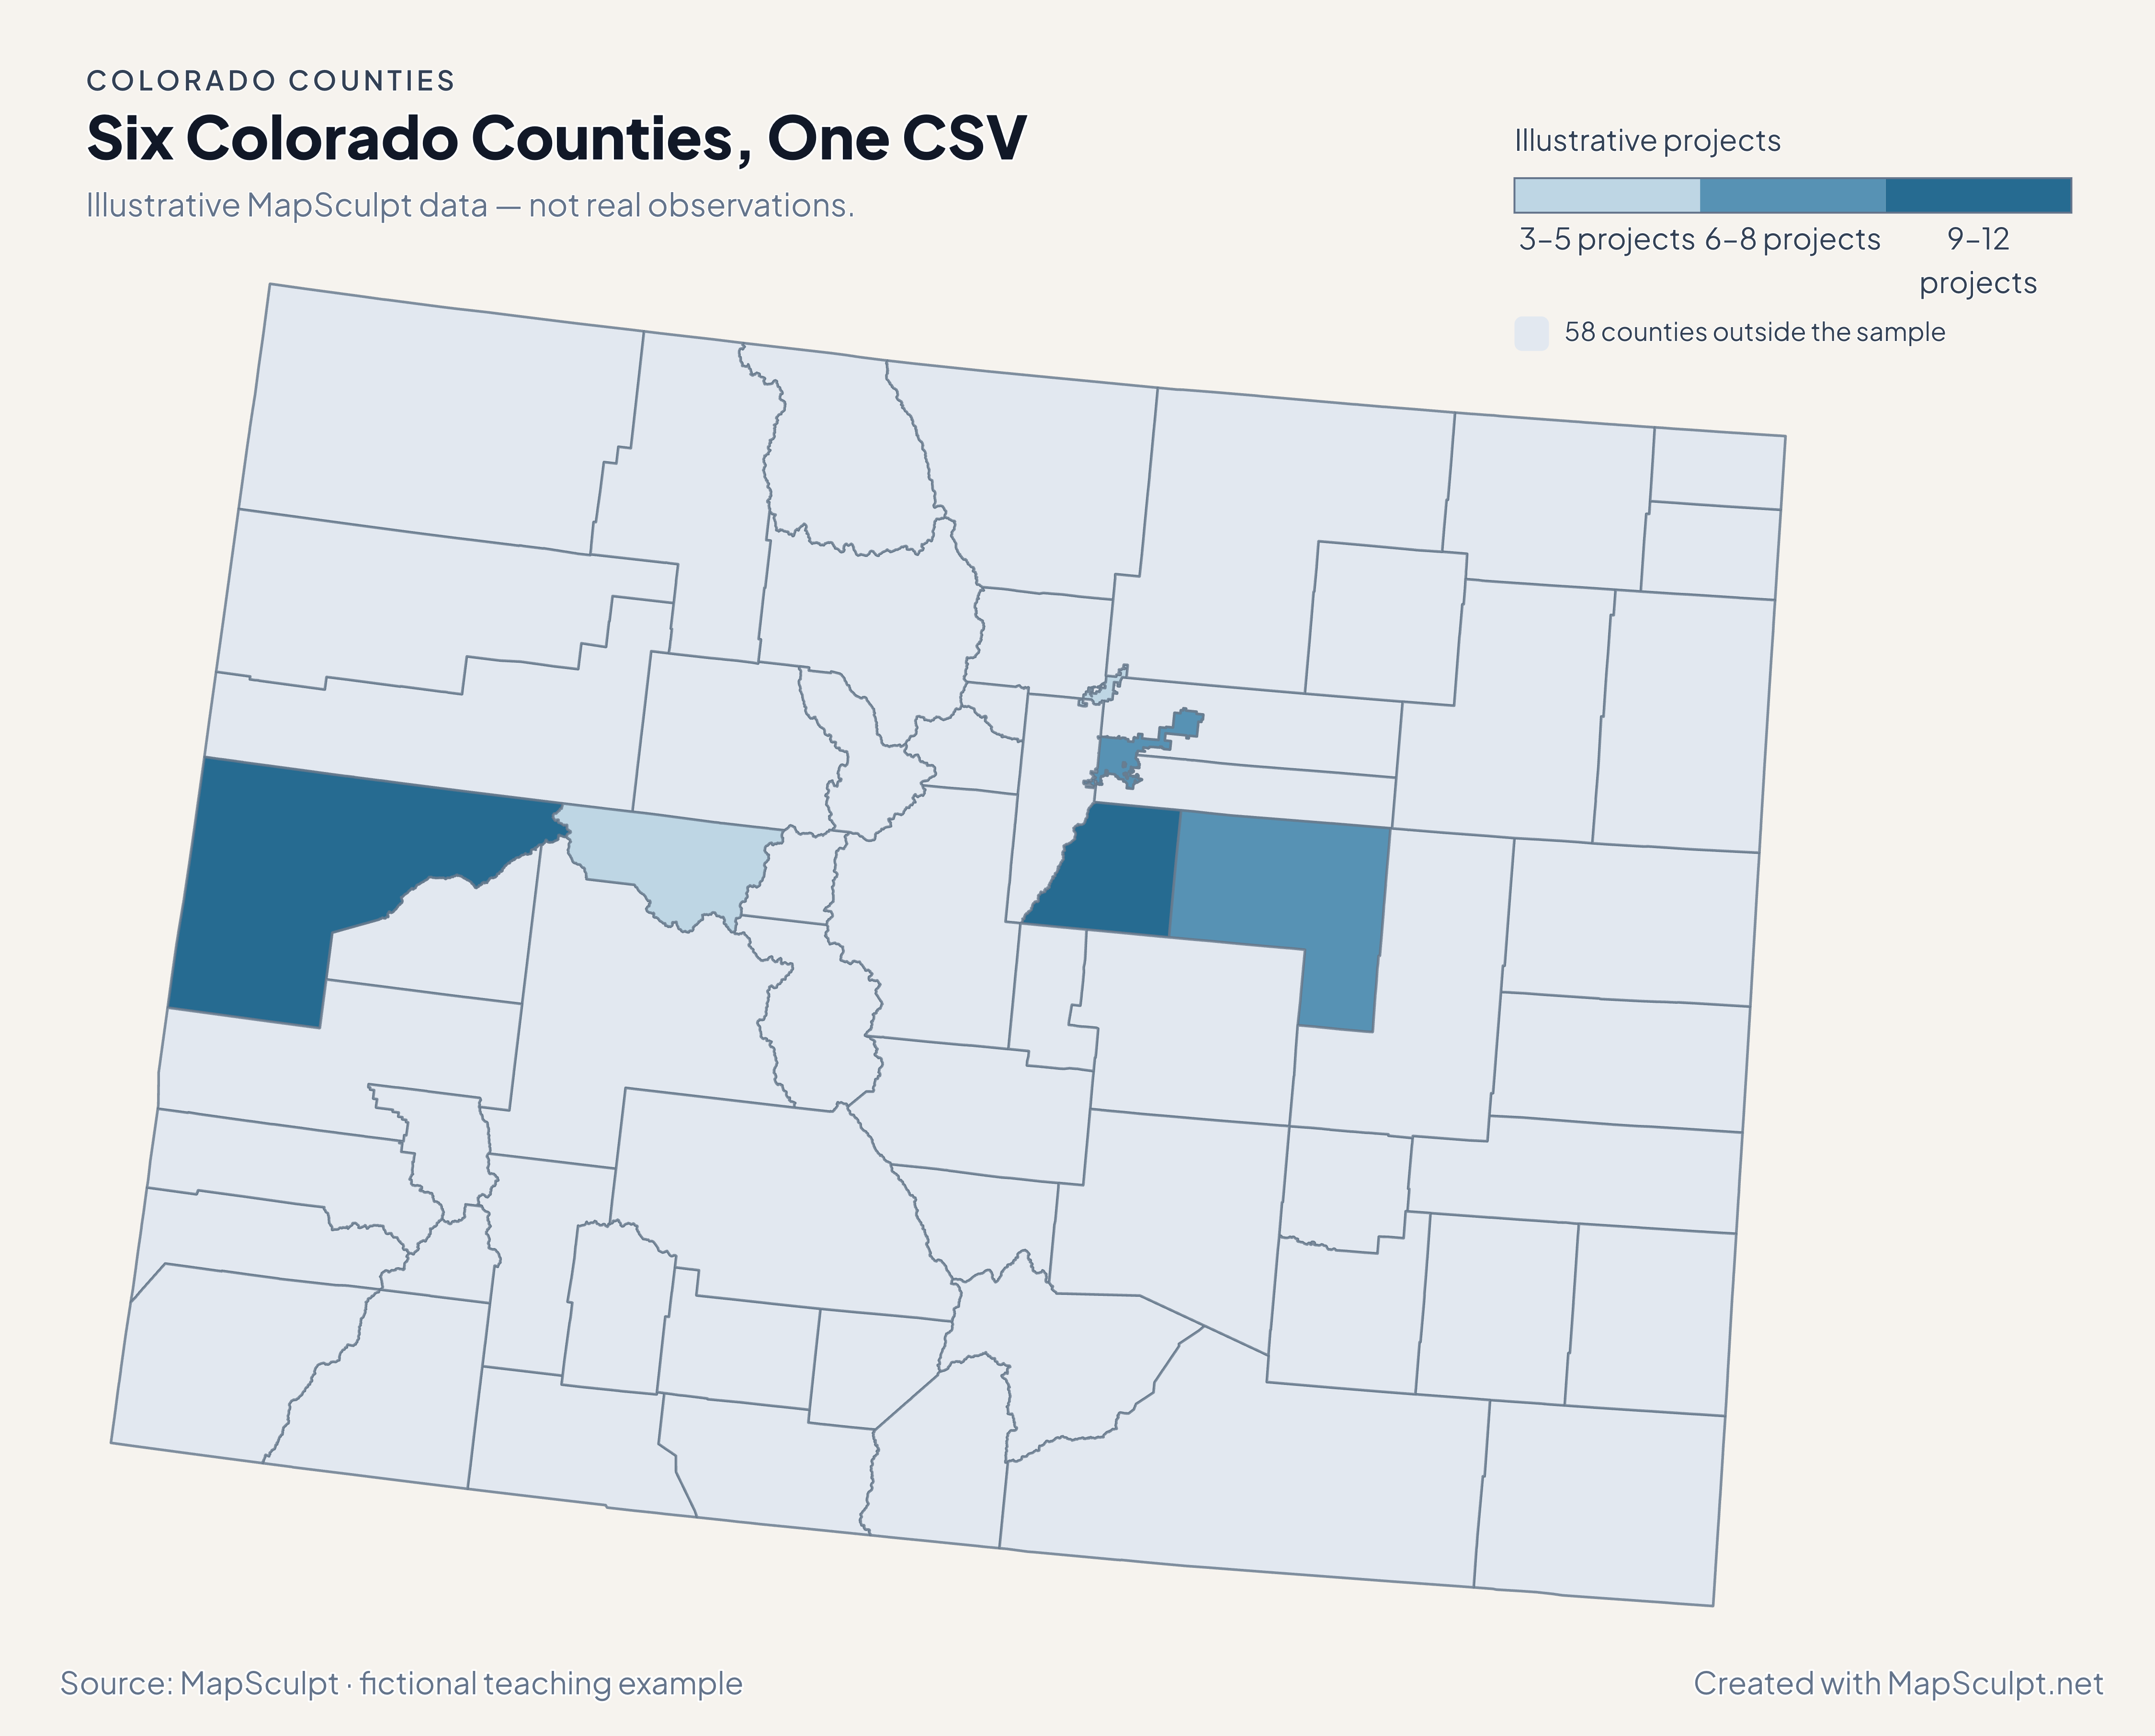
Import the fictional project counts, choose IllustrativeProjects, and set numeric boundaries of 3, 6, 9 and 12. The other 58 counties remain neutral.

Illustrative MapSculpt data — not real observations.
CountyGEOIDProjects
Denver County080318
Broomfield County080144
Douglas County0803512
Mesa County080779
Pitkin County080973
Elbert County080396

Keep GEOIDs as text. The sample matches Denver County with 08031. Check the directory for official names and codes before importing your data.

Download illustrative CSV ↓

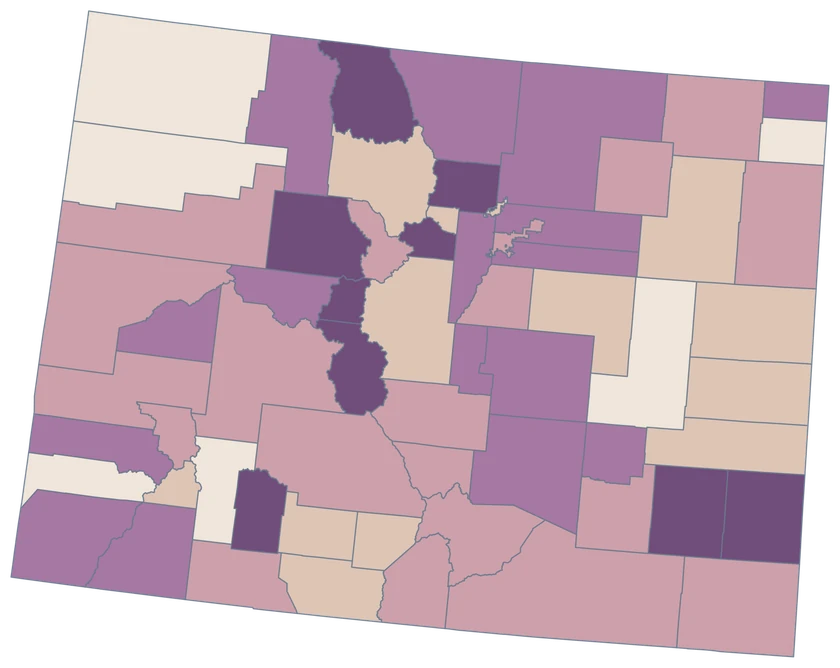
Six Colorado Counties, One CSV

Illustrative MapSculpt data — not real observations.

Fictional project counts across six Colorado counties. The other 58 counties are neutral.

Illustrative projects

  • 3–5 projects
  • 6–8 projects
  • 9–12 projects
  • 58 counties outside the sample
Download complete PNG

CSV → Match 6 counties → Style → Export PNG Create a Colorado map

COUNTY REFERENCE

Find all 64 Colorado county GEOIDs.

Official county names and five-digit Census GEOIDs. Search by name or code.

  1. Adams CountyGEOID 08001
  2. Alamosa CountyGEOID 08003
  3. Arapahoe CountyGEOID 08005
  4. Archuleta CountyGEOID 08007
  5. Baca CountyGEOID 08009
  6. Bent CountyGEOID 08011
  7. Boulder CountyGEOID 08013
  8. Broomfield CountyGEOID 08014
  9. Chaffee CountyGEOID 08015
  10. Cheyenne CountyGEOID 08017
  11. Clear Creek CountyGEOID 08019
  12. Conejos CountyGEOID 08021
  13. Costilla CountyGEOID 08023
  14. Crowley CountyGEOID 08025
  15. Custer CountyGEOID 08027
  16. Delta CountyGEOID 08029
  17. Denver CountyGEOID 08031
  18. Dolores CountyGEOID 08033
  19. Douglas CountyGEOID 08035
  20. Eagle CountyGEOID 08037
  21. El Paso CountyGEOID 08041
  22. Elbert CountyGEOID 08039
  23. Fremont CountyGEOID 08043
  24. Garfield CountyGEOID 08045
  25. Gilpin CountyGEOID 08047
  26. Grand CountyGEOID 08049
  27. Gunnison CountyGEOID 08051
  28. Hinsdale CountyGEOID 08053
  29. Huerfano CountyGEOID 08055
  30. Jackson CountyGEOID 08057
  31. Jefferson CountyGEOID 08059
  32. Kiowa CountyGEOID 08061
  33. Kit Carson CountyGEOID 08063
  34. La Plata CountyGEOID 08067
  35. Lake CountyGEOID 08065
  36. Larimer CountyGEOID 08069
  37. Las Animas CountyGEOID 08071
  38. Lincoln CountyGEOID 08073
  39. Logan CountyGEOID 08075
  40. Mesa CountyGEOID 08077
  41. Mineral CountyGEOID 08079
  42. Moffat CountyGEOID 08081
  43. Montezuma CountyGEOID 08083
  44. Montrose CountyGEOID 08085
  45. Morgan CountyGEOID 08087
  46. Otero CountyGEOID 08089
  47. Ouray CountyGEOID 08091
  48. Park CountyGEOID 08093
  49. Phillips CountyGEOID 08095
  50. Pitkin CountyGEOID 08097
  51. Prowers CountyGEOID 08099
  52. Pueblo CountyGEOID 08101
  53. Rio Blanco CountyGEOID 08103
  54. Rio Grande CountyGEOID 08105
  55. Routt CountyGEOID 08107
  56. Saguache CountyGEOID 08109
  57. San Juan CountyGEOID 08111
  58. San Miguel CountyGEOID 08113
  59. Sedgwick CountyGEOID 08115
  60. Summit CountyGEOID 08117
  61. Teller CountyGEOID 08119
  62. Washington CountyGEOID 08121
  63. Weld CountyGEOID 08123
  64. Yuma CountyGEOID 08125

U.S. Census Bureau · 2025 Cartographic Boundary Files

COMMON QUESTIONS

Colorado county map questions.

Why do Colorado GEOIDs start with 08?

Colorado’s state FIPS code is 08. Keep the leading zero in the five-digit county GEOID, such as 08031 for Denver.

Are Denver and Broomfield separate features?

Yes. Denver uses 08031 and Broomfield uses 08014. Each has a single county-level identity.

Can I compare the Front Range with the Western Slope?

Choose counties that represent the area you are comparing. Use one consistent indicator and time period across them.

Does the western outline show mountain ranges?

It shows administrative county outlines. Use a separate terrain layer if your project needs mountain ranges or elevation.

Why did Denver and Douglas receive different migration colors?

Denver had a net domestic loss and Douglas had a gain. The legend uses zero as a class boundary.

Can I join records for a ski town directly?

Use a county GEOID only when the observation covers an entire county. A town-specific observation needs town geography or a suitable aggregation.

YOUR NEXT MAP STARTS HERE

Build a Colorado map at county scale.

Join official county identifiers to your values, choose a readable legend, and download your finished Colorado map.

Create a Colorado map