Skip to content
MapSculpt

GEOGRAPHIC MAP MAKER / ARIZONA

Arizona
Counties Map Maker

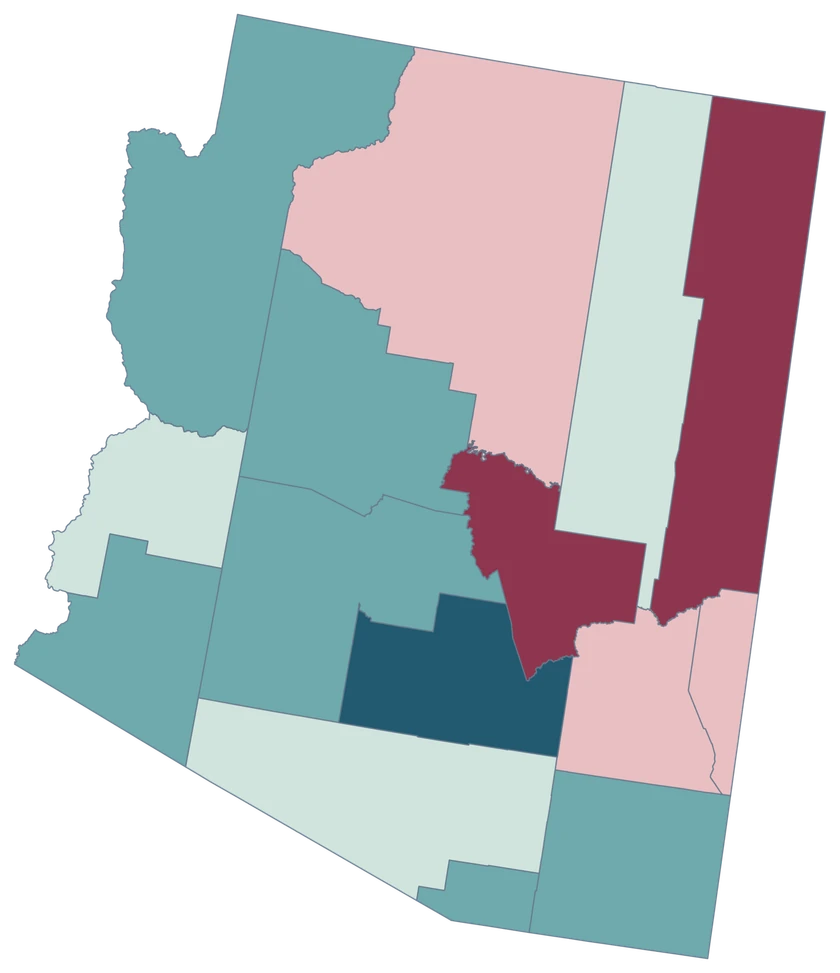
Compare Pinal’s rapid growth with the slower changes in Maricopa and Pima. Arizona’s 15 broad county shapes leave room to see the pattern and build your own custom map.

Free online editor · No sign-up required

15counties
individually editable

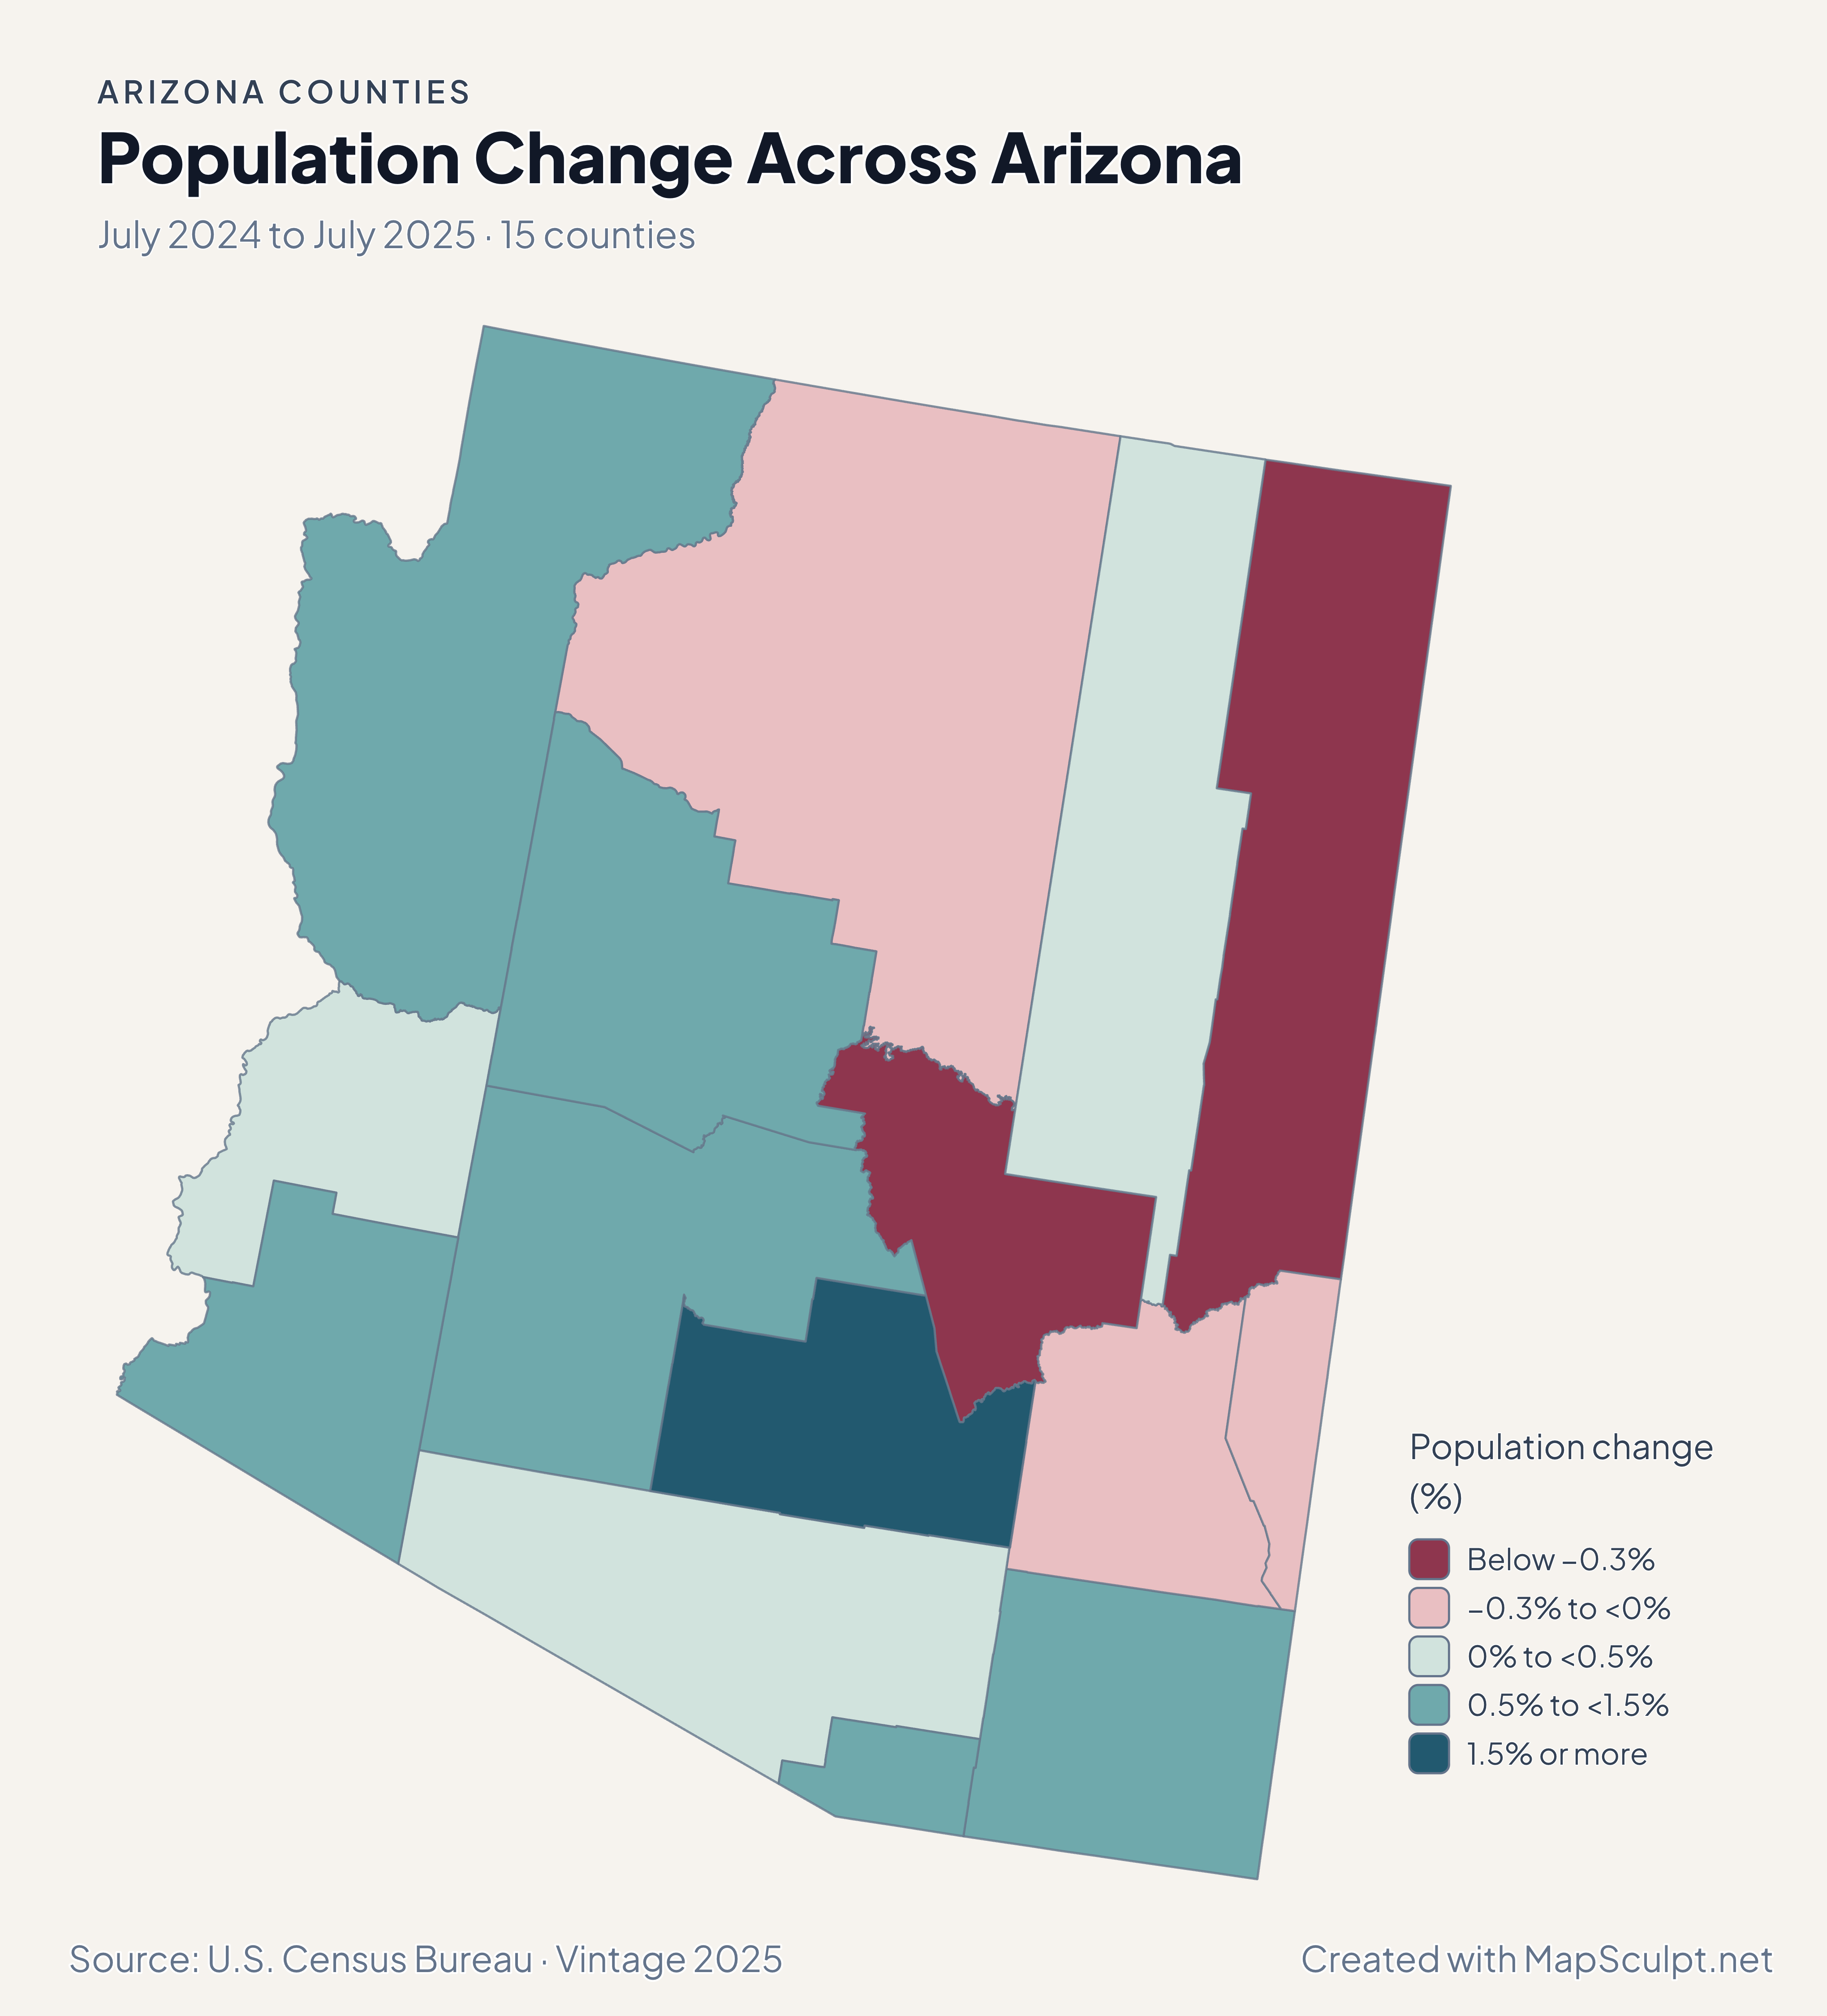
Population Change Across Arizona

July 2024 to July 2025 · 15 counties

Arizona population change map with Pinal in a distinct top growth band between Maricopa and Pima.

Population change (%)

  • Below −0.3%
  • −0.3% to <0%
  • 0% to <0.5%
  • 0.5% to <1.5%
  • 1.5% or more
U.S. Census Bureau · Vintage 2025Download complete PNG Percentage change compares each area with its July 2024 population.

KNOW YOUR GEOGRAPHY

Fifteen counties across a large state.

The county map spans the Colorado River border, the northern plateau, metropolitan Phoenix and the Sonoran Desert. County features cover large areas, so a single fill can describe very different communities.

Maricopa and Pima are whole counties. City boundaries, Tribal lands and ZIP codes require their own boundary layers and data at the corresponding scale.

Browse all county GEOIDs ↗

2025 Census boundaries

OFFICIAL DATA

Where Arizona’s county patterns diverge.

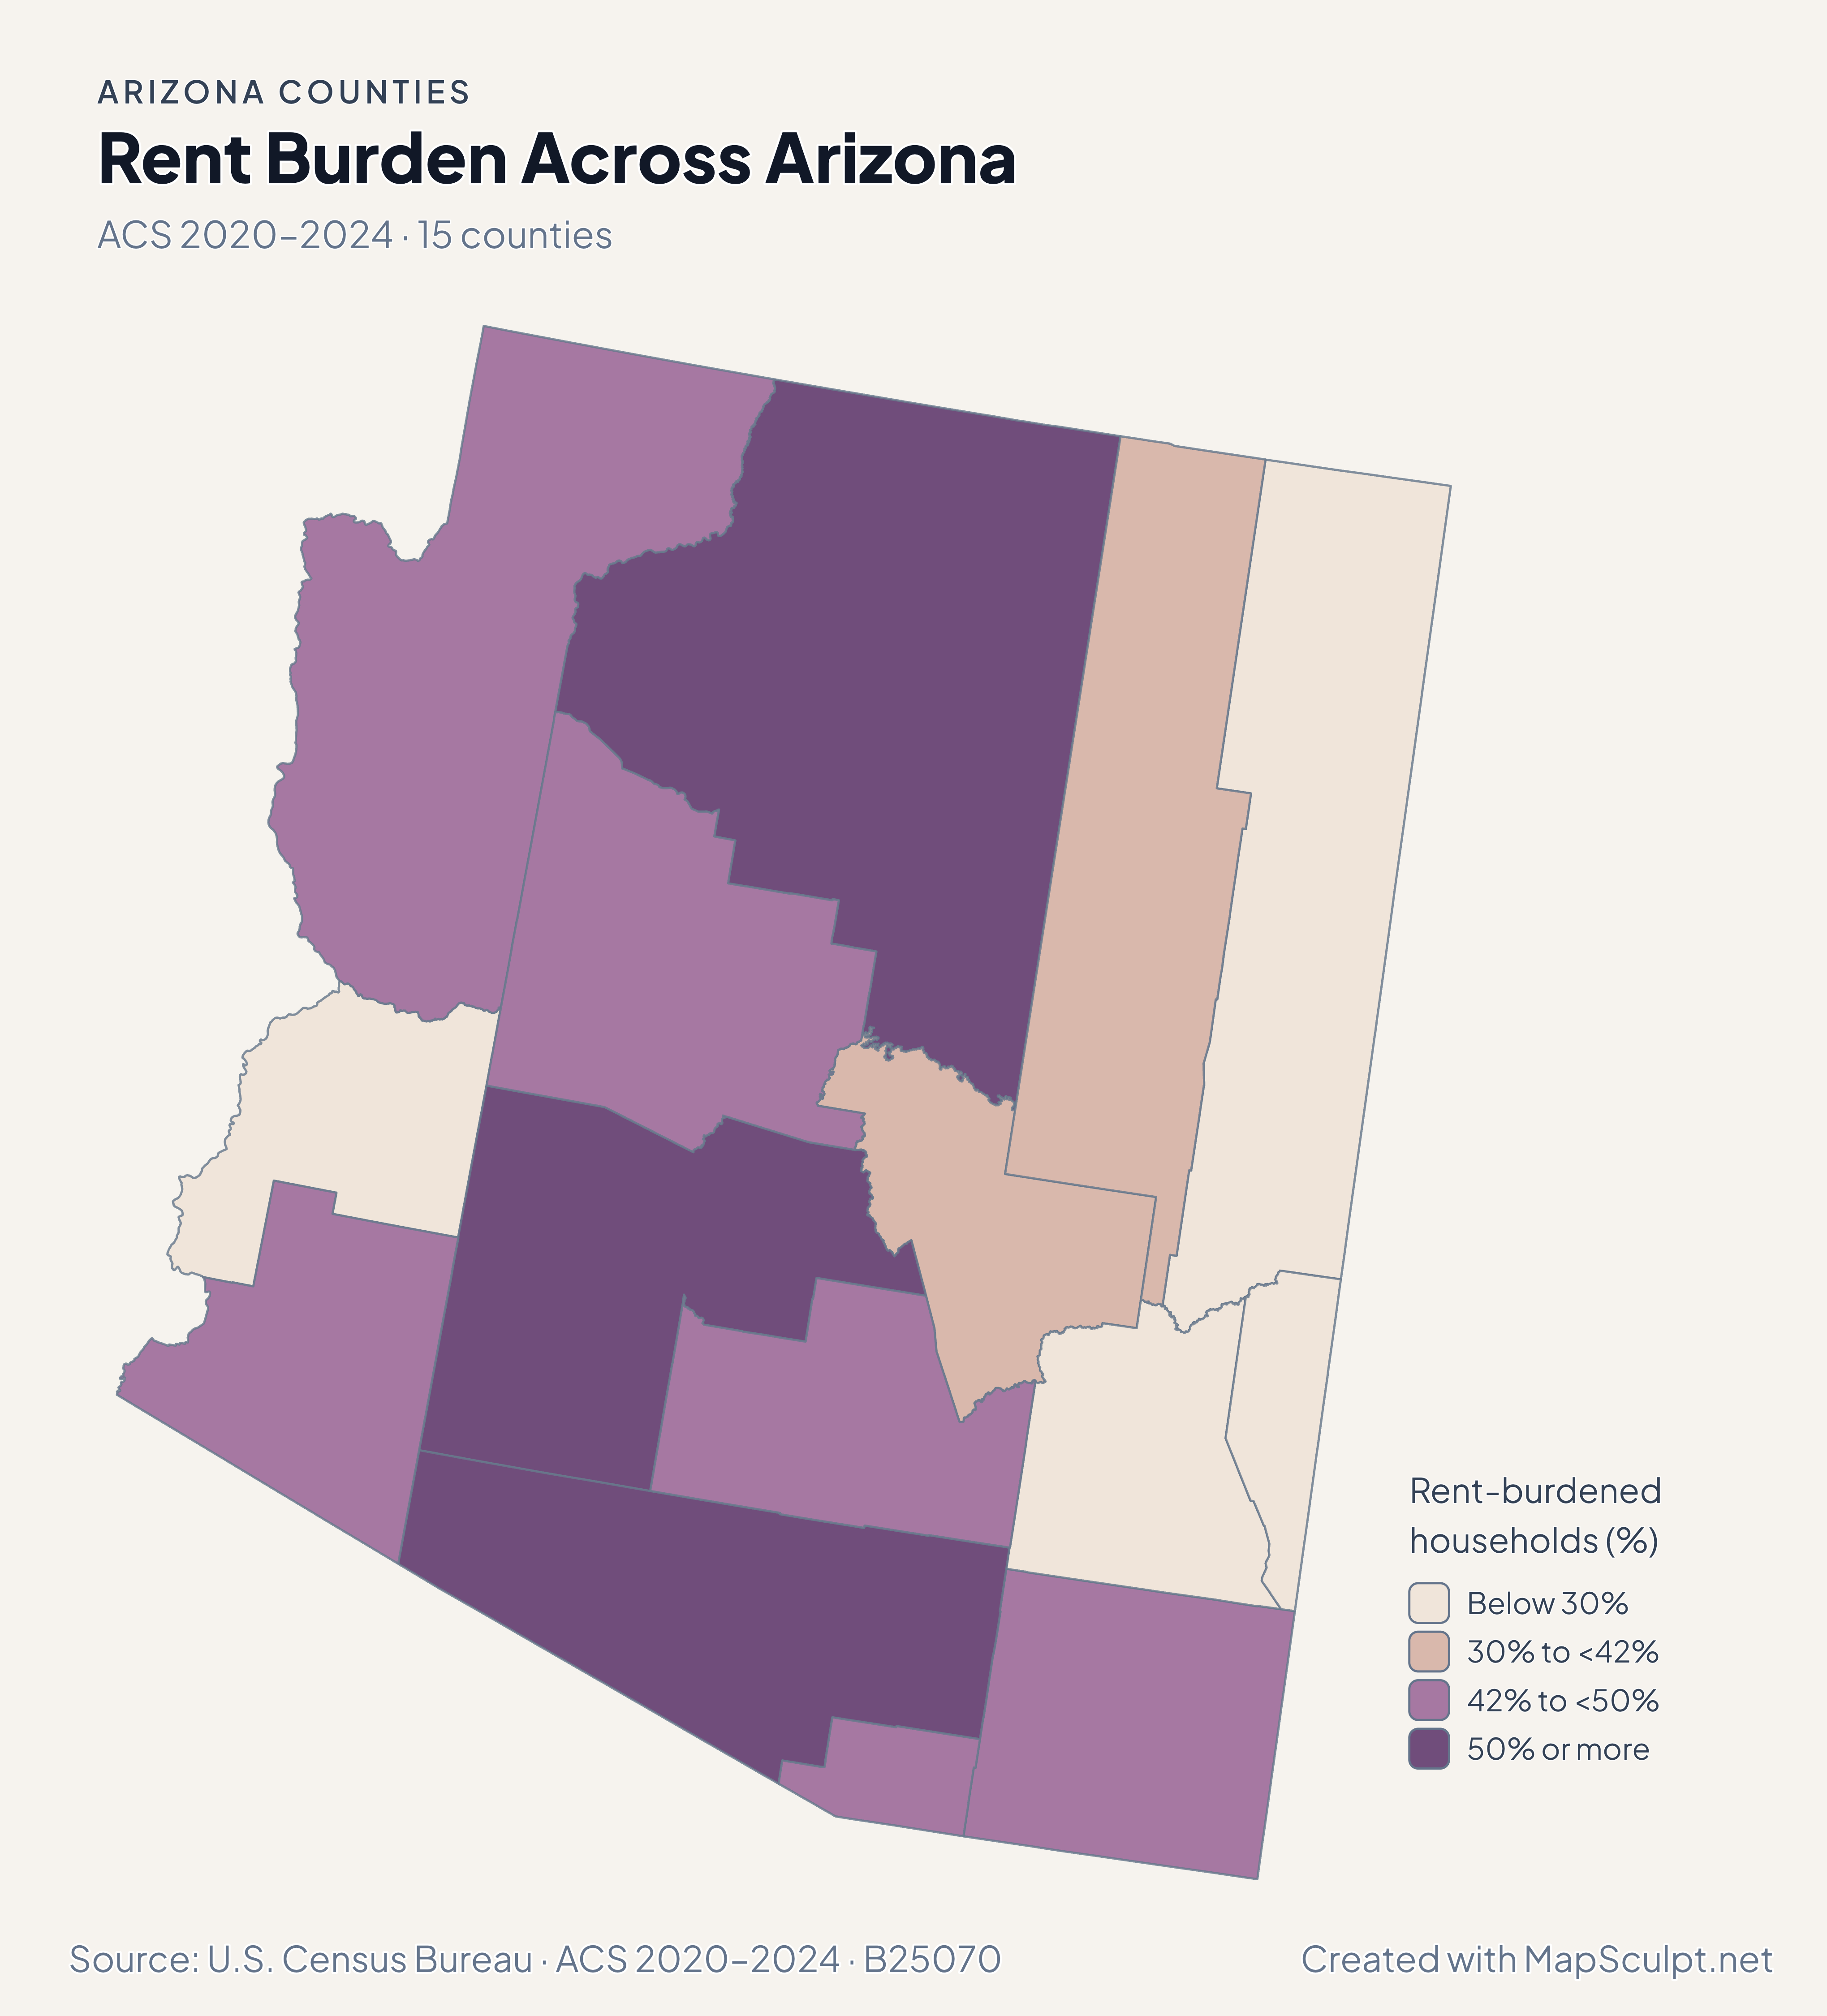
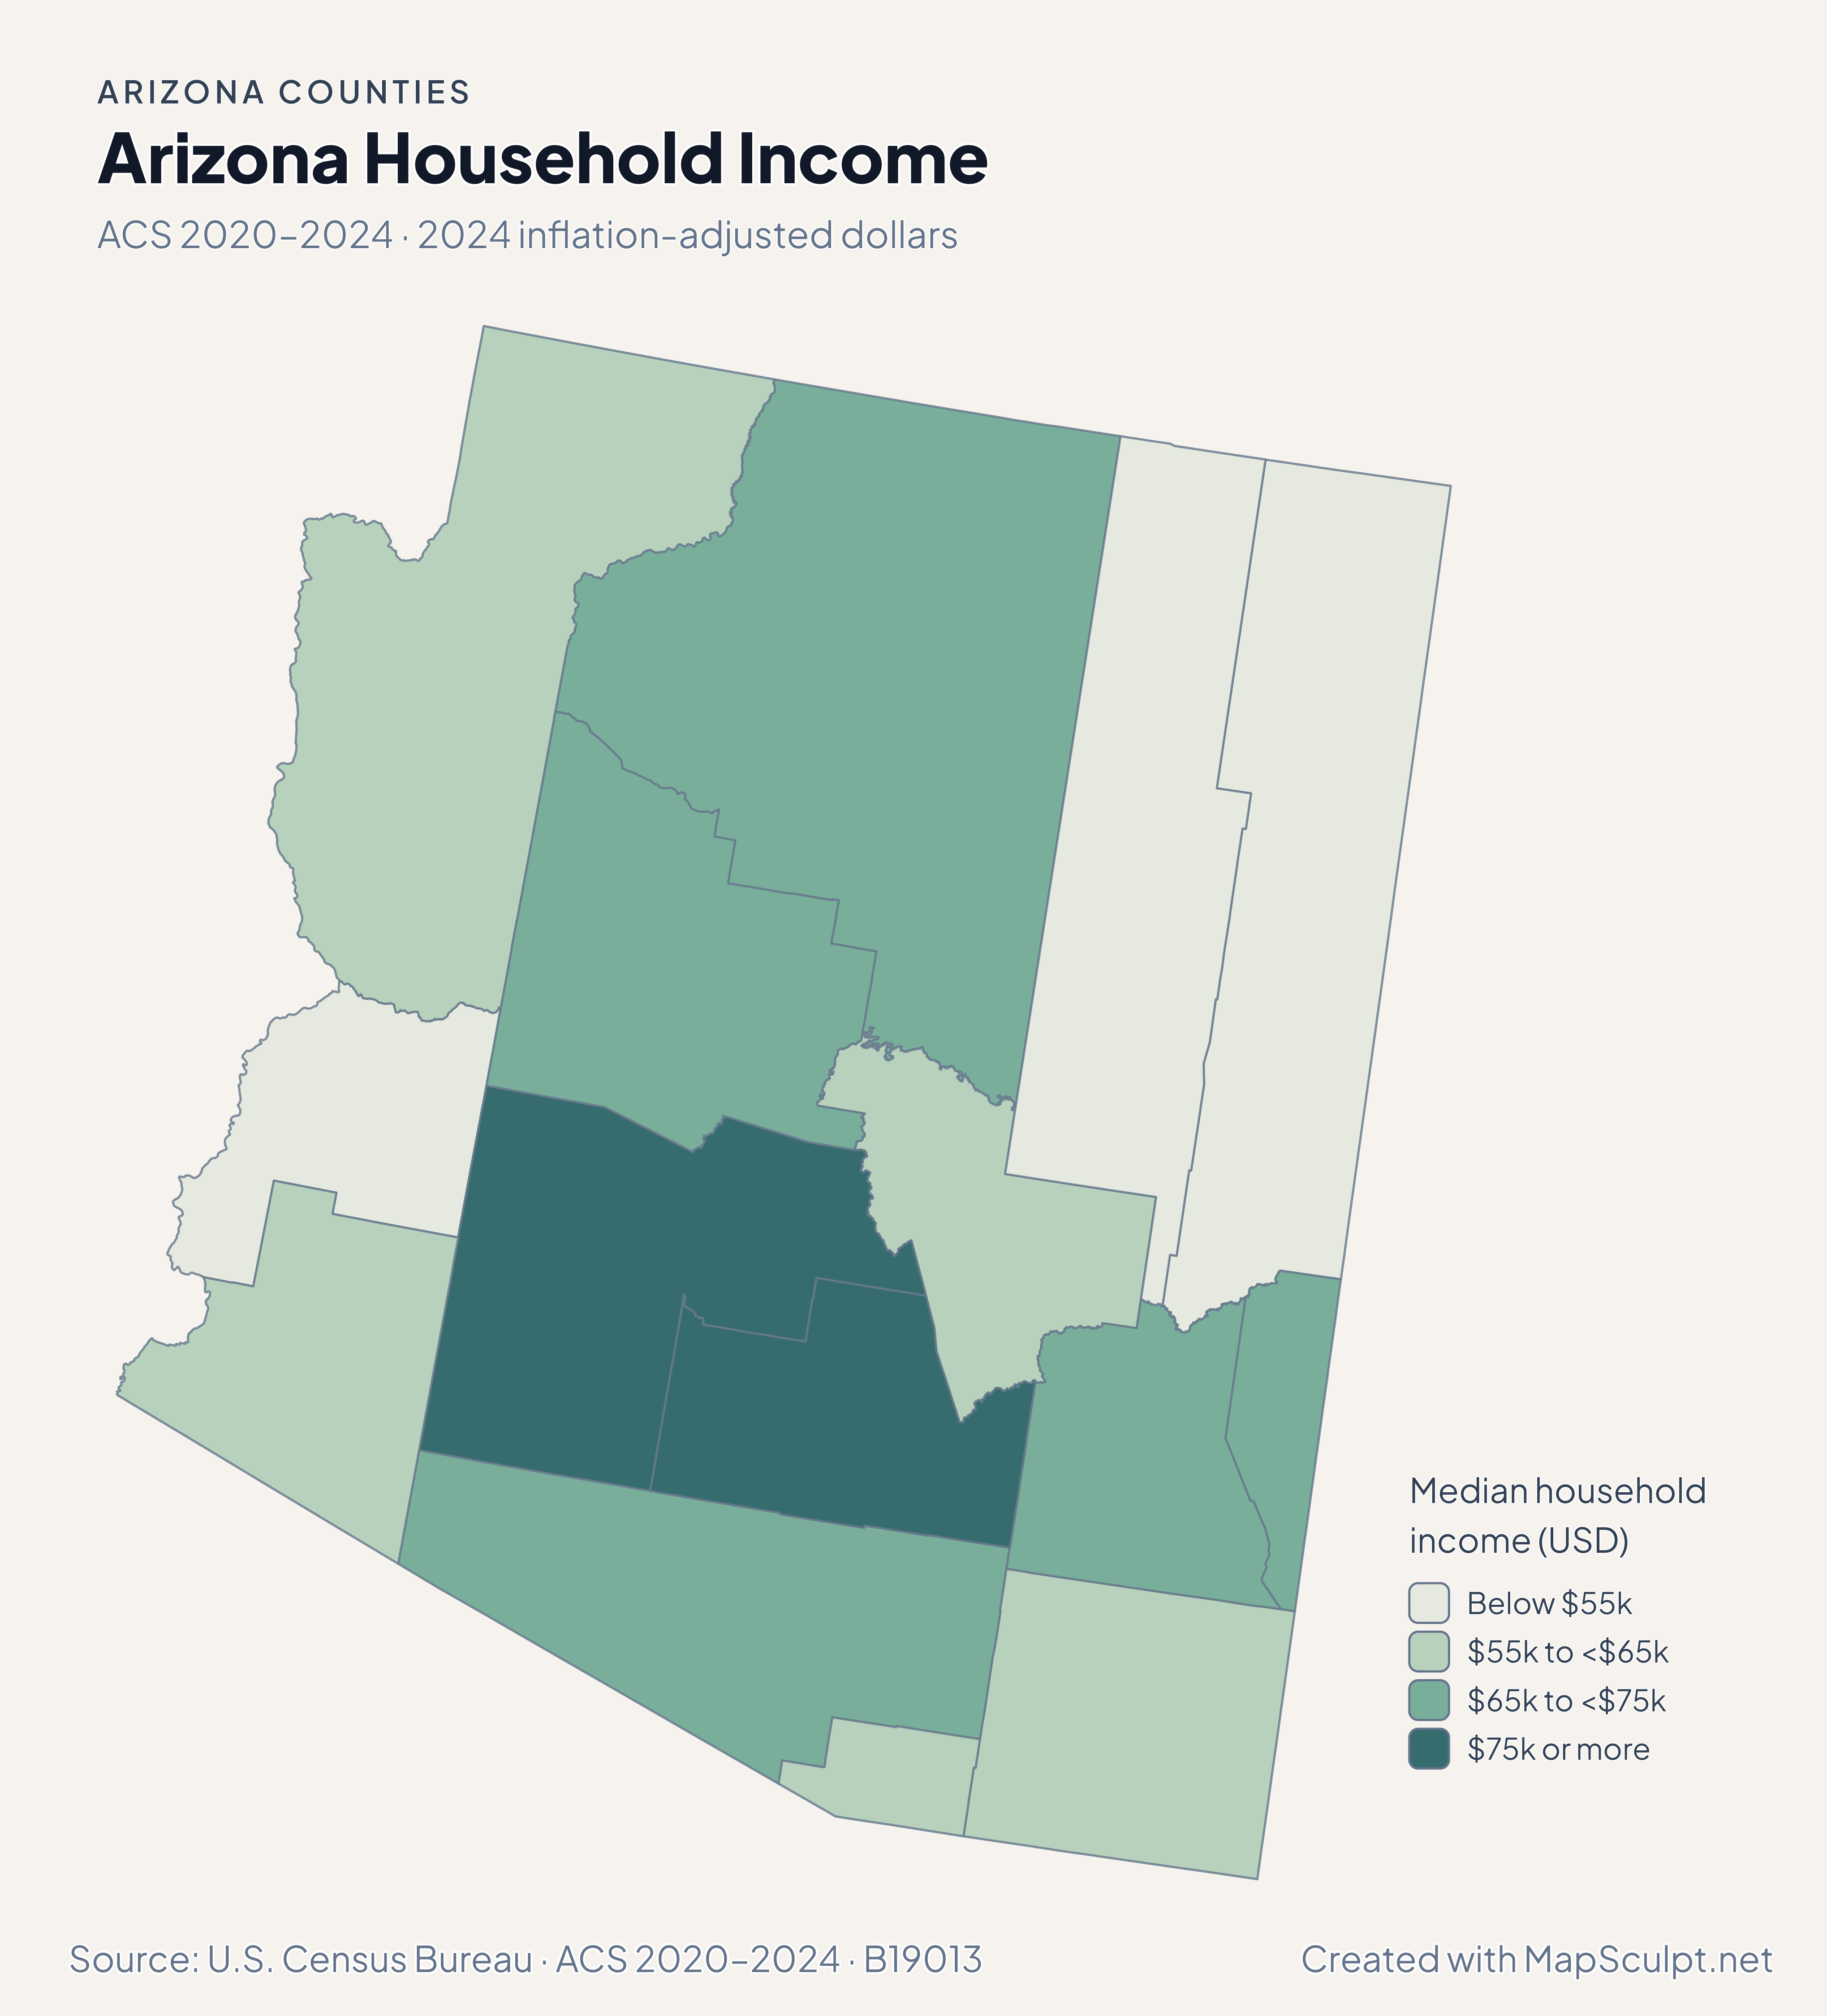
Compare July 2024–July 2025 population estimates with five-year ACS survey estimates for 2020–2024. Each map identifies its own period and units.

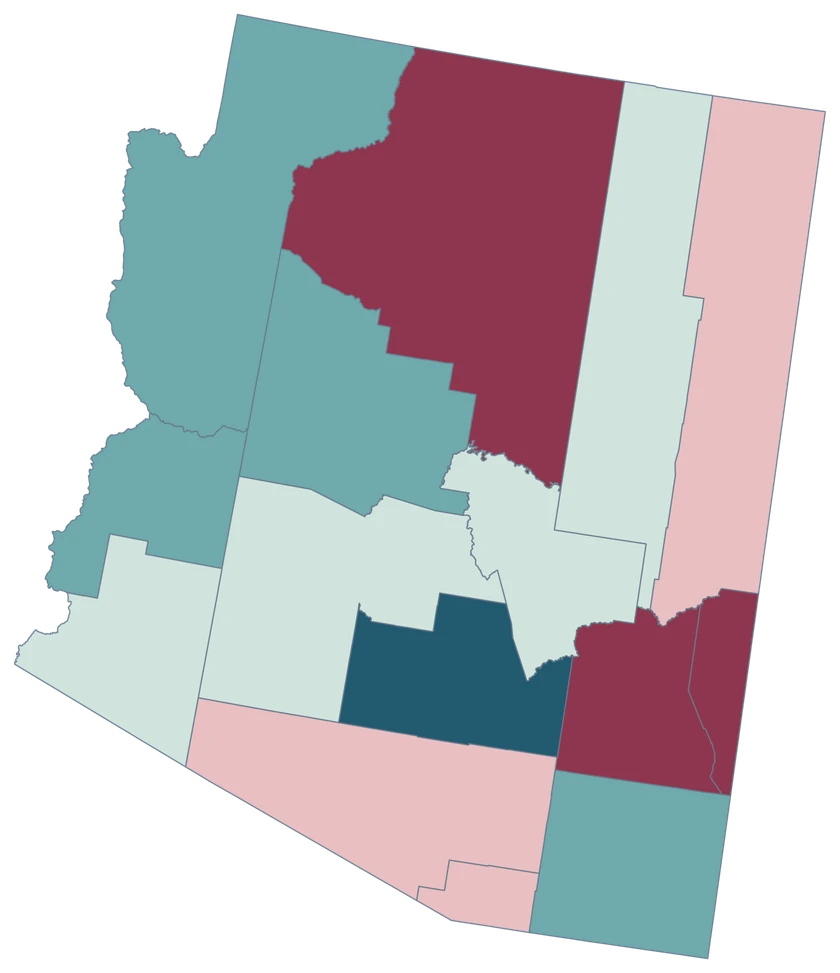
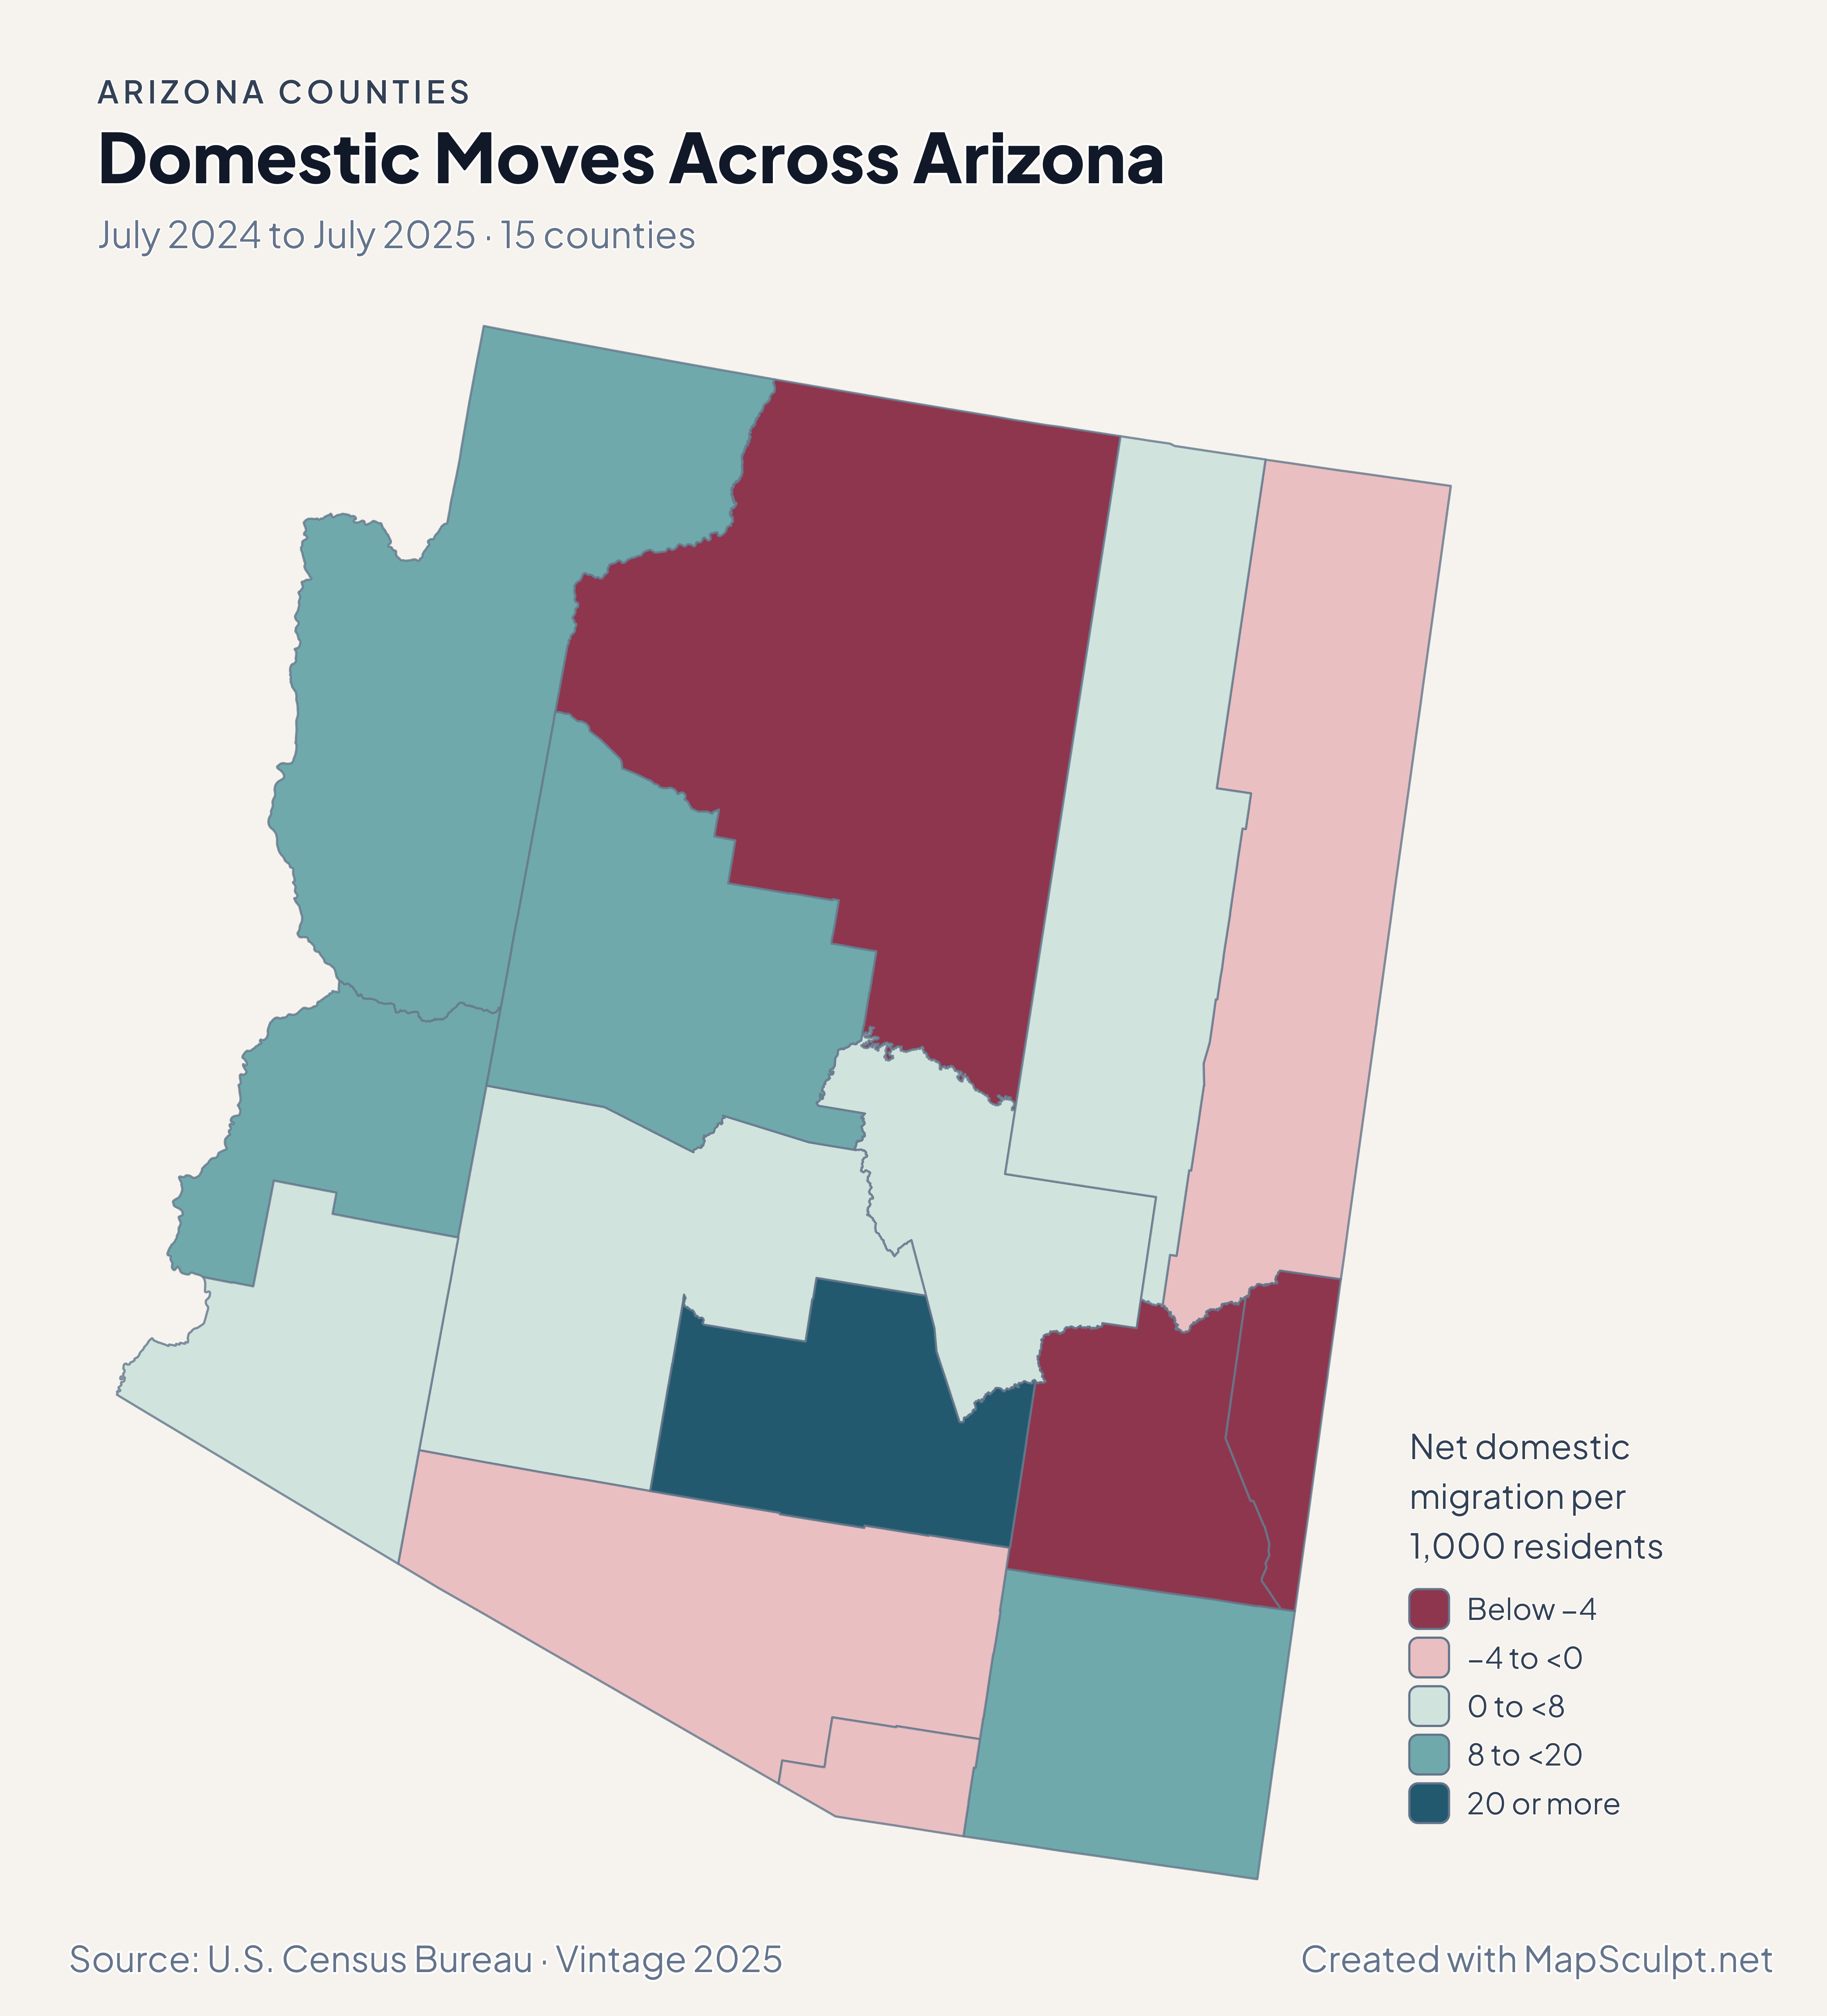
Arizona domestic migration rates, highlighting high gains in Pinal and Mohave and near-zero rates in Maricopa and Pima.

July 2024 to July 2025 · 15 counties

Domestic moves distinguish Pinal from its neighbors.

Pinal gained 40.40 net domestic movers per 1,000, compared with 0.20 in Maricopa and −0.33 in Pima. Mohave also showed a substantial gain at 18.38 per 1,000.

Net domestic migration per 1,000 residents

  • Below −4
  • −4 to <0
  • 0 to <8
  • 8 to <20
  • 20 or more

U.S. Census Bureau · Vintage 2025

Download complete PNG

Pinal grew 4.59%, compared with 0.76% in Maricopa and 0.11% in Pima. Ten counties grew and five declined. A county’s percentage change uses its own July 2024 population as the denominator. See the Census estimates ↗

MAKE IT YOURS

From county data to a finished map.

  1. Open the Arizona editor

    Start with all 15 selectable counties.

  2. Match your county records

    Use a five-digit GEOID such as 04013 for Maricopa County. Review the match list before applying the data.

  3. Choose classes and colors

    Use bands that make the units and direction of change easy to read.

  4. Export with context

    Keep the source, period and legend visible in your full-resolution PNG.

TRY CSV IMPORT

Try six Arizona records.

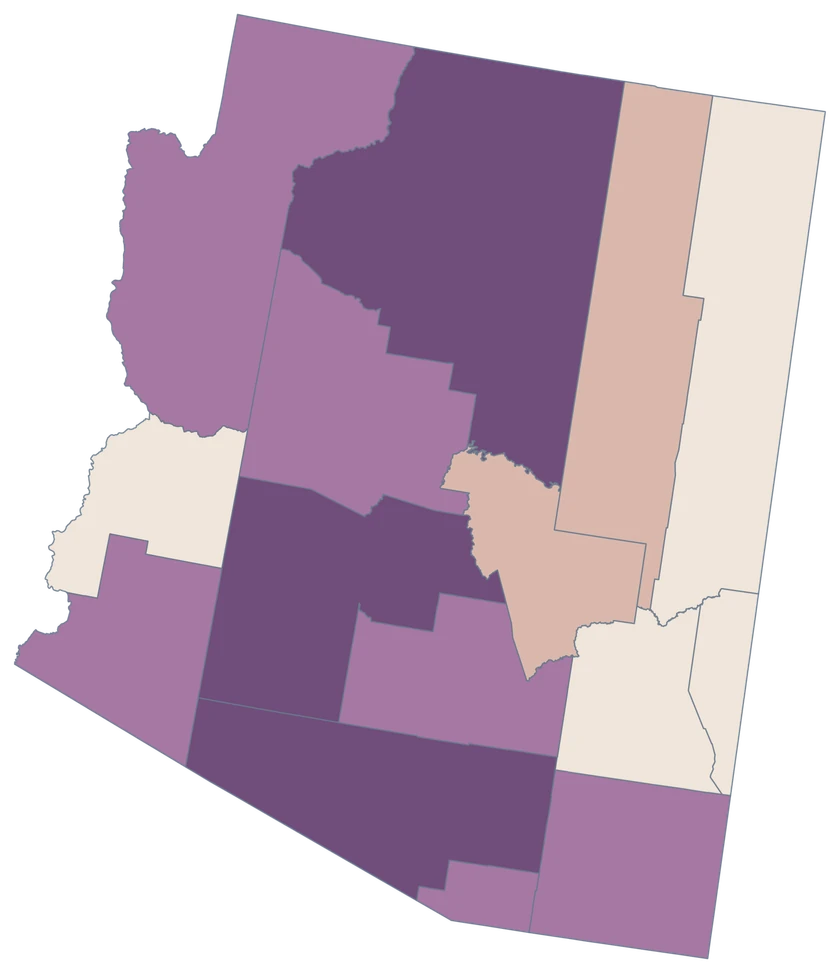
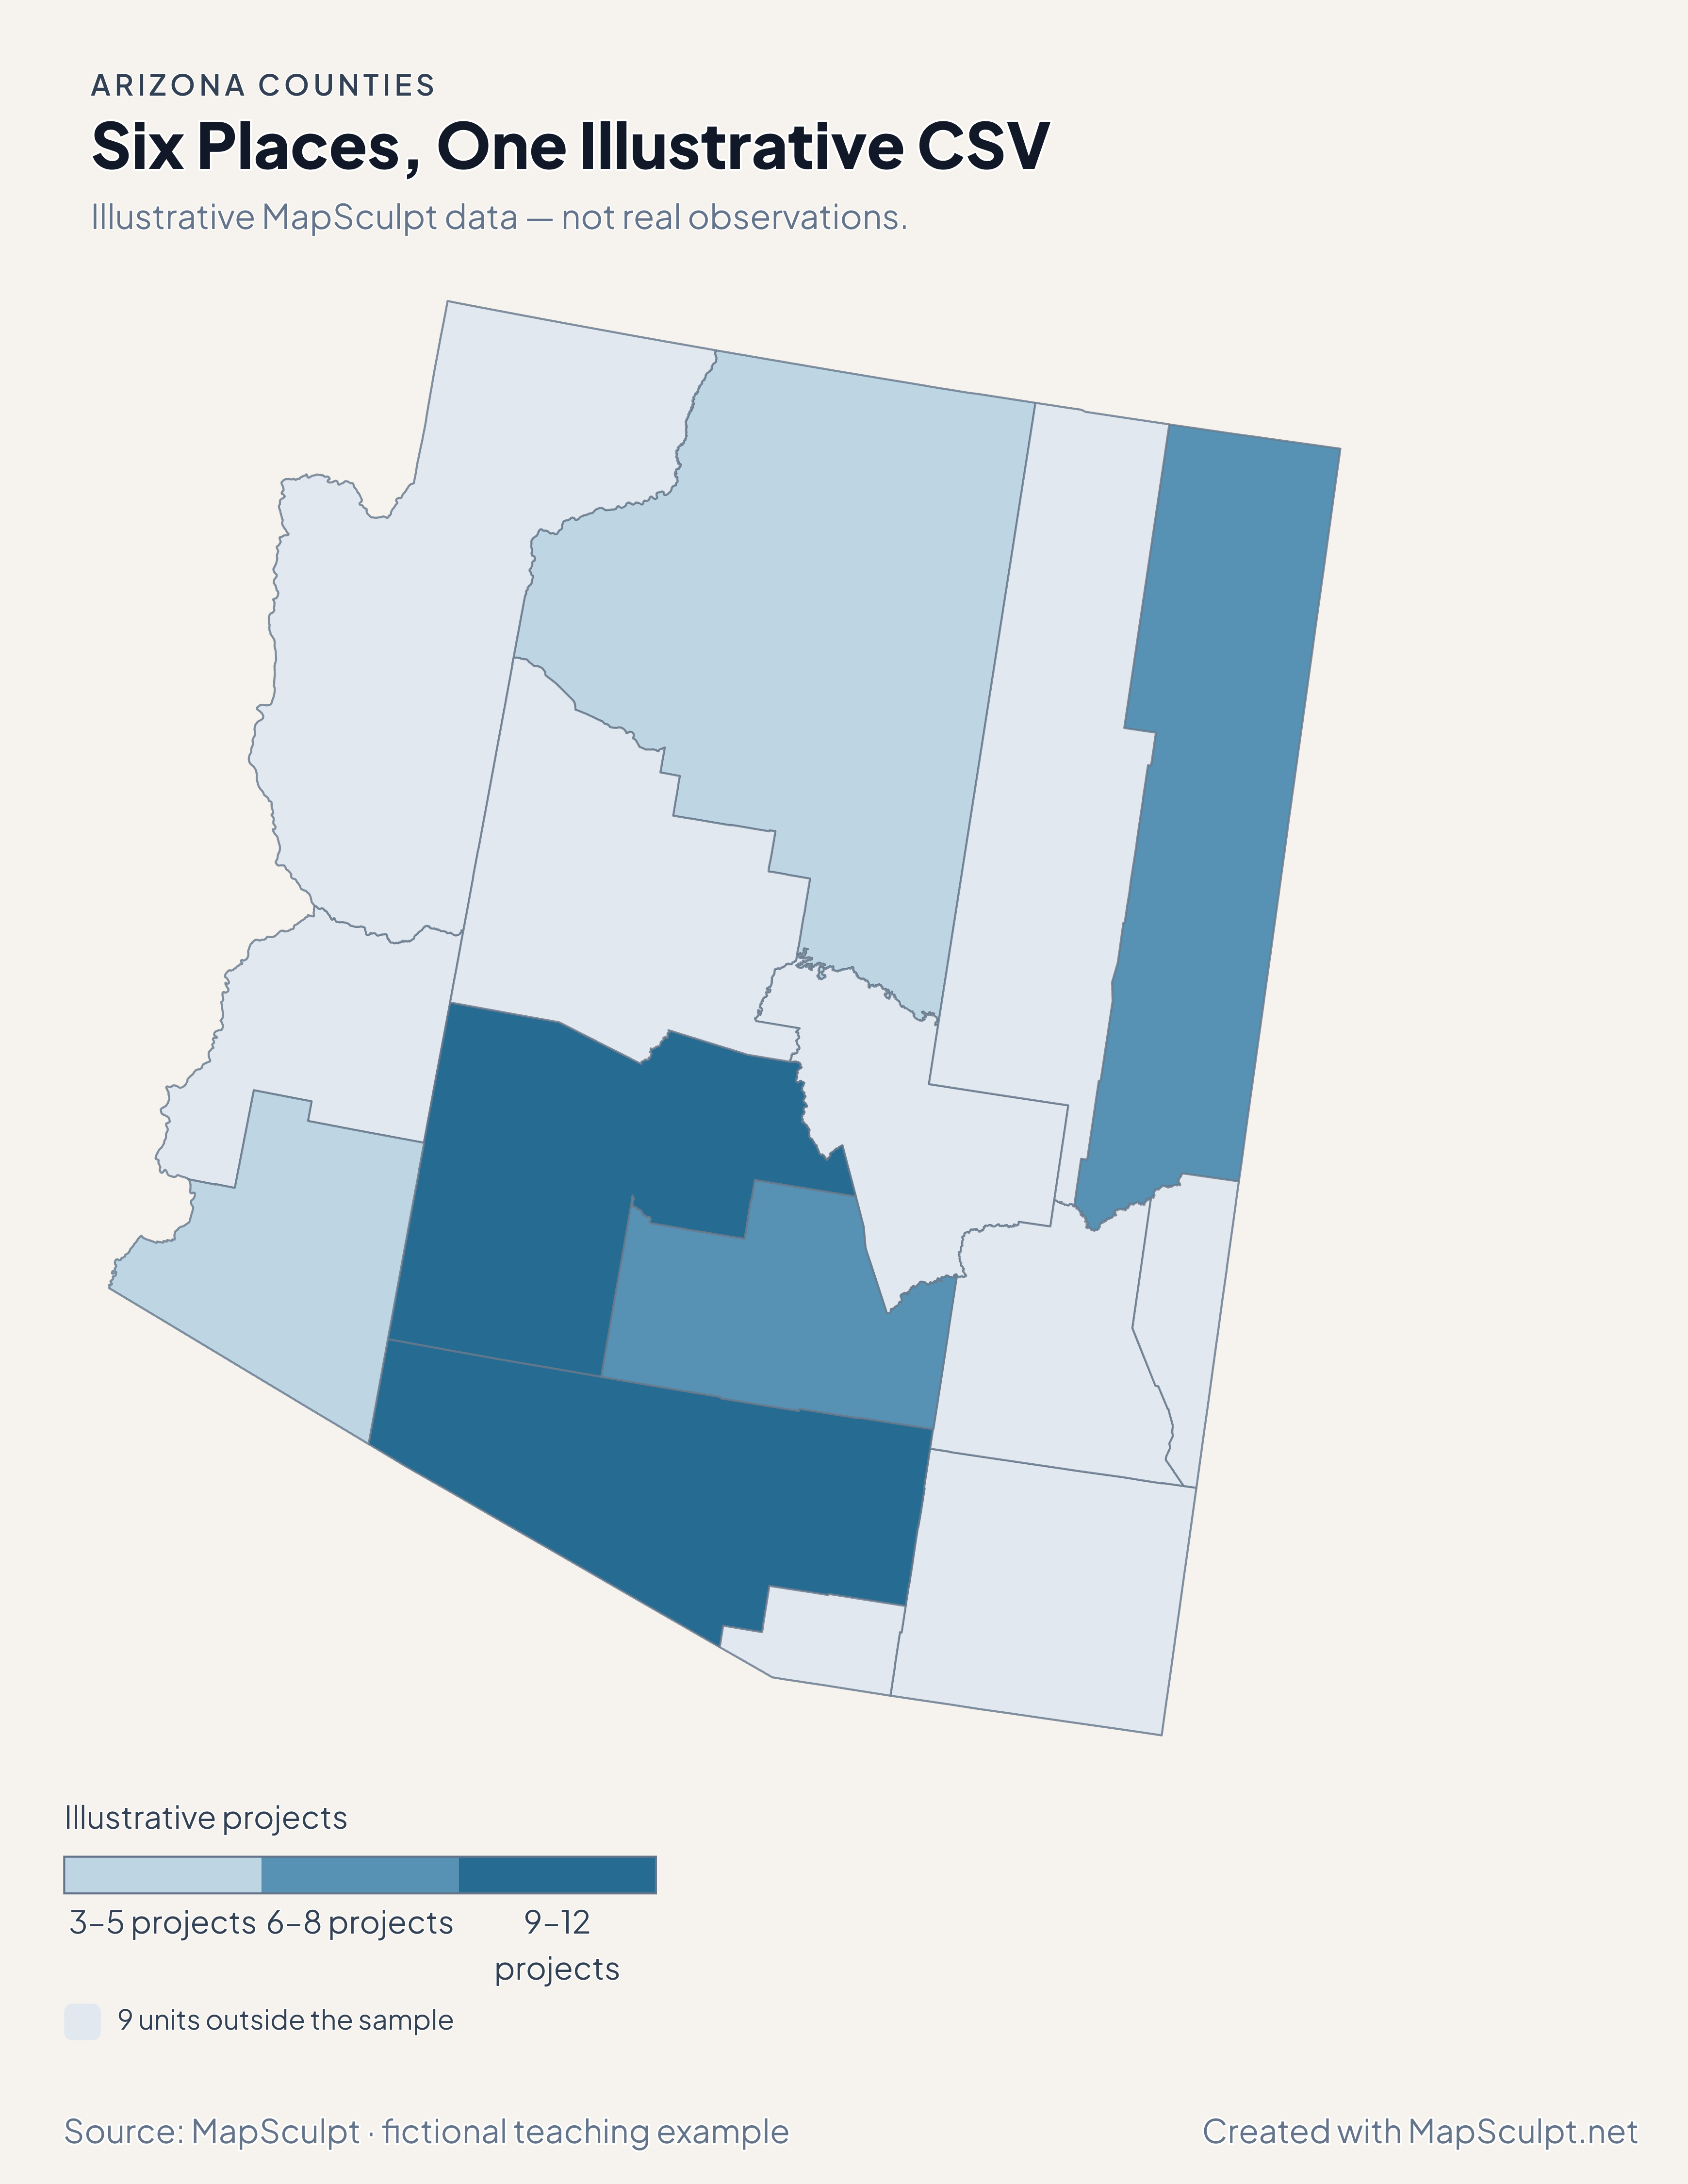
Import the fictional file, select IllustrativeProjects and use custom boundaries of 3, 6, 9 and 12. The remaining 9 units stay neutral.

Illustrative MapSculpt data — not real observations.
CountyGEOIDProjects
Maricopa County0401312
Pima County040199
Pinal County040217
Coconino County040053
Apache County040018
Yuma County040275

Keep IDs as text. The sample uses 04013 for Maricopa County and 04019 for Pima County.

Download illustrative CSV ↓

Six Places, One Illustrative CSV

Illustrative MapSculpt data — not real observations.

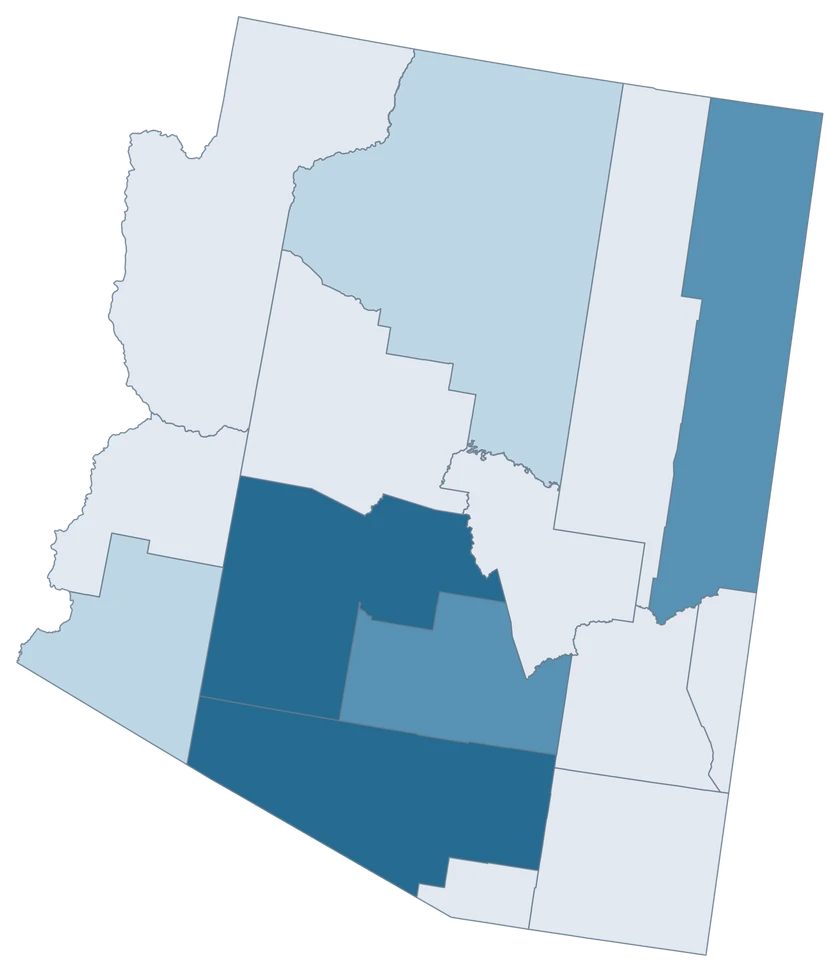
Arizona fictional project map with six sampled county-level units and 9 neutral units.

Illustrative projects

  • 3–5 projects
  • 6–8 projects
  • 9–12 projects
  • 9 units outside the sample
Download complete PNG

CSV → Match 6 counties → Style → Export PNG Create a Arizona map

COUNTY REFERENCE

All 15 Arizona counties and GEOIDs.

Official county names and five-digit Census GEOIDs. Search by name or code.

  1. Apache CountyGEOID 04001
  2. Cochise CountyGEOID 04003
  3. Coconino CountyGEOID 04005
  4. Gila CountyGEOID 04007
  5. Graham CountyGEOID 04009
  6. Greenlee CountyGEOID 04011
  7. La Paz CountyGEOID 04012
  8. Maricopa CountyGEOID 04013
  9. Mohave CountyGEOID 04015
  10. Navajo CountyGEOID 04017
  11. Pima CountyGEOID 04019
  12. Pinal CountyGEOID 04021
  13. Santa Cruz CountyGEOID 04023
  14. Yavapai CountyGEOID 04025
  15. Yuma CountyGEOID 04027

U.S. Census Bureau · 2025 Cartographic Boundary Files

COMMON QUESTIONS

Arizona county map questions.

Why does an Arizona GEOID begin with zero?

Arizona’s state FIPS is 04. Keep the leading zero in five-digit county GEOIDs such as 04013 for Maricopa County.

Can I color Phoenix or Tucson independently?

The editor selects county boundaries. Use Maricopa and Pima for observations that cover those counties, and use city geography for city-only data.

Which identifier should I use for Pinal?

Use 04021 for Pinal County. It is separate from Maricopa at 04013 and Pima at 04019.

Why is Pinal in its own population-growth band?

Its 4.59% change was the highest in this period. The class breaks reserve the top band for counties at 1.5% growth or above.

Does a county fill show Tribal land boundaries?

The map shows county geography. Tribal lands can cross county lines, so compare Tribal-area statistics using an appropriate boundary layer.

How can I show the Colorado River border across states?

Use the national county editor for a single map that includes Arizona counties and their neighbors across the river.

YOUR NEXT MAP STARTS HERE

Put your Arizona data on the map.

Choose a comparison for Arizona, join your observations by Census GEOID and export a map with the period and source included.

Create a Arizona map