Skip to content
MapSculpt

GEOGRAPHIC MAP MAKER / WEST VIRGINIA

West Virginia
Counties Map Maker

Follow county population change from the Eastern Panhandle to the Ohio River. Compare relative growth, domestic moves and housing estimates across all 55 counties.

Free online editor · No sign-up required

55counties
individually editable

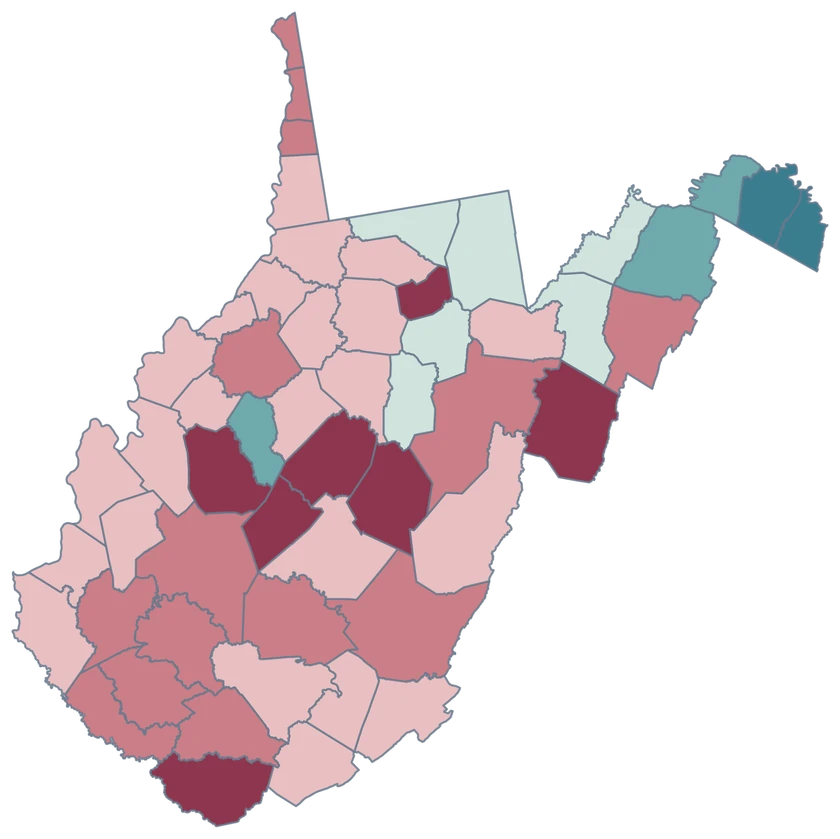
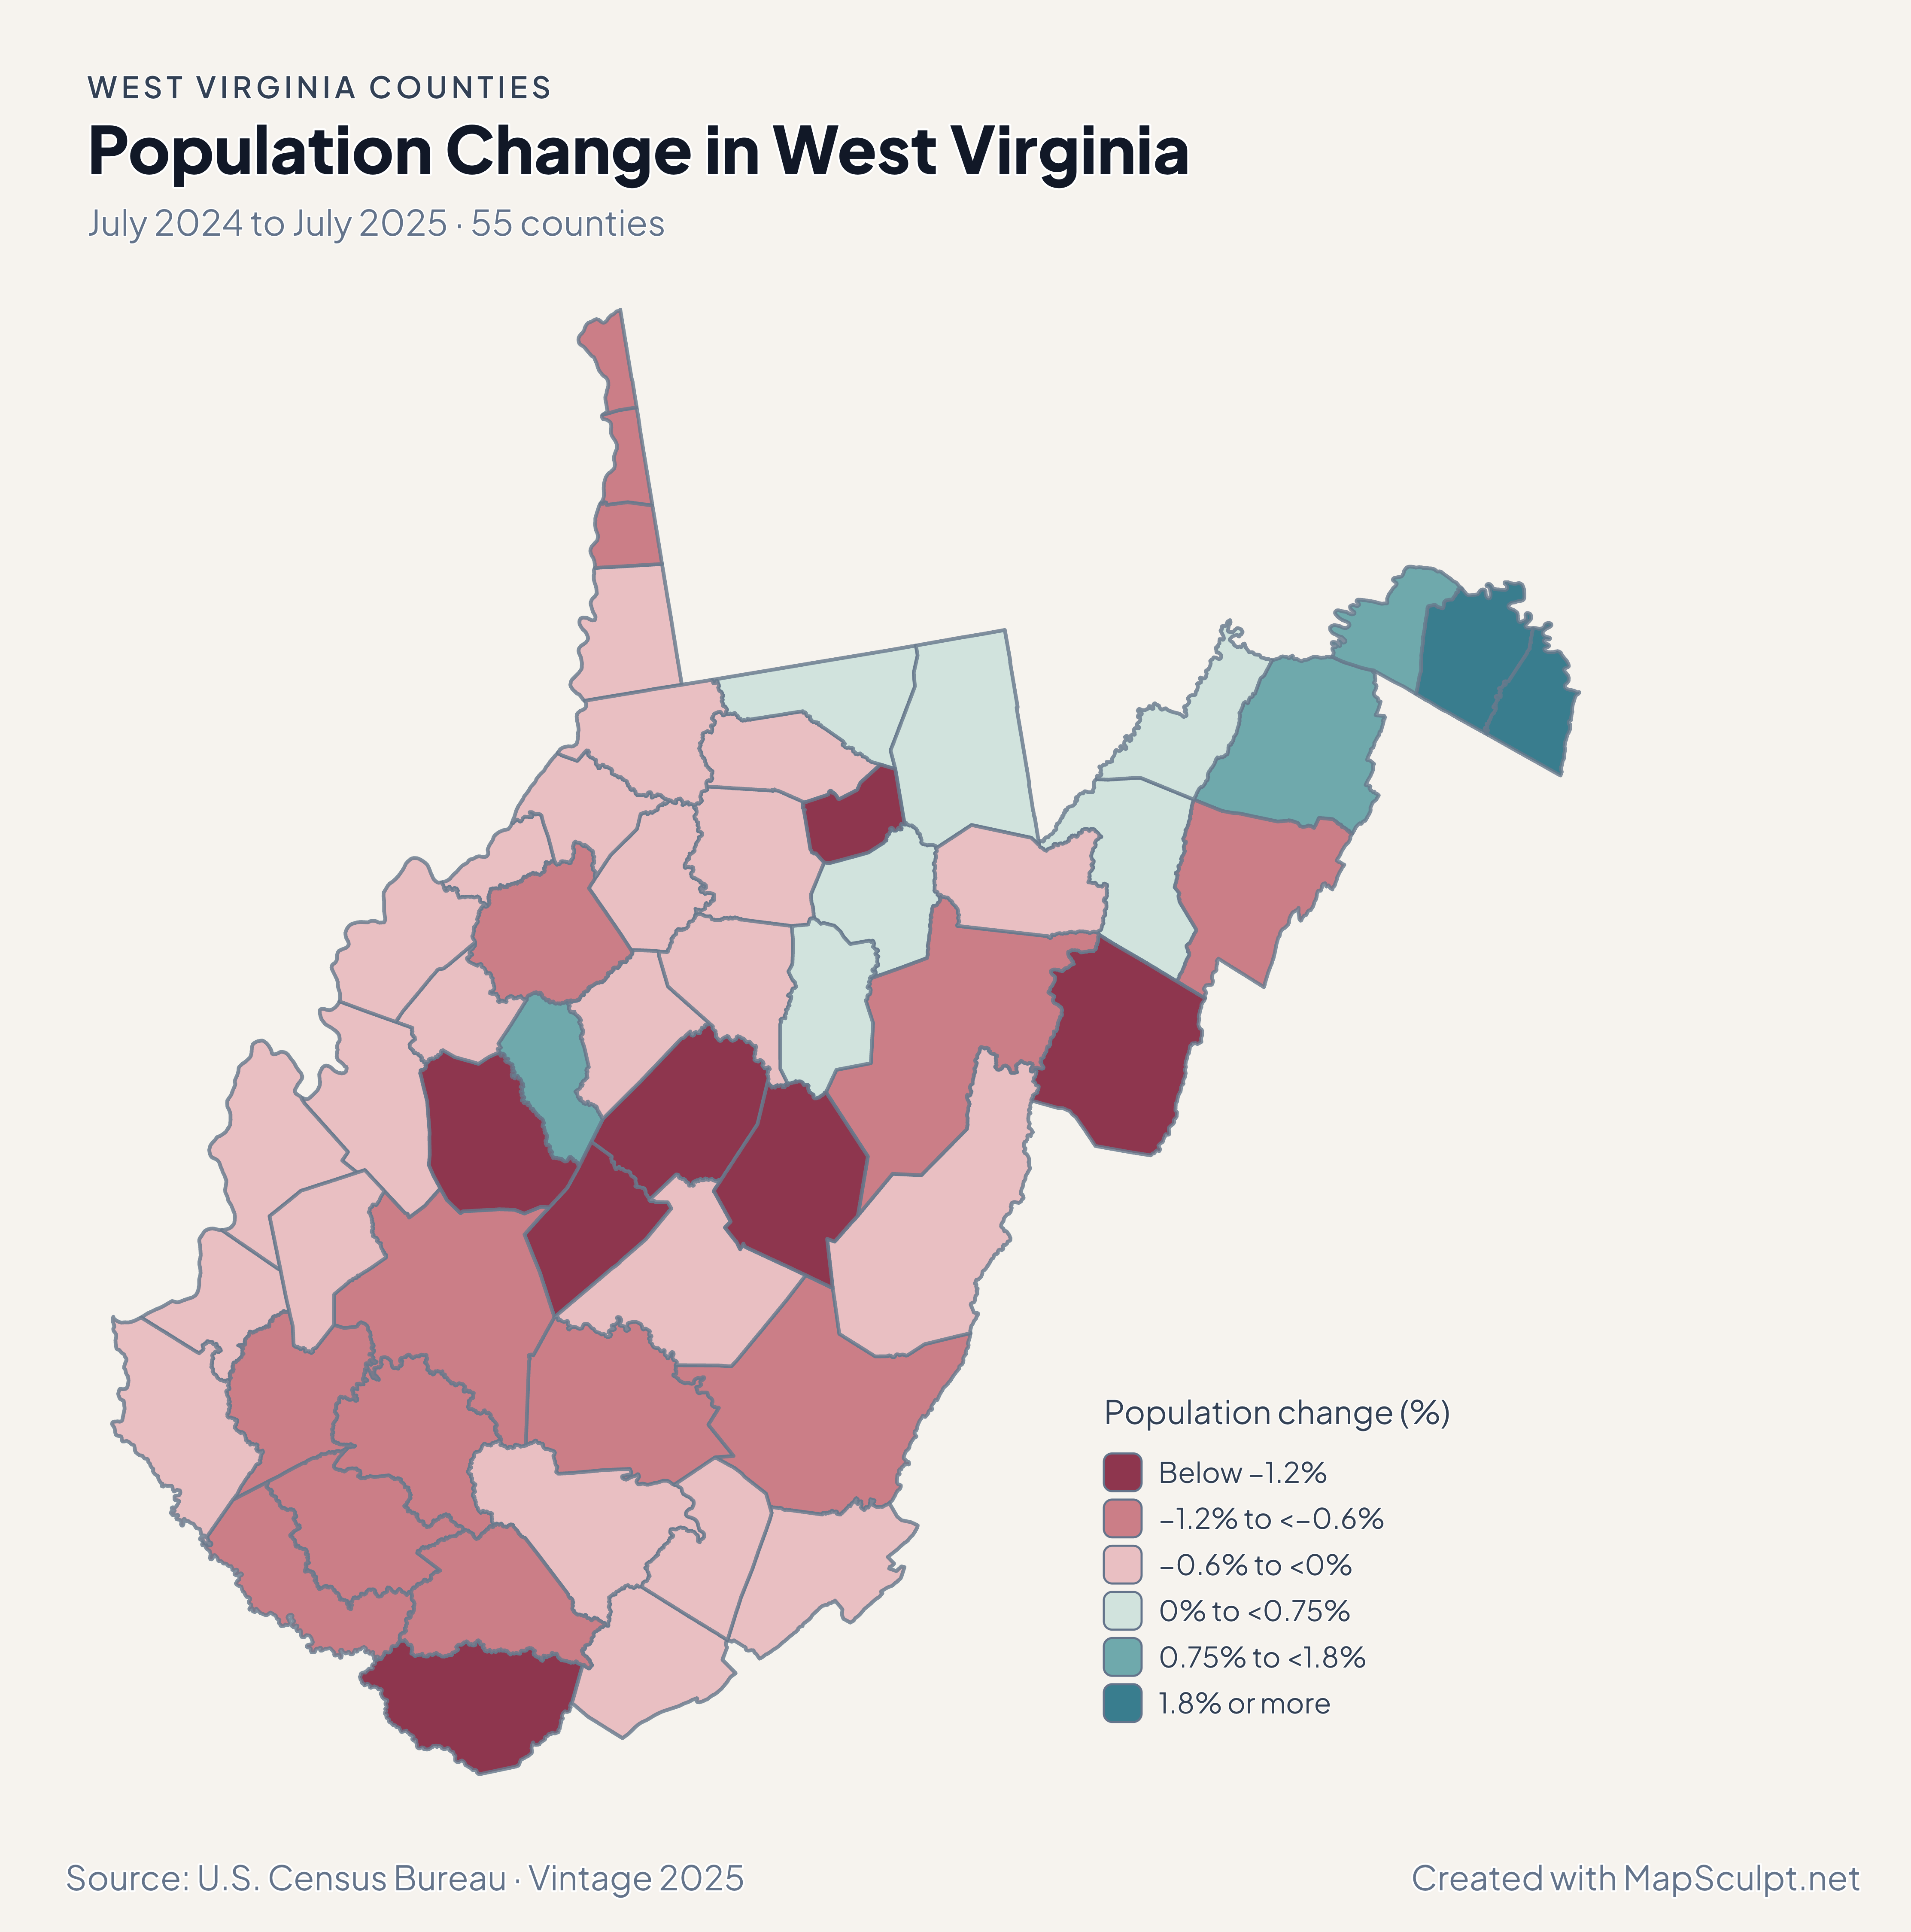
Population Change in West Virginia

July 2024 to July 2025 · 55 counties

West Virginia county choropleth of population change, including Jefferson, Berkeley, Morgan, Kanawha.

Population change (%)

  • Below −1.2%
  • −1.2% to <−0.6%
  • −0.6% to <0%
  • 0% to <0.75%
  • 0.75% to <1.8%
  • 1.8% or more
U.S. Census Bureau · Vintage 2025Download complete PNG Percentage change uses July 2024 population as its starting point.

KNOW YOUR GEOGRAPHY

Both panhandles and the counties in between

The generalized Census outline retains the Northern Panhandle along the Ohio River and the narrow Eastern Panhandle. Each county is selectable by its own identifier.

Charleston, West Virginia, is in Kanawha County. The county editor lets you map whole counties, while city and neighborhood observations require their own geographic layer.

Browse all county GEOIDs ↗

2025 Census boundaries

OFFICIAL DATA

Population change across West Virginia

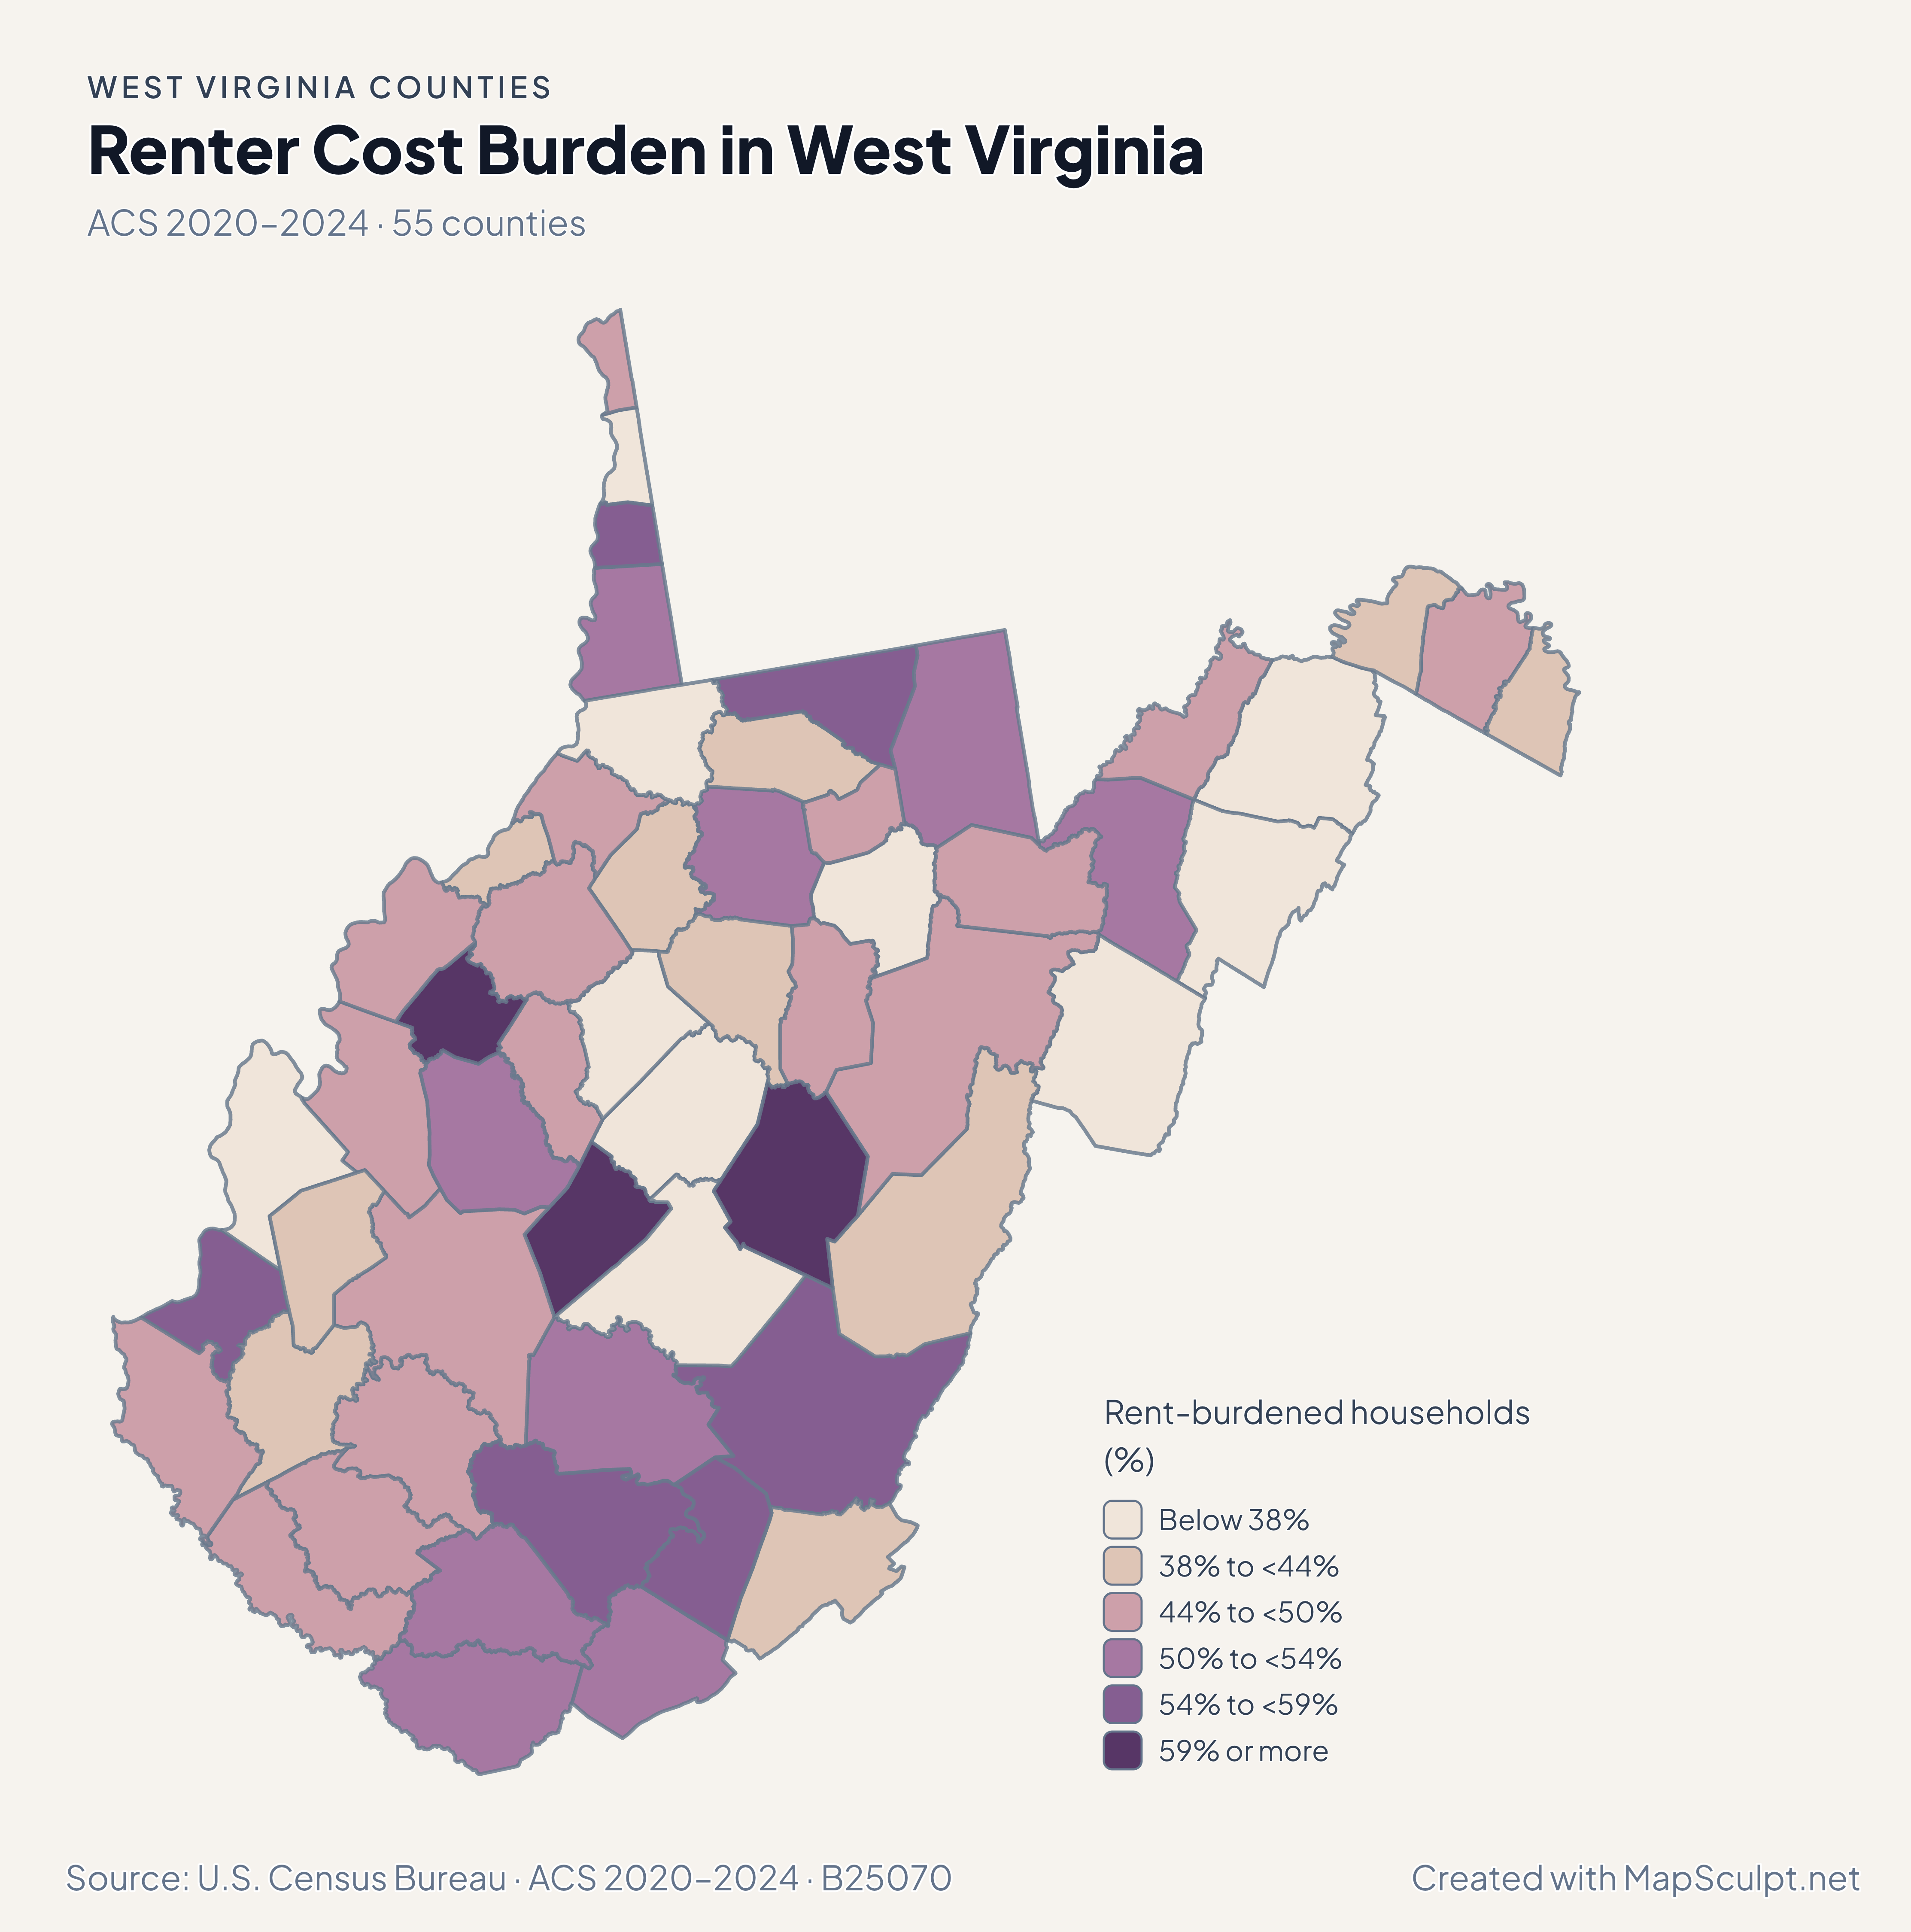
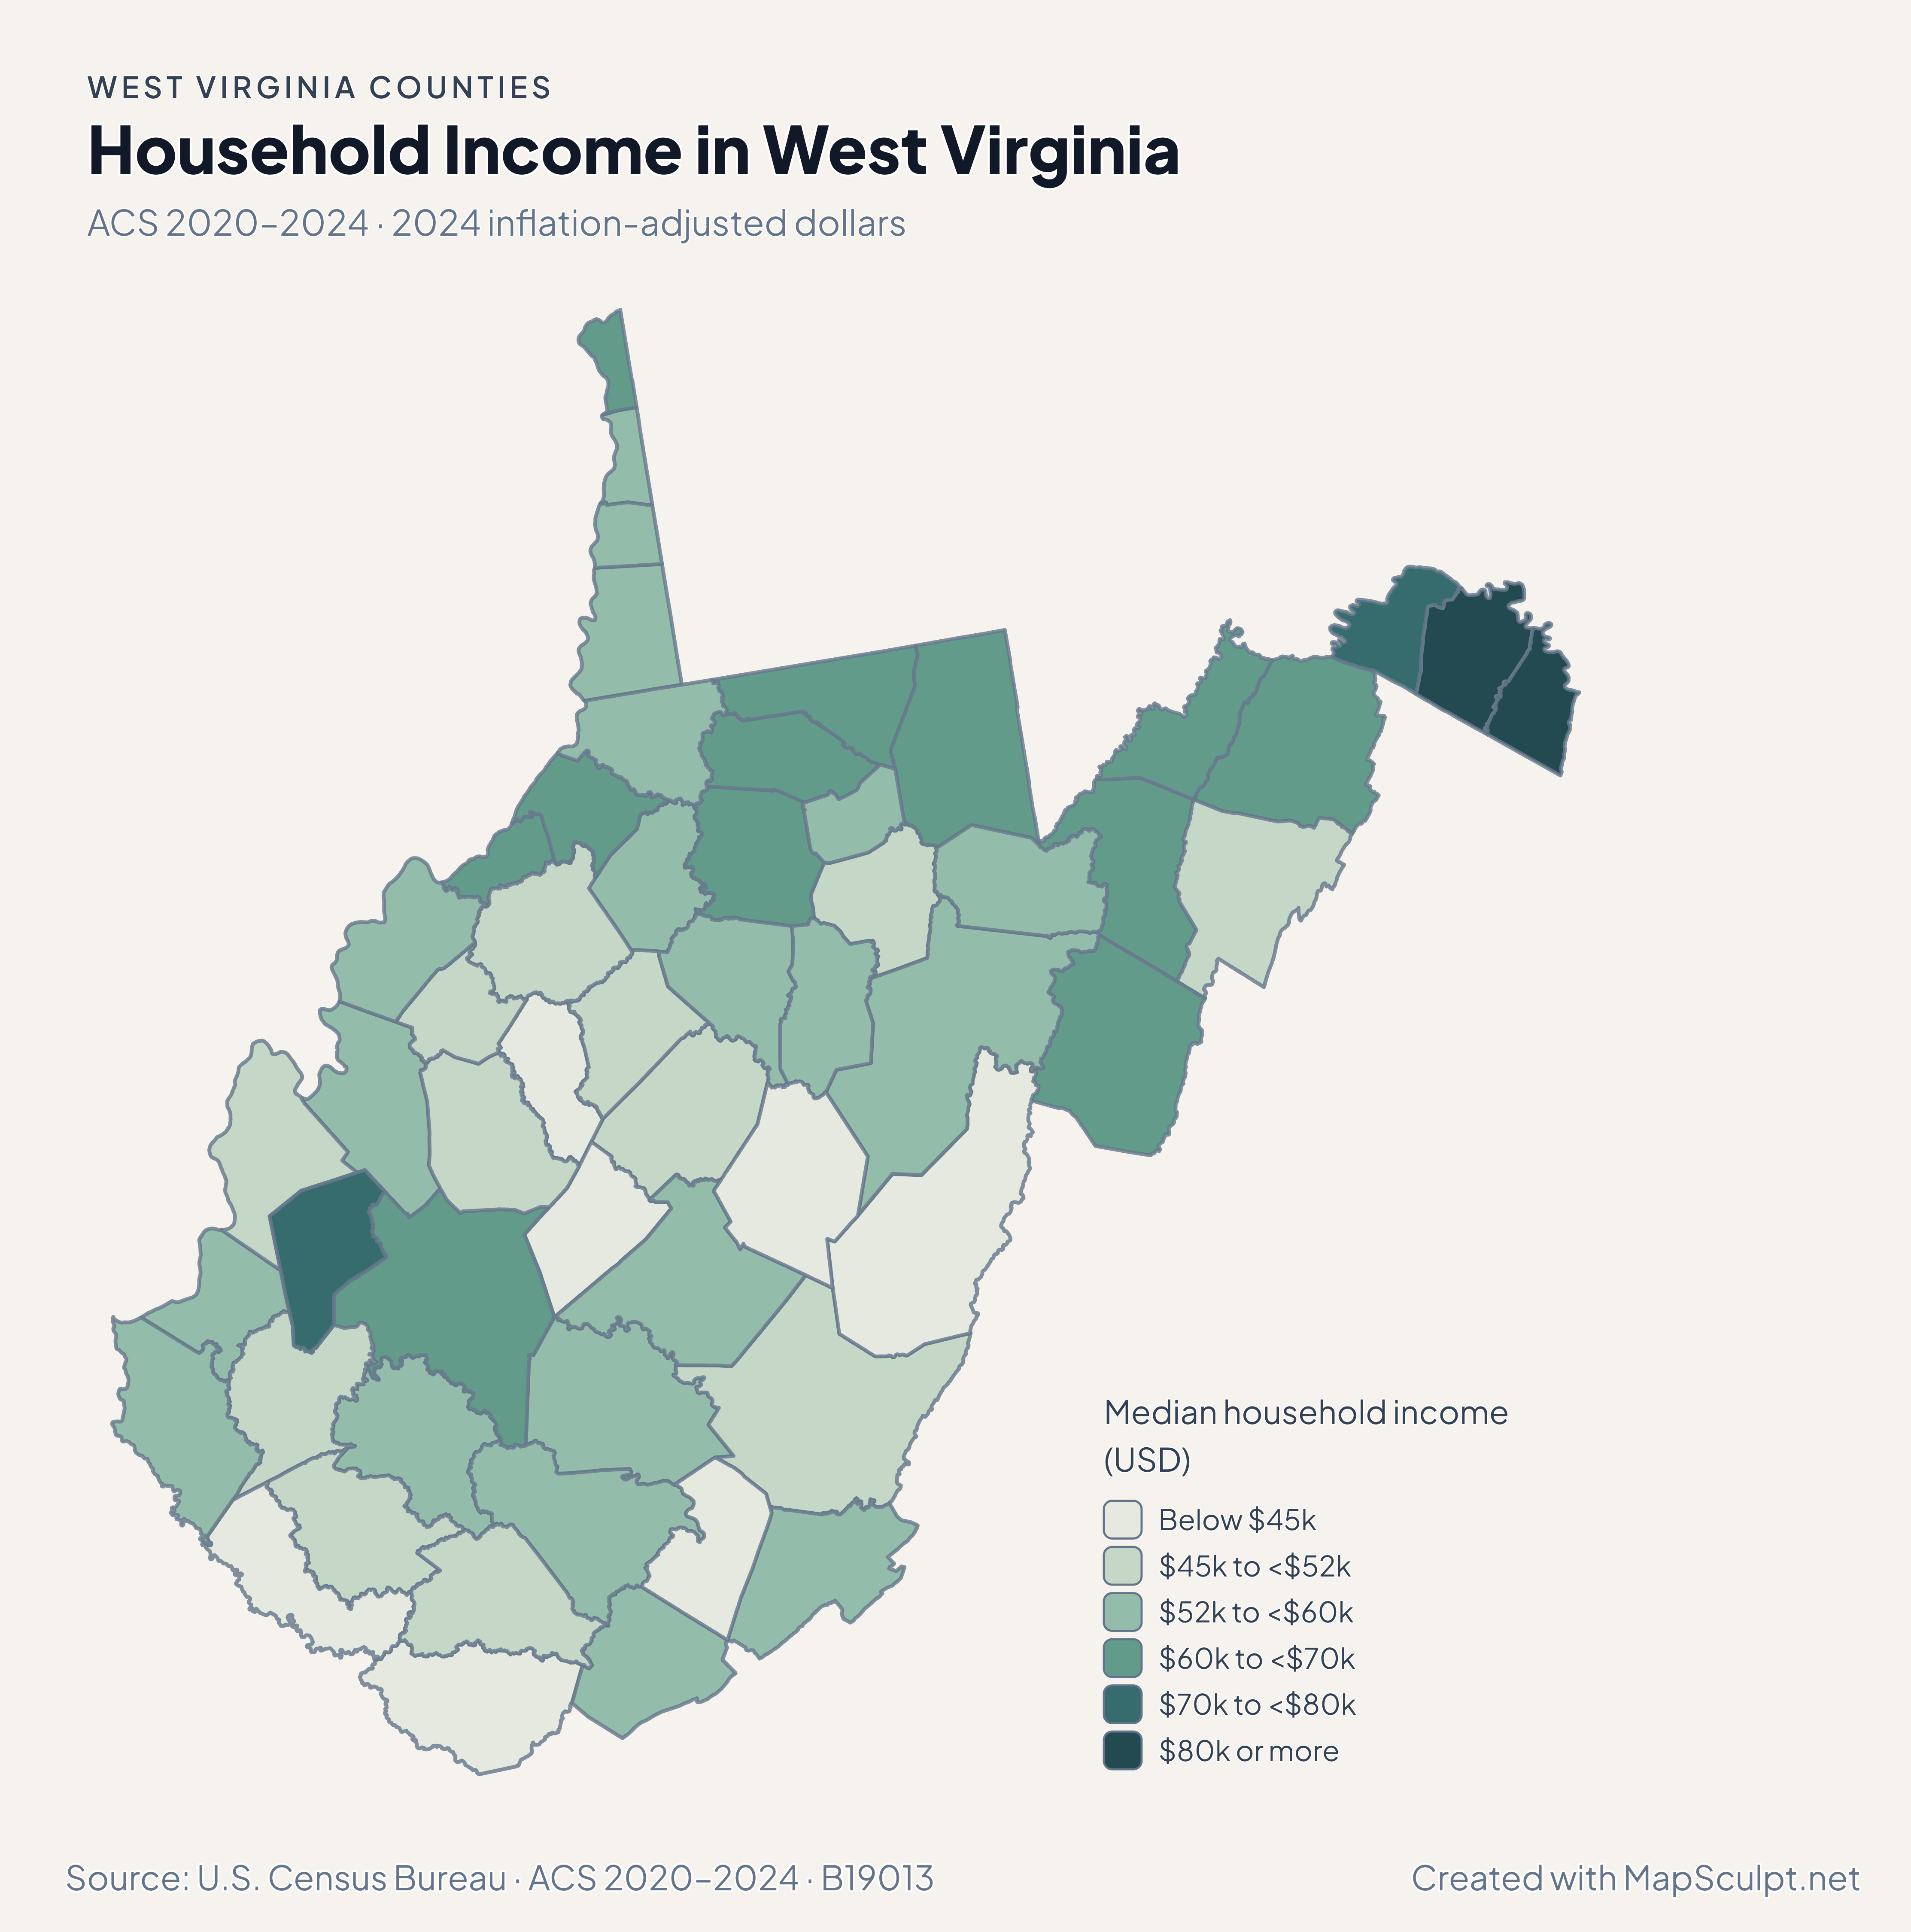
Population and net domestic moves compare July 2024 and July 2025. Household income and renter costs use the 2020–2024 American Community Survey.

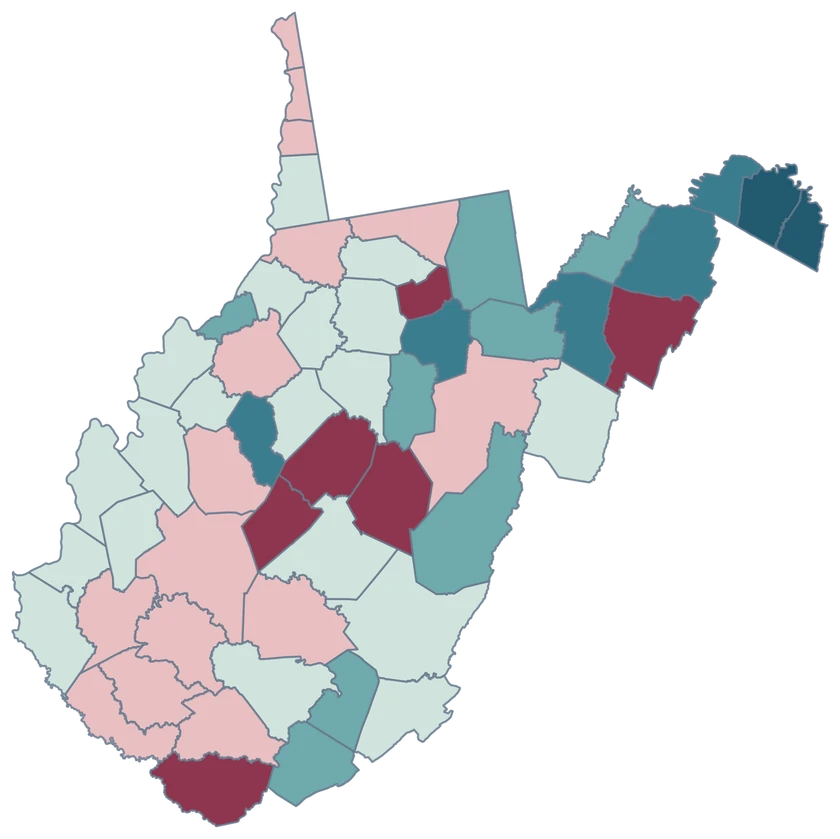
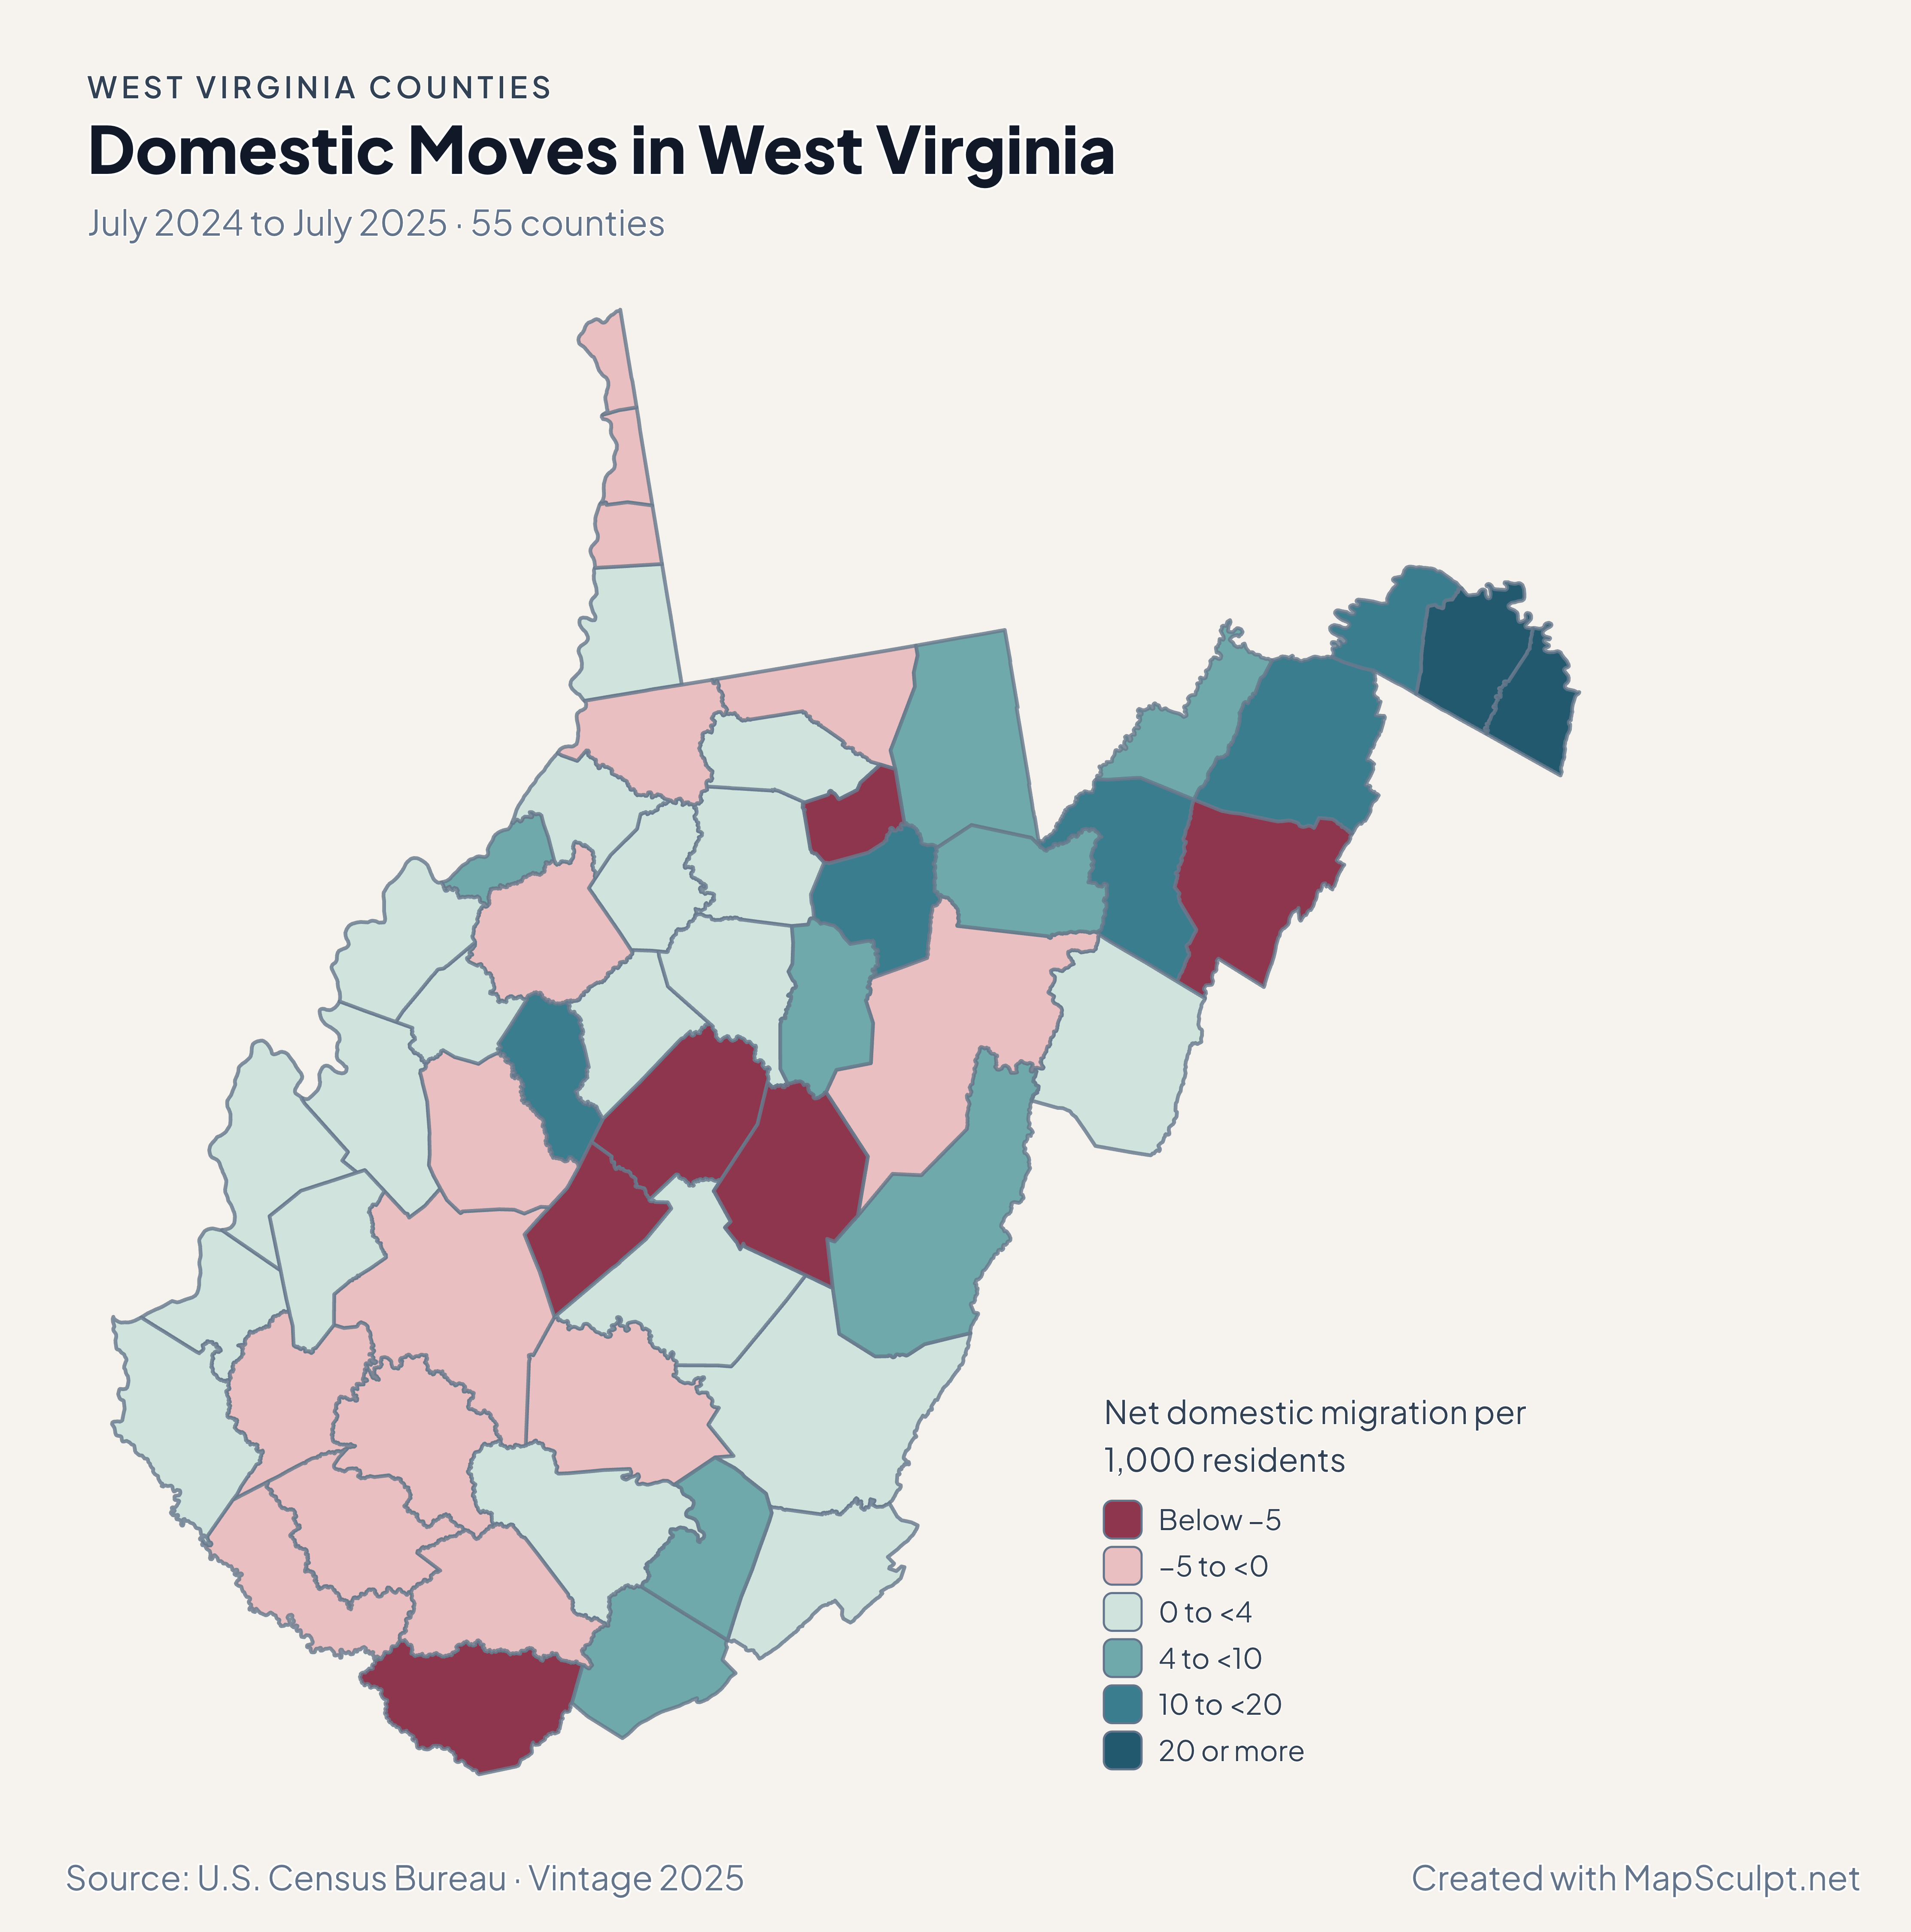
West Virginia county choropleth of domestic moves, including Jefferson, Berkeley, Monongalia.

July 2024 to July 2025 · 55 counties

Domestic moves contrast the panhandle with Morgantown’s county.

Jefferson recorded +27.85 net domestic movers per 1,000 residents, Berkeley +23.13 and Monongalia −2.35. Population can still grow when domestic migration is negative.

Net domestic migration per 1,000 residents

  • Below −5
  • −5 to <0
  • 0 to <4
  • 4 to <10
  • 10 to <20
  • 20 or more

U.S. Census Bureau · Vintage 2025

Download complete PNG

Jefferson grew 2.96%, Berkeley 2.60% and Morgan 1.24% from July 2024 to July 2025. Kanawha declined 0.60%. See the Census estimates ↗

MAKE IT YOURS

From county data to a finished map.

  1. Open the West Virginia editor

    Start with all 55 county features.

  2. Match county records

    Use the five-digit GEOID, such as 54003. Review matches before applying a color scale.

  3. Classify by measurement

    Choose intervals and colors that make the units and direction of change easy to read.

  4. Export the finished map

    Include the source, period and legend in a downloadable PNG.

TRY CSV IMPORT

Try six West Virginia records.

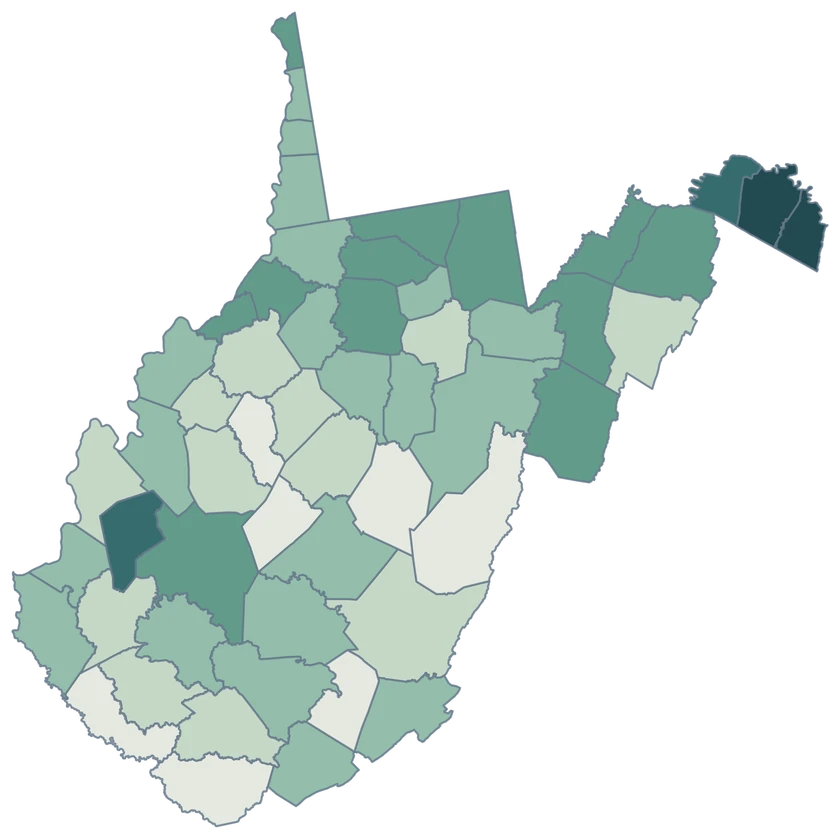
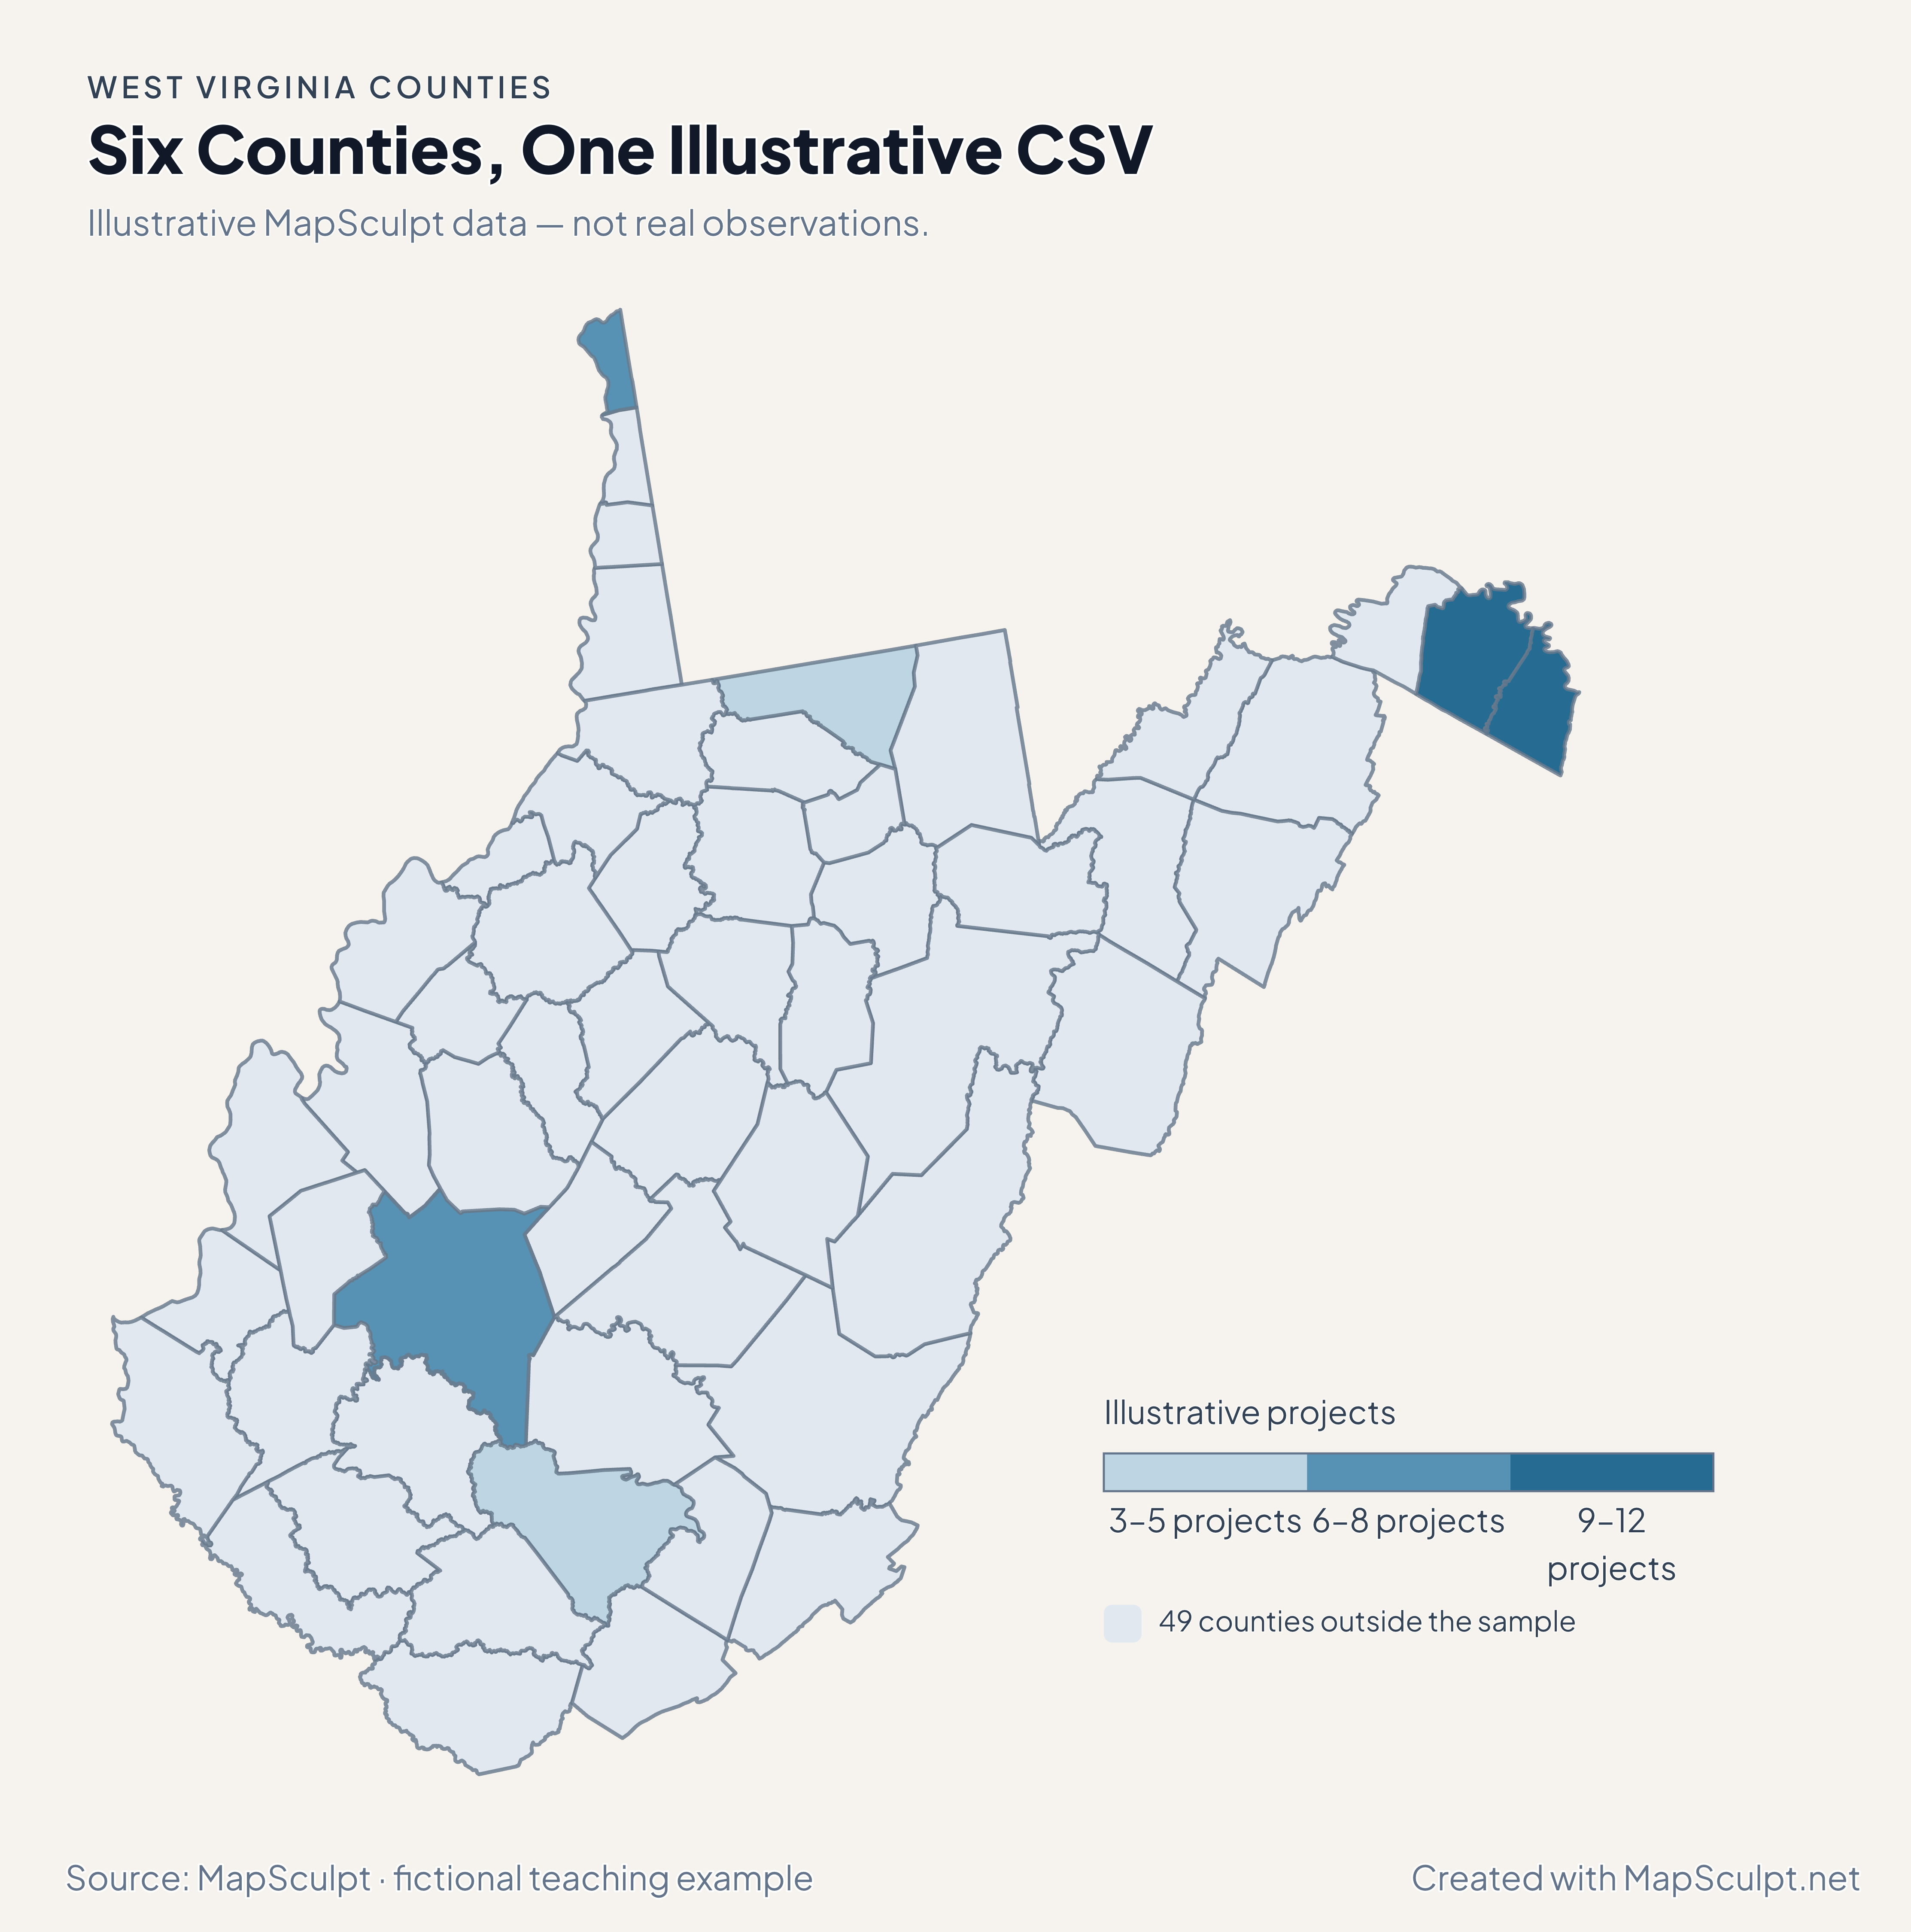
Import the fictional project counts and use breaks of 3, 6, 9 and 12. The remaining 49 counties stay neutral.

Illustrative MapSculpt data — not real observations.
CountyGEOIDProjects
Berkeley County5400312
Jefferson County540379
Kanawha County540397
Monongalia County540613
Hancock County540298
Raleigh County540815

Keep five-digit GEOIDs as text. The sample uses 54003 for Berkeley County.

Download illustrative CSV ↓

Six Counties, One Illustrative CSV

Illustrative MapSculpt data — not real observations.

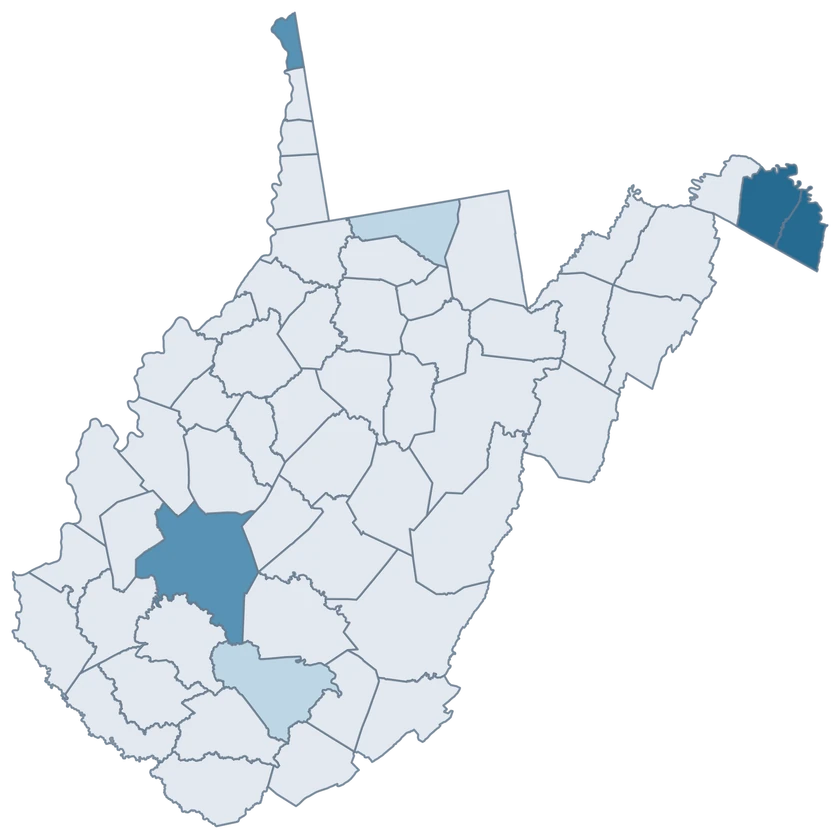
West Virginia example map with six fictional project counts and 49 neutral counties.

Illustrative projects

  • 3–5 projects
  • 6–8 projects
  • 9–12 projects
  • 49 counties outside the sample
Download complete PNG

CSV → Match 6 counties → Style → Export PNG Create a West Virginia map

COUNTY REFERENCE

All 55 West Virginia counties and GEOIDs.

Official county names and five-digit Census GEOIDs. Search by name or code.

  1. Barbour CountyGEOID 54001
  2. Berkeley CountyGEOID 54003
  3. Boone CountyGEOID 54005
  4. Braxton CountyGEOID 54007
  5. Brooke CountyGEOID 54009
  6. Cabell CountyGEOID 54011
  7. Calhoun CountyGEOID 54013
  8. Clay CountyGEOID 54015
  9. Doddridge CountyGEOID 54017
  10. Fayette CountyGEOID 54019
  11. Gilmer CountyGEOID 54021
  12. Grant CountyGEOID 54023
  13. Greenbrier CountyGEOID 54025
  14. Hampshire CountyGEOID 54027
  15. Hancock CountyGEOID 54029
  16. Hardy CountyGEOID 54031
  17. Harrison CountyGEOID 54033
  18. Jackson CountyGEOID 54035
  19. Jefferson CountyGEOID 54037
  20. Kanawha CountyGEOID 54039
  21. Lewis CountyGEOID 54041
  22. Lincoln CountyGEOID 54043
  23. Logan CountyGEOID 54045
  24. Marion CountyGEOID 54049
  25. Marshall CountyGEOID 54051
  26. Mason CountyGEOID 54053
  27. McDowell CountyGEOID 54047
  28. Mercer CountyGEOID 54055
  29. Mineral CountyGEOID 54057
  30. Mingo CountyGEOID 54059
  31. Monongalia CountyGEOID 54061
  32. Monroe CountyGEOID 54063
  33. Morgan CountyGEOID 54065
  34. Nicholas CountyGEOID 54067
  35. Ohio CountyGEOID 54069
  36. Pendleton CountyGEOID 54071
  37. Pleasants CountyGEOID 54073
  38. Pocahontas CountyGEOID 54075
  39. Preston CountyGEOID 54077
  40. Putnam CountyGEOID 54079
  41. Raleigh CountyGEOID 54081
  42. Randolph CountyGEOID 54083
  43. Ritchie CountyGEOID 54085
  44. Roane CountyGEOID 54087
  45. Summers CountyGEOID 54089
  46. Taylor CountyGEOID 54091
  47. Tucker CountyGEOID 54093
  48. Tyler CountyGEOID 54095
  49. Upshur CountyGEOID 54097
  50. Wayne CountyGEOID 54099
  51. Webster CountyGEOID 54101
  52. Wetzel CountyGEOID 54103
  53. Wirt CountyGEOID 54105
  54. Wood CountyGEOID 54107
  55. Wyoming CountyGEOID 54109

U.S. Census Bureau · 2025 Cartographic Boundary Files

COMMON QUESTIONS

West Virginia county map questions.

Which counties make up the Eastern Panhandle in this comparison?

The guide highlights Berkeley, Jefferson and Morgan. Each can be colored independently in the editor.

Which GEOID covers Charleston, West Virginia’s county?

Use 54039 for Kanawha County, where Charleston is located. Do not use a South Carolina identifier or a city-only record for a county join.

What about the Northern Panhandle?

Its narrow shape remains visible in the native county geography. Hancock County is independently selectable under GEOID 54029.

Which identifier should Morgantown-area county records use?

Use 54061 if the source covers all of Monongalia County. City records are a different geography.

Can I compare both panhandles in one map?

Yes. Use the same units and reference period across counties. Add a legend or caption to state which counties you grouped.

Can migration alone explain why a county shrank?

The population estimate also reflects international moves, births and deaths. The maps describe separate measures.

YOUR NEXT MAP STARTS HERE

Build your West Virginia county map.

Join your own West Virginia county records by GEOID, review the matches and export with an accurate legend.

Create a West Virginia map