Skip to content
MapSculpt

GEOGRAPHIC MAP MAKER / CALIFORNIA

California
Counties Map Maker

Color all 58 California counties. Add your own data, customize colors and legends, and export a map ready to share.

Free online editor · No sign-up required

58counties individually editable

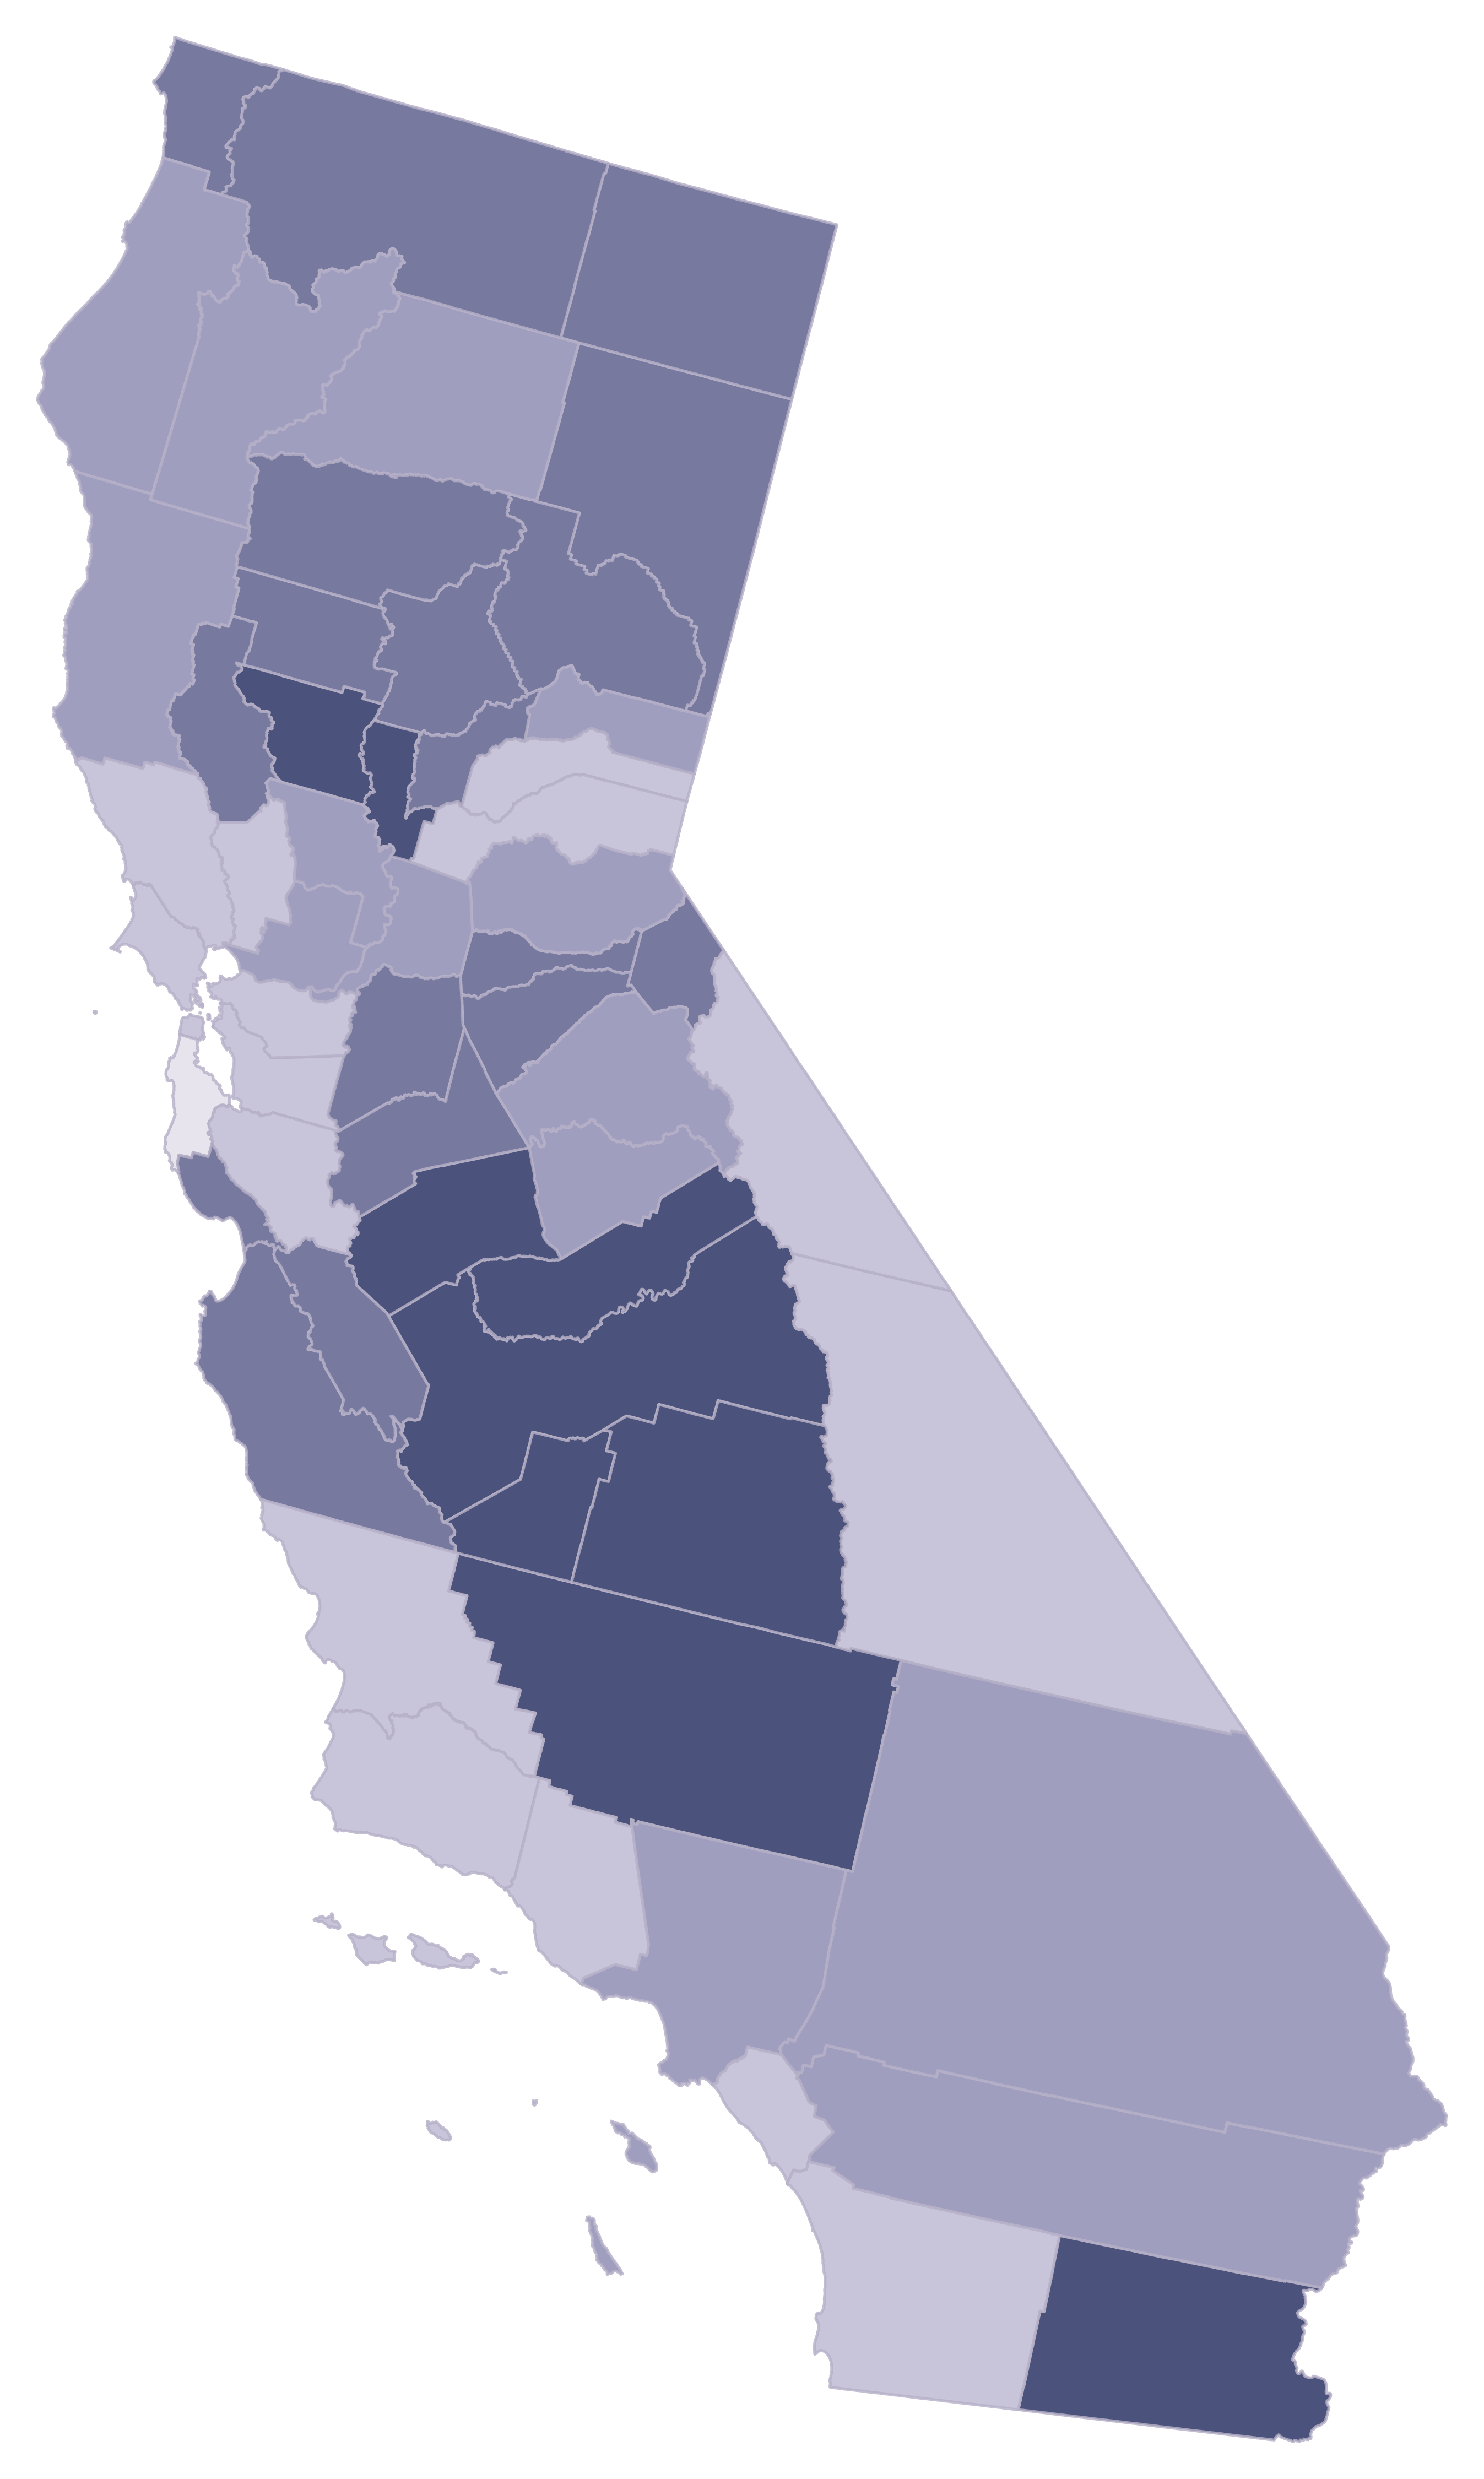
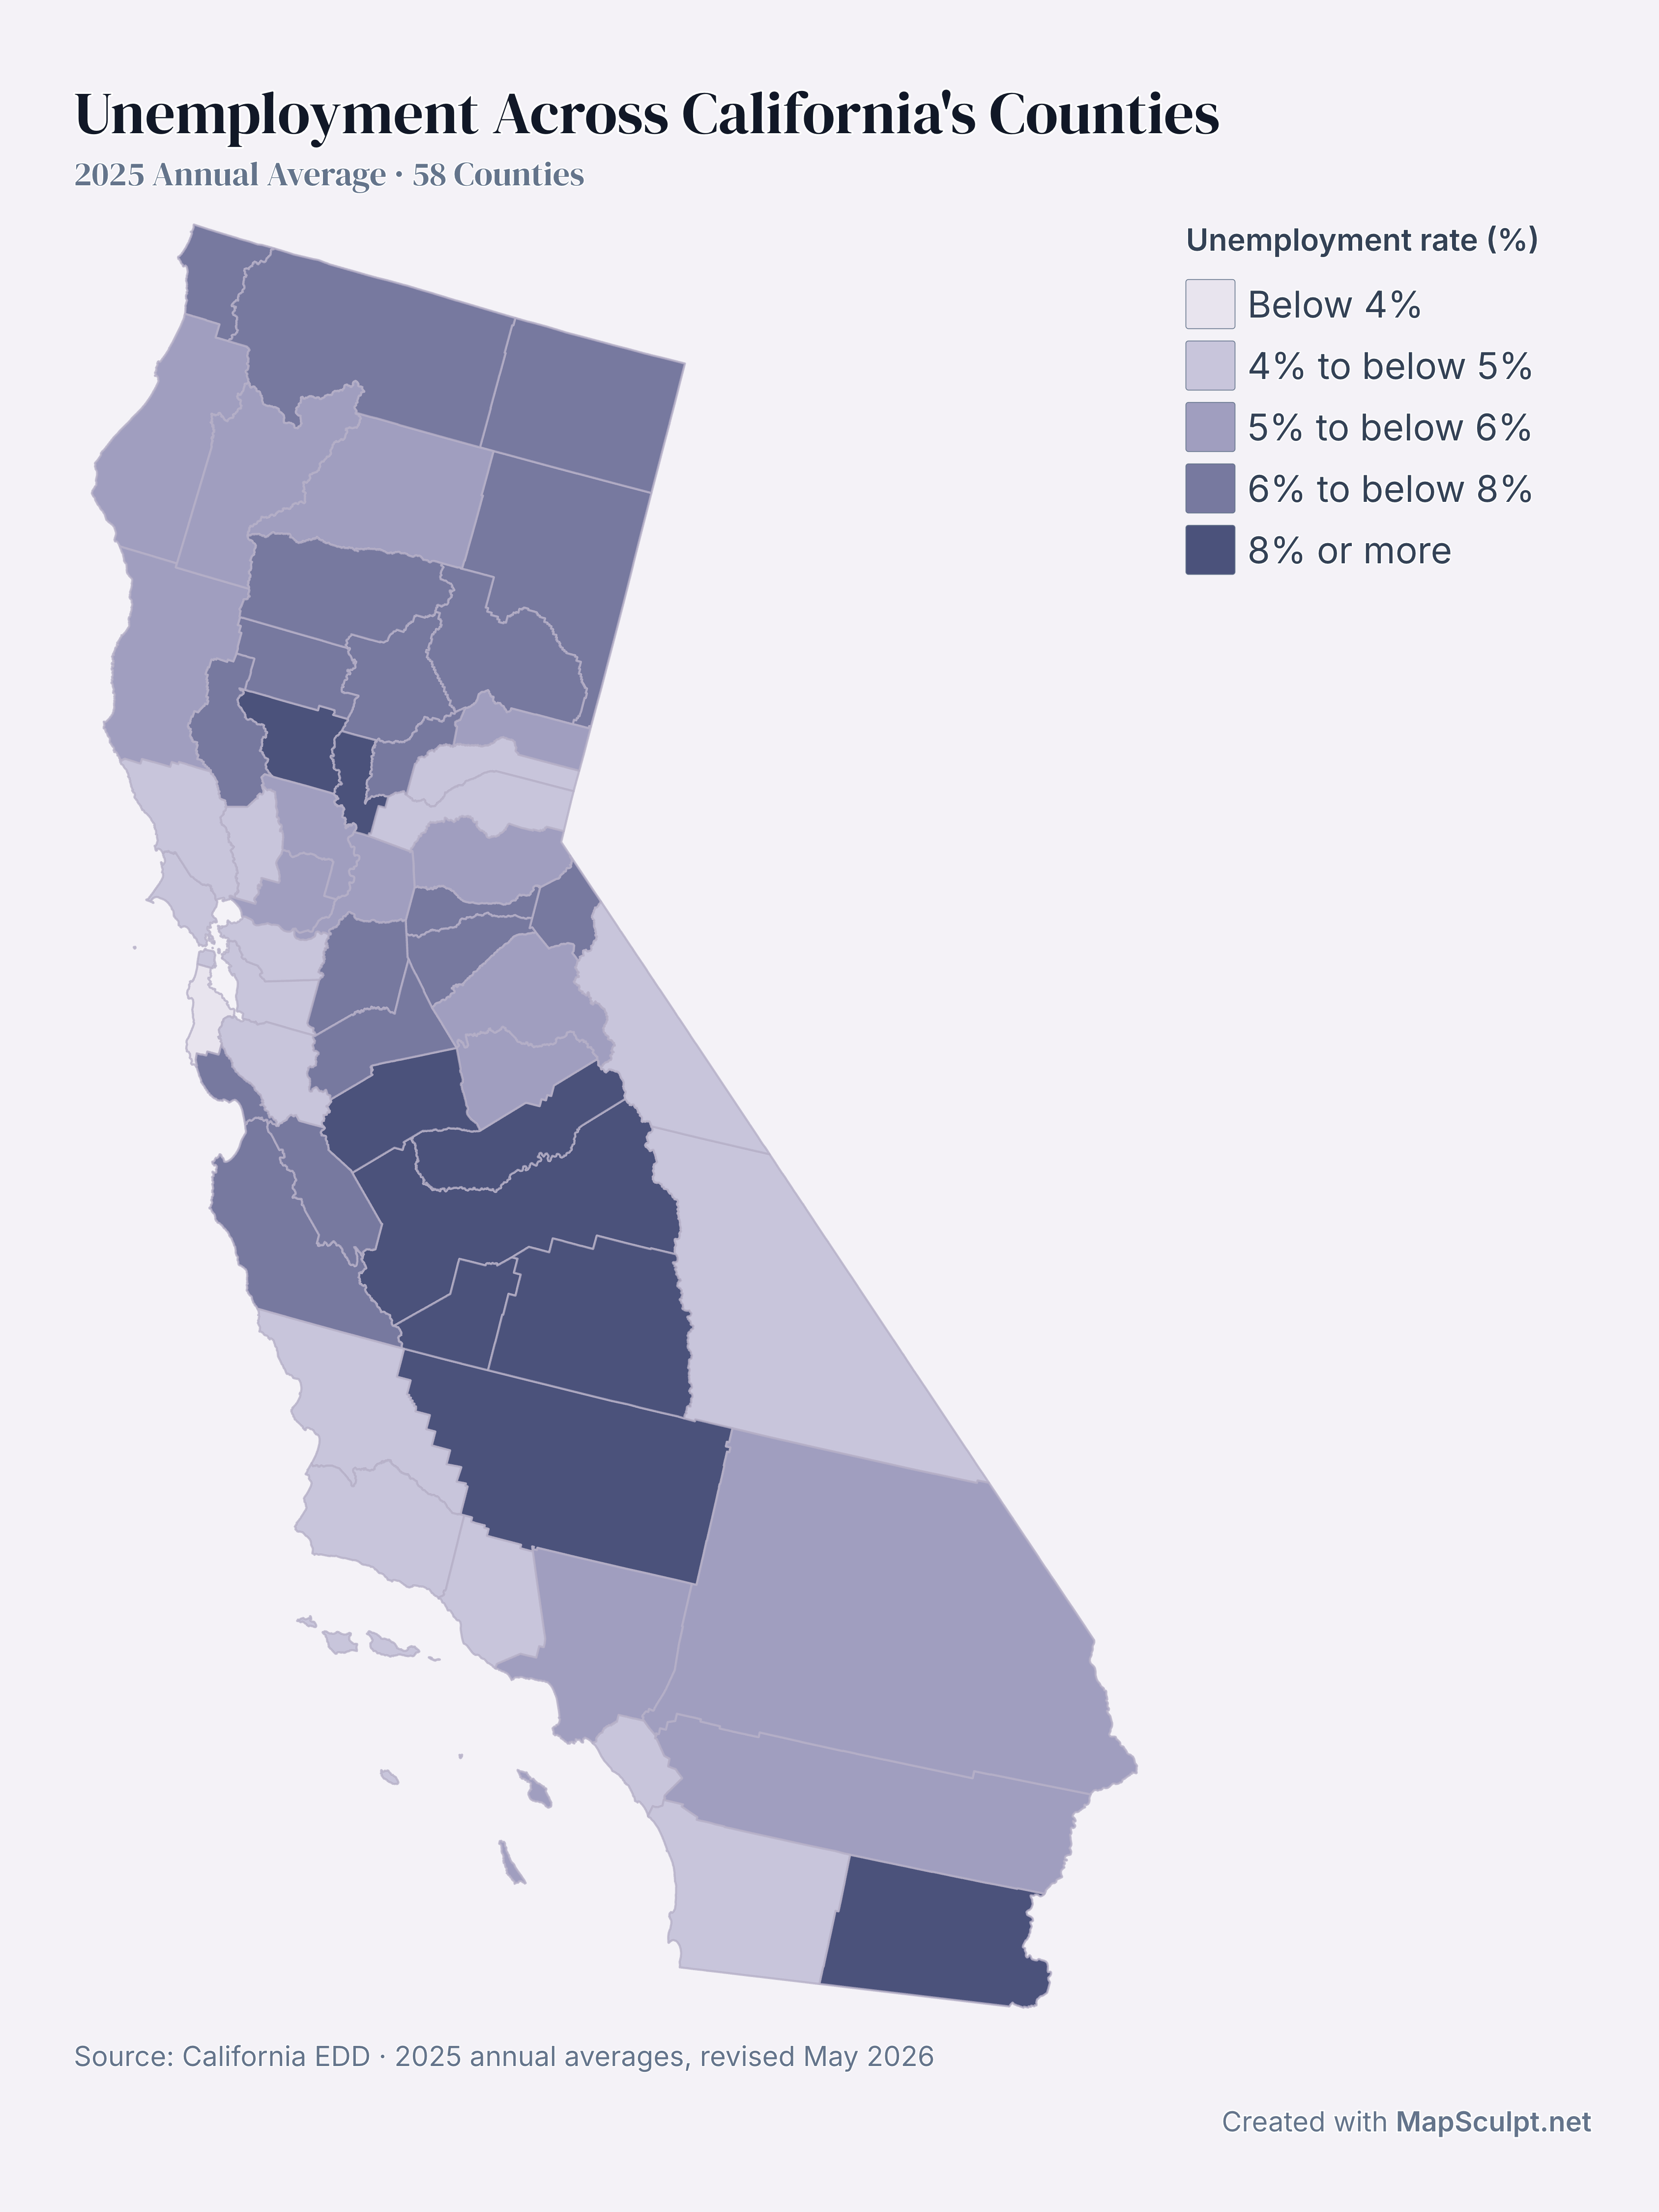
Unemployment Across California's Counties

2025 Annual Average · 58 Counties

Map of annual-average unemployment across California's 58 counties in 2025. San Mateo County had the lowest rate at 3.9% and Imperial County the highest at 18.9%.

Unemployment rate (%)

  • Below 4%
  • 4% to below 5%
  • 5% to below 6%
  • 6% to below 8%
  • 8% or more
Source: California EDD · 2025 annual averages, revised May 2026View full-size export

01 / KNOW YOUR GEOGRAPHY

58 counties. One California.

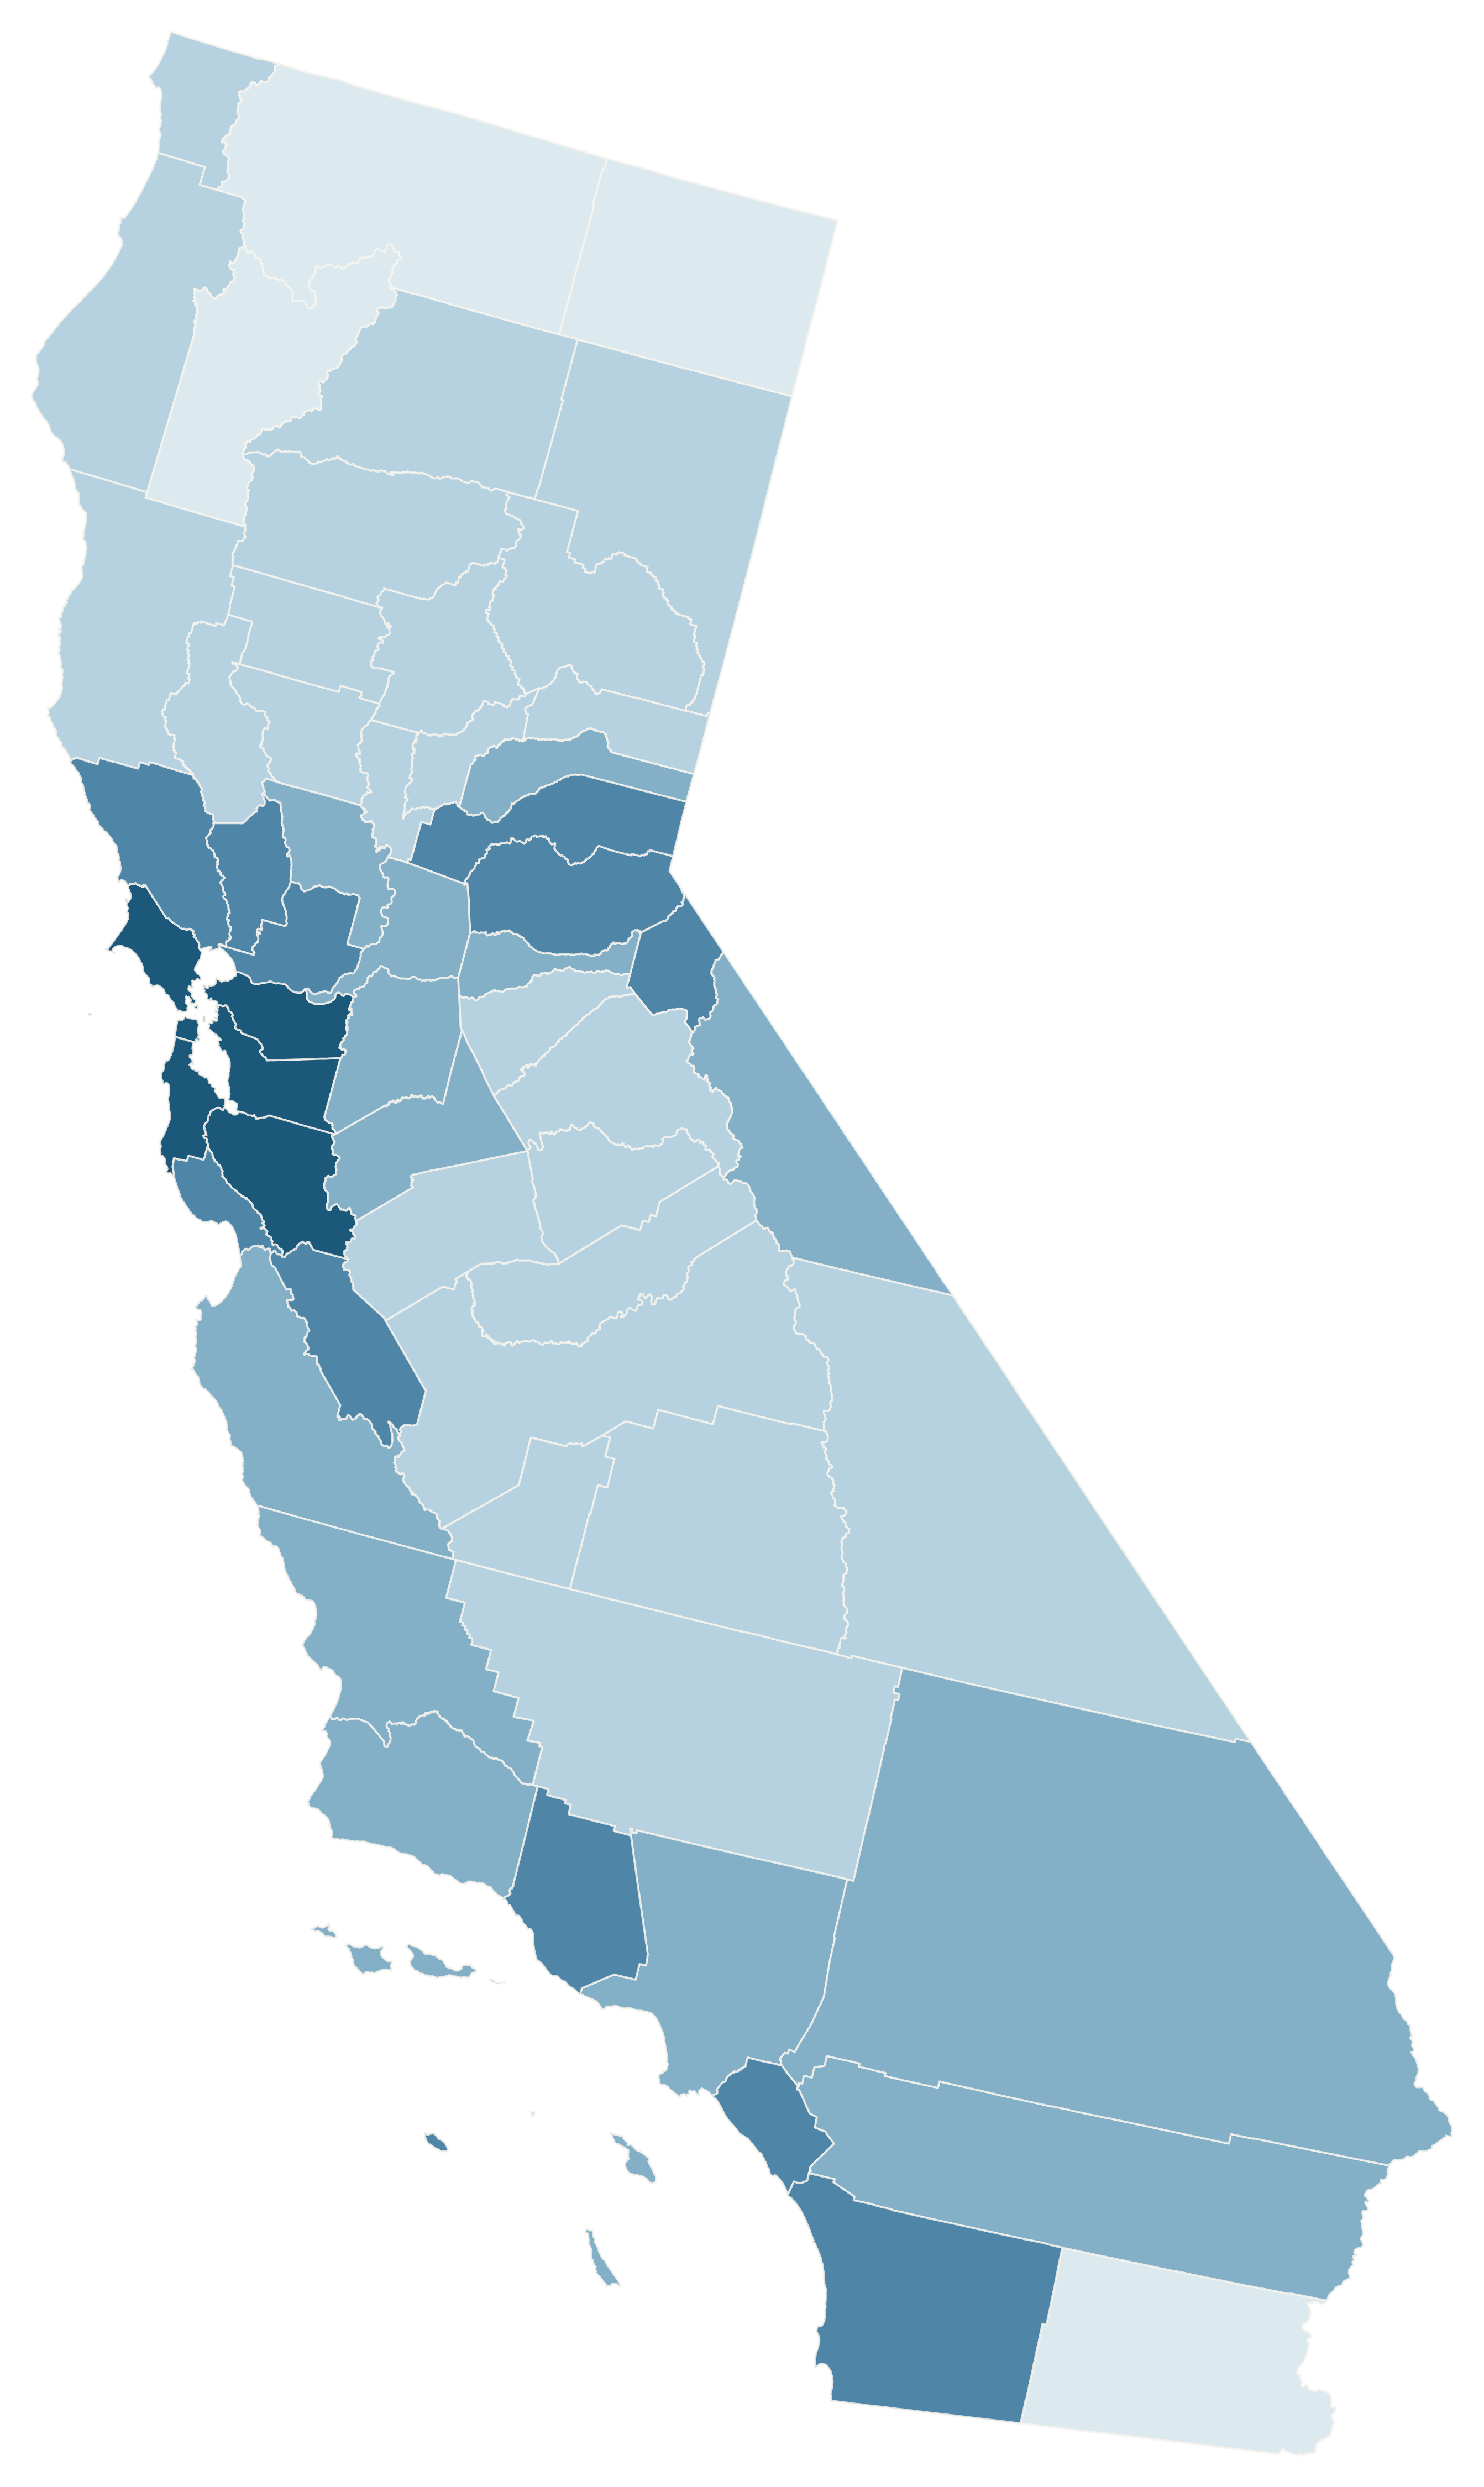
From Del Norte to San Diego, every California county is independently editable. Small Bay Area counties and coastal islands are included.

County boundaries—not cities, ZIP codes or congressional districts.

Browse all 58 county FIPS codes ↗

02 / MADE WITH MAPSCULPT

One California. Many stories.

Real county geometry. Official population, housing and income data, exported directly from MapSculpt.

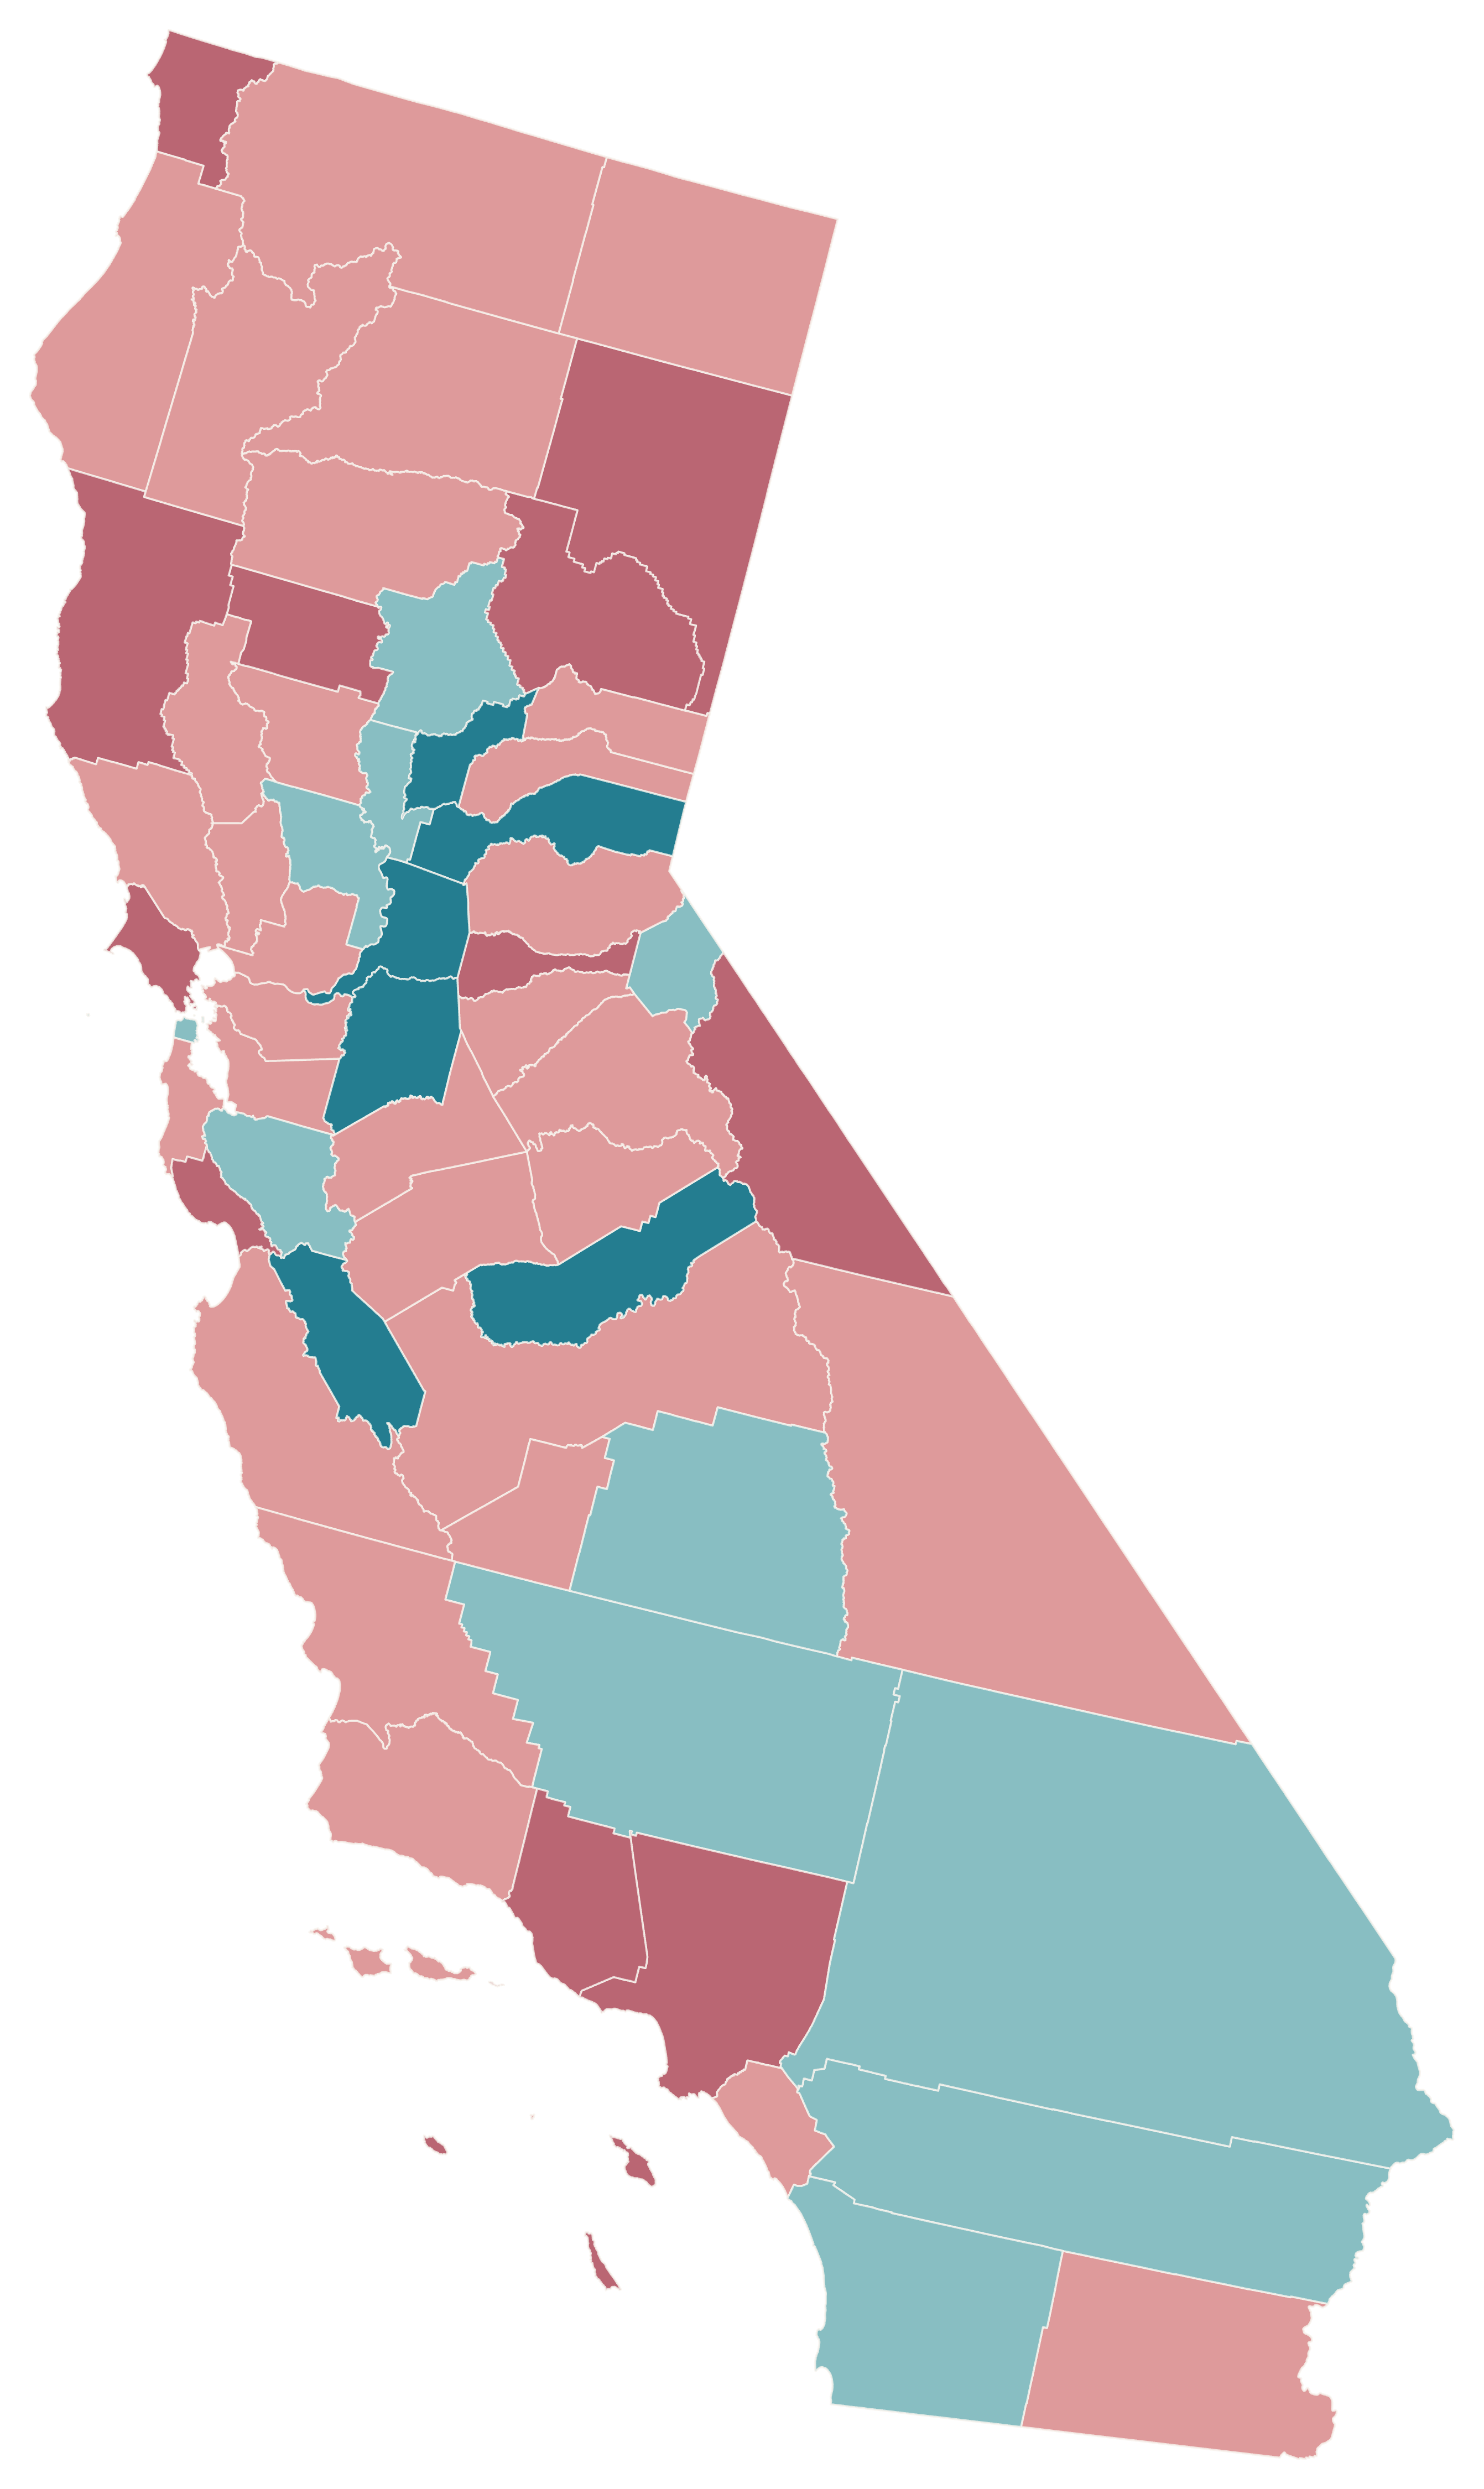
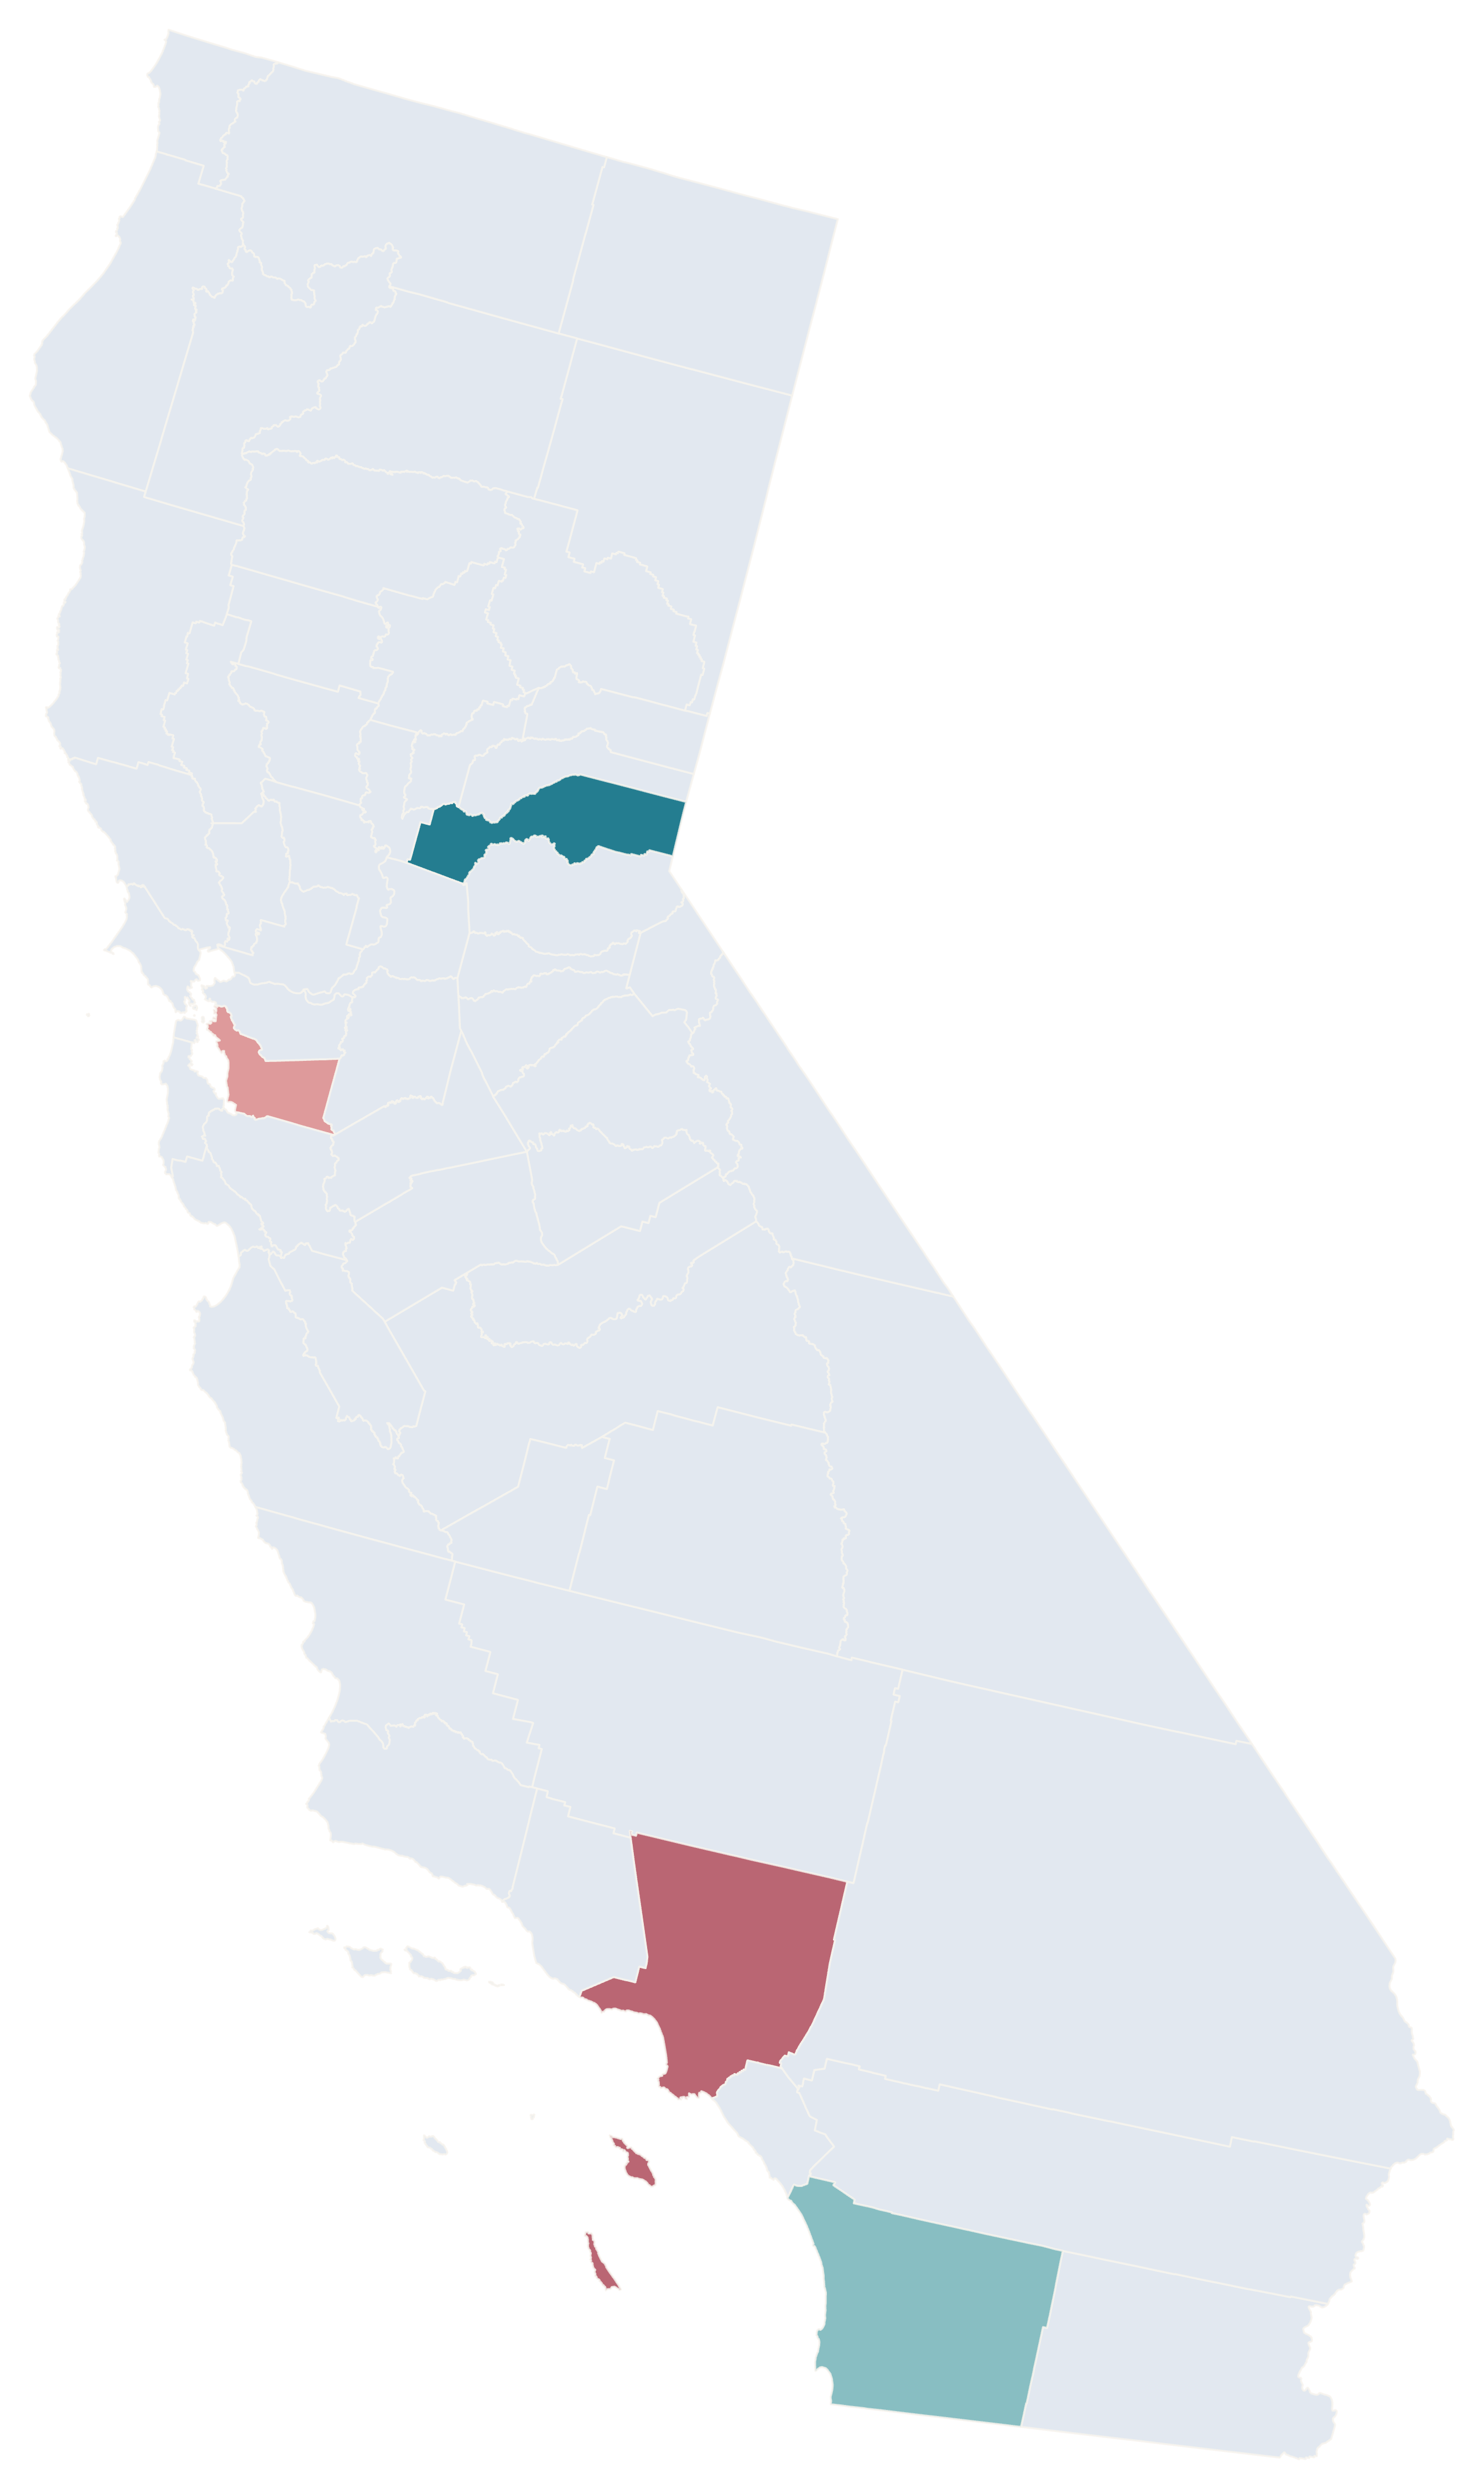
Population change across all 58 California counties, January 1, 2025 to January 1, 2026. Coral indicates decline and teal growth; 17 counties grew and 41 declined. Placer grew 1.39%; Los Angeles declined 0.64%.

01 / OFFICIAL DATA · E-1 MAY 2026

Where California is growing — and shrinking.

Compare all 58 counties from January 1, 2025 to January 1, 2026. Coral shows population decline; teal shows growth.

Placer · fastest growth
+1.39%
Los Angeles · decline
−0.64%

17 counties grew; 41 declined. No county had zero change. 2025 revised; 2026 provisional.

  • < −0.5%
  • −0.5% to < 0%
  • 0% · none
  • > 0% to 0.5%
  • > 0.5%

Source: California Department of Finance · E-1 · May 2026

Create your own county map

MAKE IT YOURS

From county data to a finished map.

  1. 01

    Choose your counties

    Open the 58-county California editor and select the areas you want to highlight.

  2. 02

    Import your CSV

    Match five-digit county GEOIDs or names, then apply numerical or categorical colors.

  3. 03

    Add context

    Use the Text tool for annotations. Add a title, source and readable legend.

  4. 04

    Export your PNG

    Choose a map style and background, then download an image for your project.

03 / CALIFORNIA COUNTY CSV

From spreadsheet to county map.

Use five-digit Census GEOIDs to match county-level values. Review the matches, choose a color scale, and export your own map.

OFFICIAL INPUT · POPULATION CHANGE (%)
CountyGEOIDChange %
Alameda06001−0.11
Los Angeles06037−0.64
Placer06061+1.39
San Diego06073+0.15

Source: CA DOF E-1, May 2026. Display rounded to 2 decimals.

Keep GEOIDs as text so the leading zero is preserved.

Download sample CSV ↗
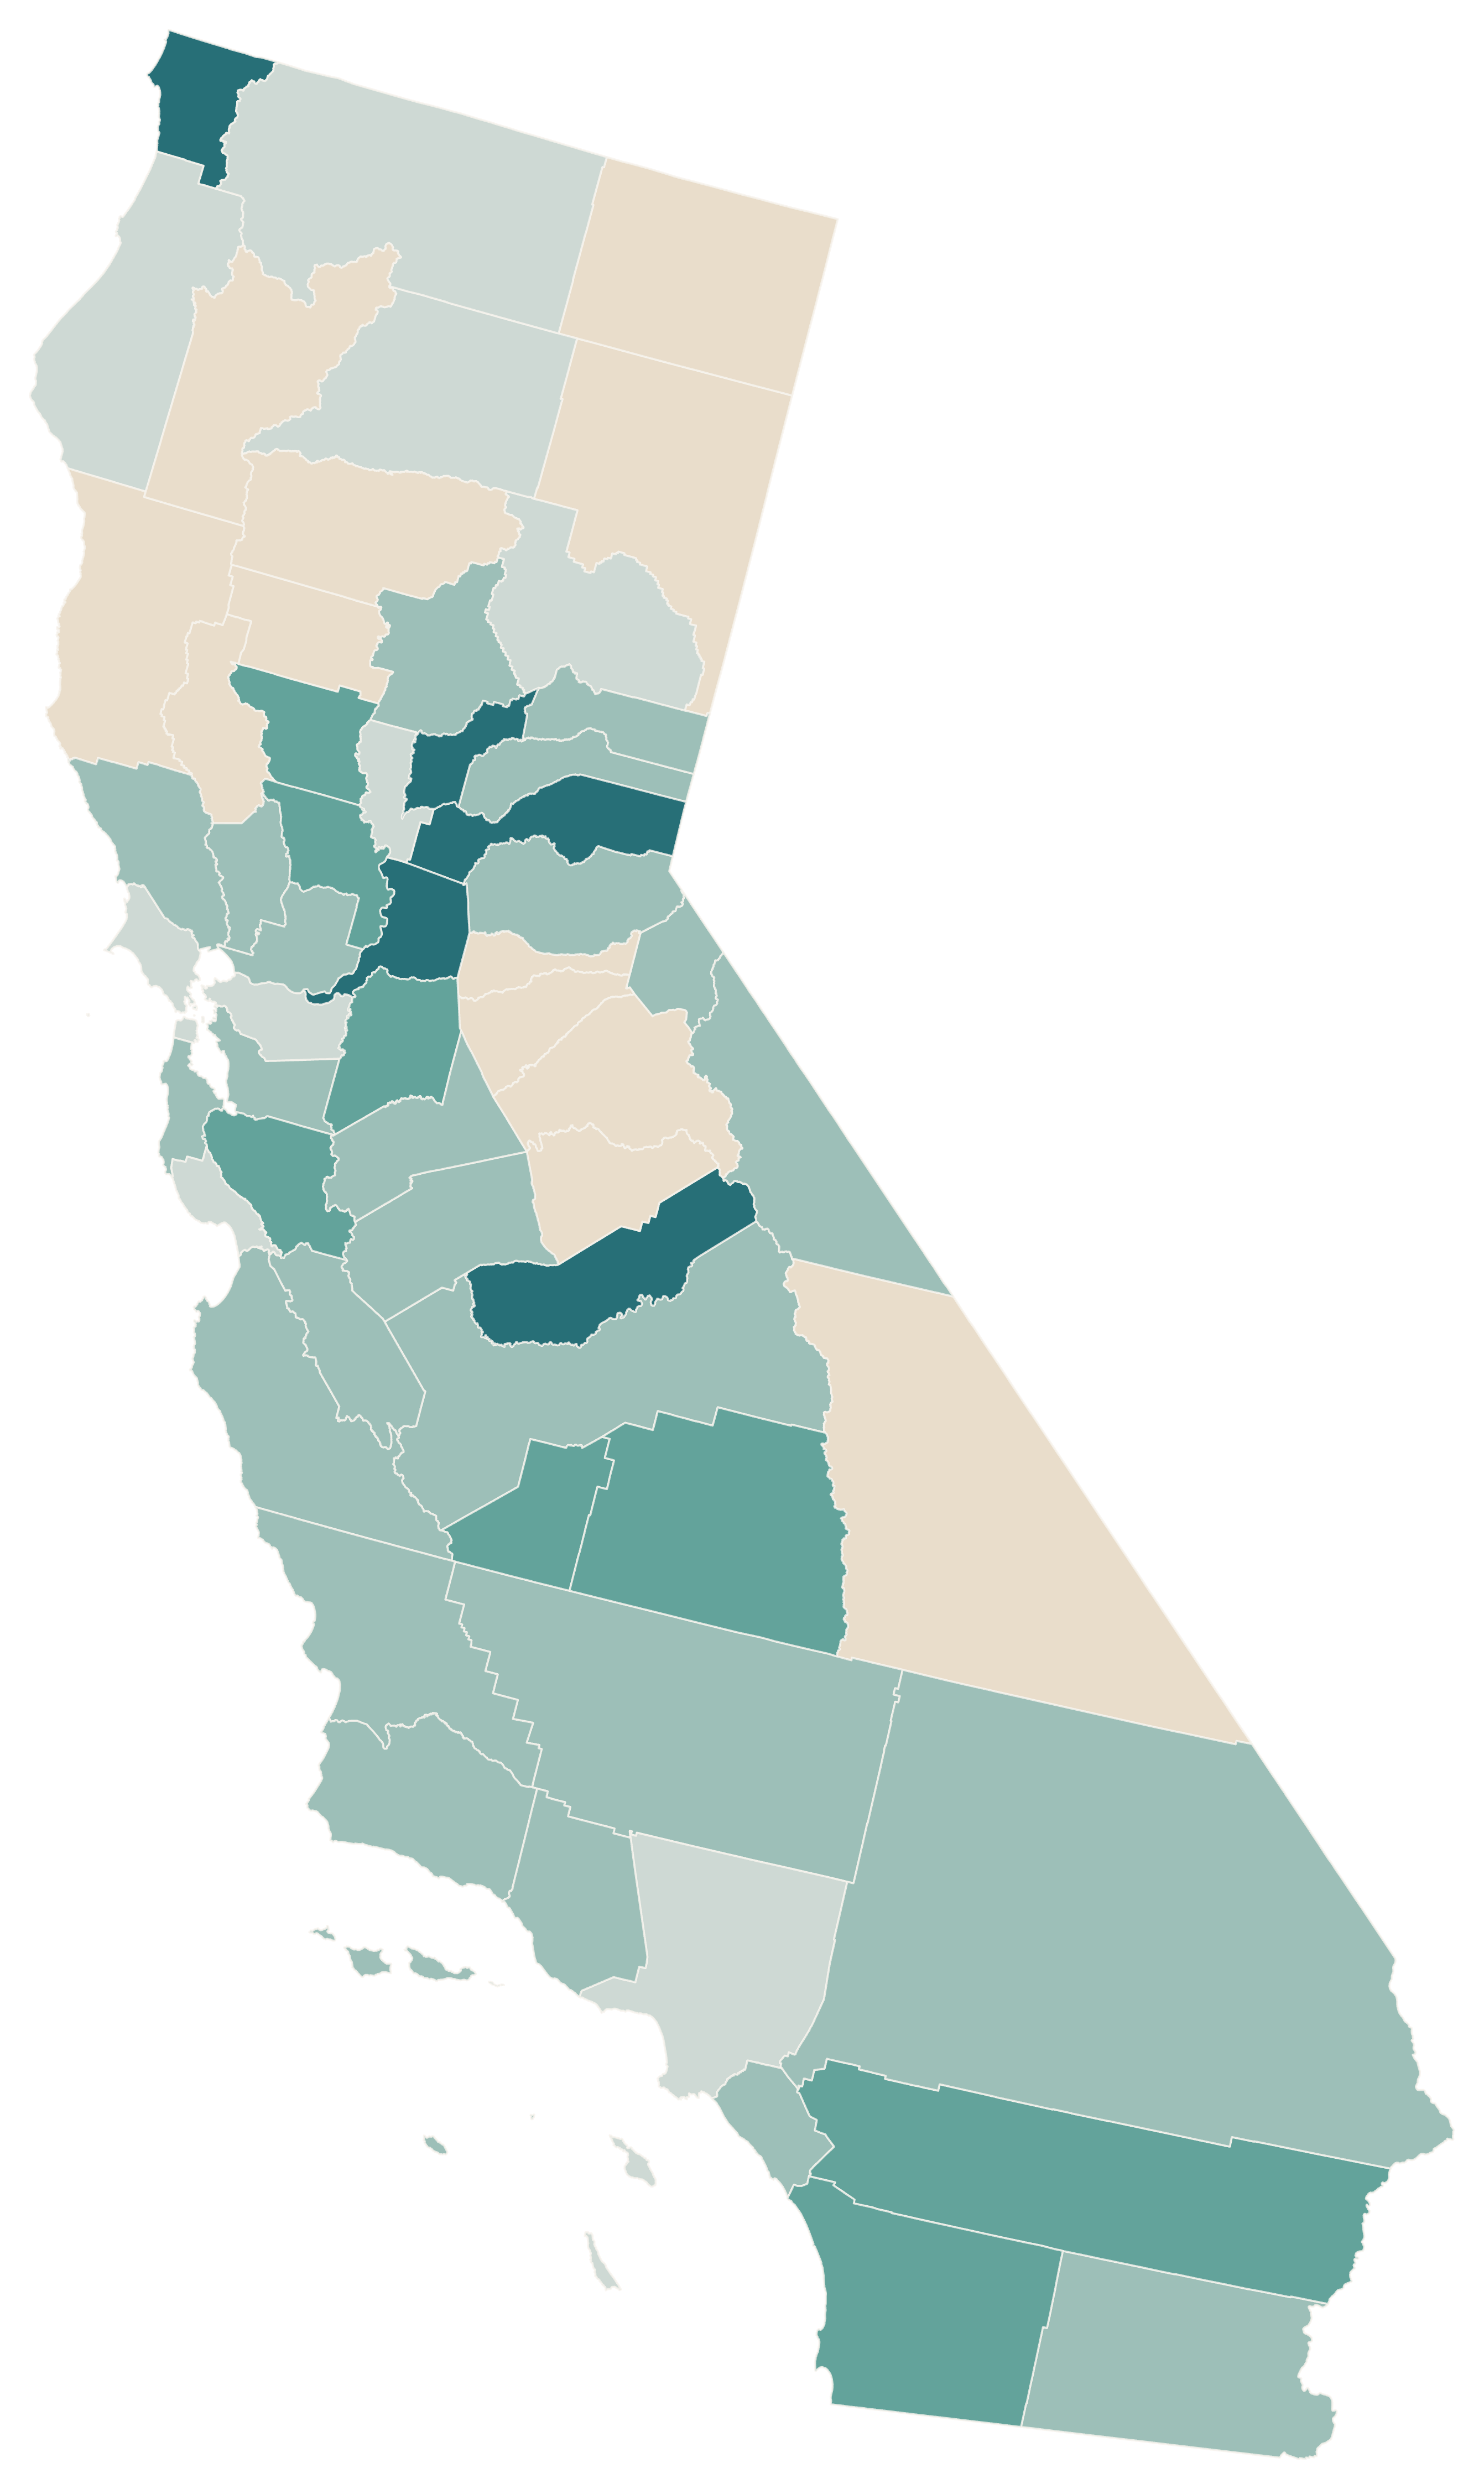
Four-county population-change sample: Alameda −0.11%, Los Angeles −0.64%, Placer +1.39%, and San Diego +0.15%. The other 54 California counties are neutral and have no sample value.
  • Alameda −0.11%
  • Los Angeles −0.64%
  • Placer +1.39%
  • San Diego +0.15%
  • Other counties · Not in sample

CSV → Match counties → Apply colors → Customize → Export PNG · Create a California map

04 / CALIFORNIA COUNTY REFERENCE

California's 58 counties.

Browse all 58 counties with their five-digit Census GEOIDs. Keep the leading zero when importing CSV data.

View all 58 counties and FIPS codes
  • Alameda CountyFIPS 06001
  • Alpine CountyFIPS 06003
  • Amador CountyFIPS 06005
  • Butte CountyFIPS 06007
  • Calaveras CountyFIPS 06009
  • Colusa CountyFIPS 06011
  • Contra Costa CountyFIPS 06013
  • Del Norte CountyFIPS 06015
  • El Dorado CountyFIPS 06017
  • Fresno CountyFIPS 06019
  • Glenn CountyFIPS 06021
  • Humboldt CountyFIPS 06023
  • Imperial CountyFIPS 06025
  • Inyo CountyFIPS 06027
  • Kern CountyFIPS 06029
  • Kings CountyFIPS 06031
  • Lake CountyFIPS 06033
  • Lassen CountyFIPS 06035
  • Los Angeles CountyFIPS 06037
  • Madera CountyFIPS 06039
  • Marin CountyFIPS 06041
  • Mariposa CountyFIPS 06043
  • Mendocino CountyFIPS 06045
  • Merced CountyFIPS 06047
  • Modoc CountyFIPS 06049
  • Mono CountyFIPS 06051
  • Monterey CountyFIPS 06053
  • Napa CountyFIPS 06055
  • Nevada CountyFIPS 06057
  • Orange CountyFIPS 06059
  • Placer CountyFIPS 06061
  • Plumas CountyFIPS 06063
  • Riverside CountyFIPS 06065
  • Sacramento CountyFIPS 06067
  • San Benito CountyFIPS 06069
  • San Bernardino CountyFIPS 06071
  • San Diego CountyFIPS 06073
  • San Francisco CountyFIPS 06075
  • San Joaquin CountyFIPS 06077
  • San Luis Obispo CountyFIPS 06079
  • San Mateo CountyFIPS 06081
  • Santa Barbara CountyFIPS 06083
  • Santa Clara CountyFIPS 06085
  • Santa Cruz CountyFIPS 06087
  • Shasta CountyFIPS 06089
  • Sierra CountyFIPS 06091
  • Siskiyou CountyFIPS 06093
  • Solano CountyFIPS 06095
  • Sonoma CountyFIPS 06097
  • Stanislaus CountyFIPS 06099
  • Sutter CountyFIPS 06101
  • Tehama CountyFIPS 06103
  • Trinity CountyFIPS 06105
  • Tulare CountyFIPS 06107
  • Tuolumne CountyFIPS 06109
  • Ventura CountyFIPS 06111
  • Yolo CountyFIPS 06113
  • Yuba CountyFIPS 06115

Source: U.S. Census Bureau · 2025 county boundaries and GEOIDs

COMMON QUESTIONS

California county map questions.

How do I color individual California counties?

Open the California template, color its counties and export your finished map as a PNG.

How many counties does California have?

California has 58 counties. The template includes all 58, from Alameda to Yuba, with official five-digit Census GEOIDs.

Can I download a blank California county map?

Yes. Open the editor, choose a neutral fill and county borders, then export a blank map as a PNG.

Are county names available in the editor?

Yes. Each county has its official name and five-digit GEOID for selection and data matching. The reference directory above lists all 58.

Does it include cities or ZIP-code boundaries?

This template shows county boundaries, including relevant offshore islands. It does not show separate city or ZIP-code boundaries.

Can I import CSV data using county GEOIDs?

Yes. Use five-digit GEOIDs such as 06001 for Alameda or 06037 for Los Angeles, stored as text to preserve leading zeroes. Import your CSV, review county matches, then apply numerical or categorical colors.

Can I export a high-resolution PNG?

Yes. Customize the map, title, legend and source annotation, then choose the PNG export settings for your report, article or presentation.

Can I use my map for research or education?

Yes. The geography uses U.S. Census Bureau 2025 county boundaries. Cite the boundary source and your statistical dataset separately, check each dataset’s terms, and describe the observation period. ACS estimates have sampling uncertainty; the downloadable income data retain margins of error.

Is the California map maker free?

Yes. You can color counties, customize your map and export a PNG in the free online editor without signing up.

Can I create maps for r/MapPorn and r/dataisbeautiful?

Yes. Use verified data from official sources, include a clear title, legend and source, and export your map. Check each community’s current posting rules before sharing.

YOUR NEXT MAP STARTS HERE

Make California's geography your own.

Start with all 58 counties. Make a map worth sharing.

Create a California map