Skip to content
MapSculpt

GEOGRAPHIC MAP MAKER / INDIANA

Indiana
Counties Map Maker

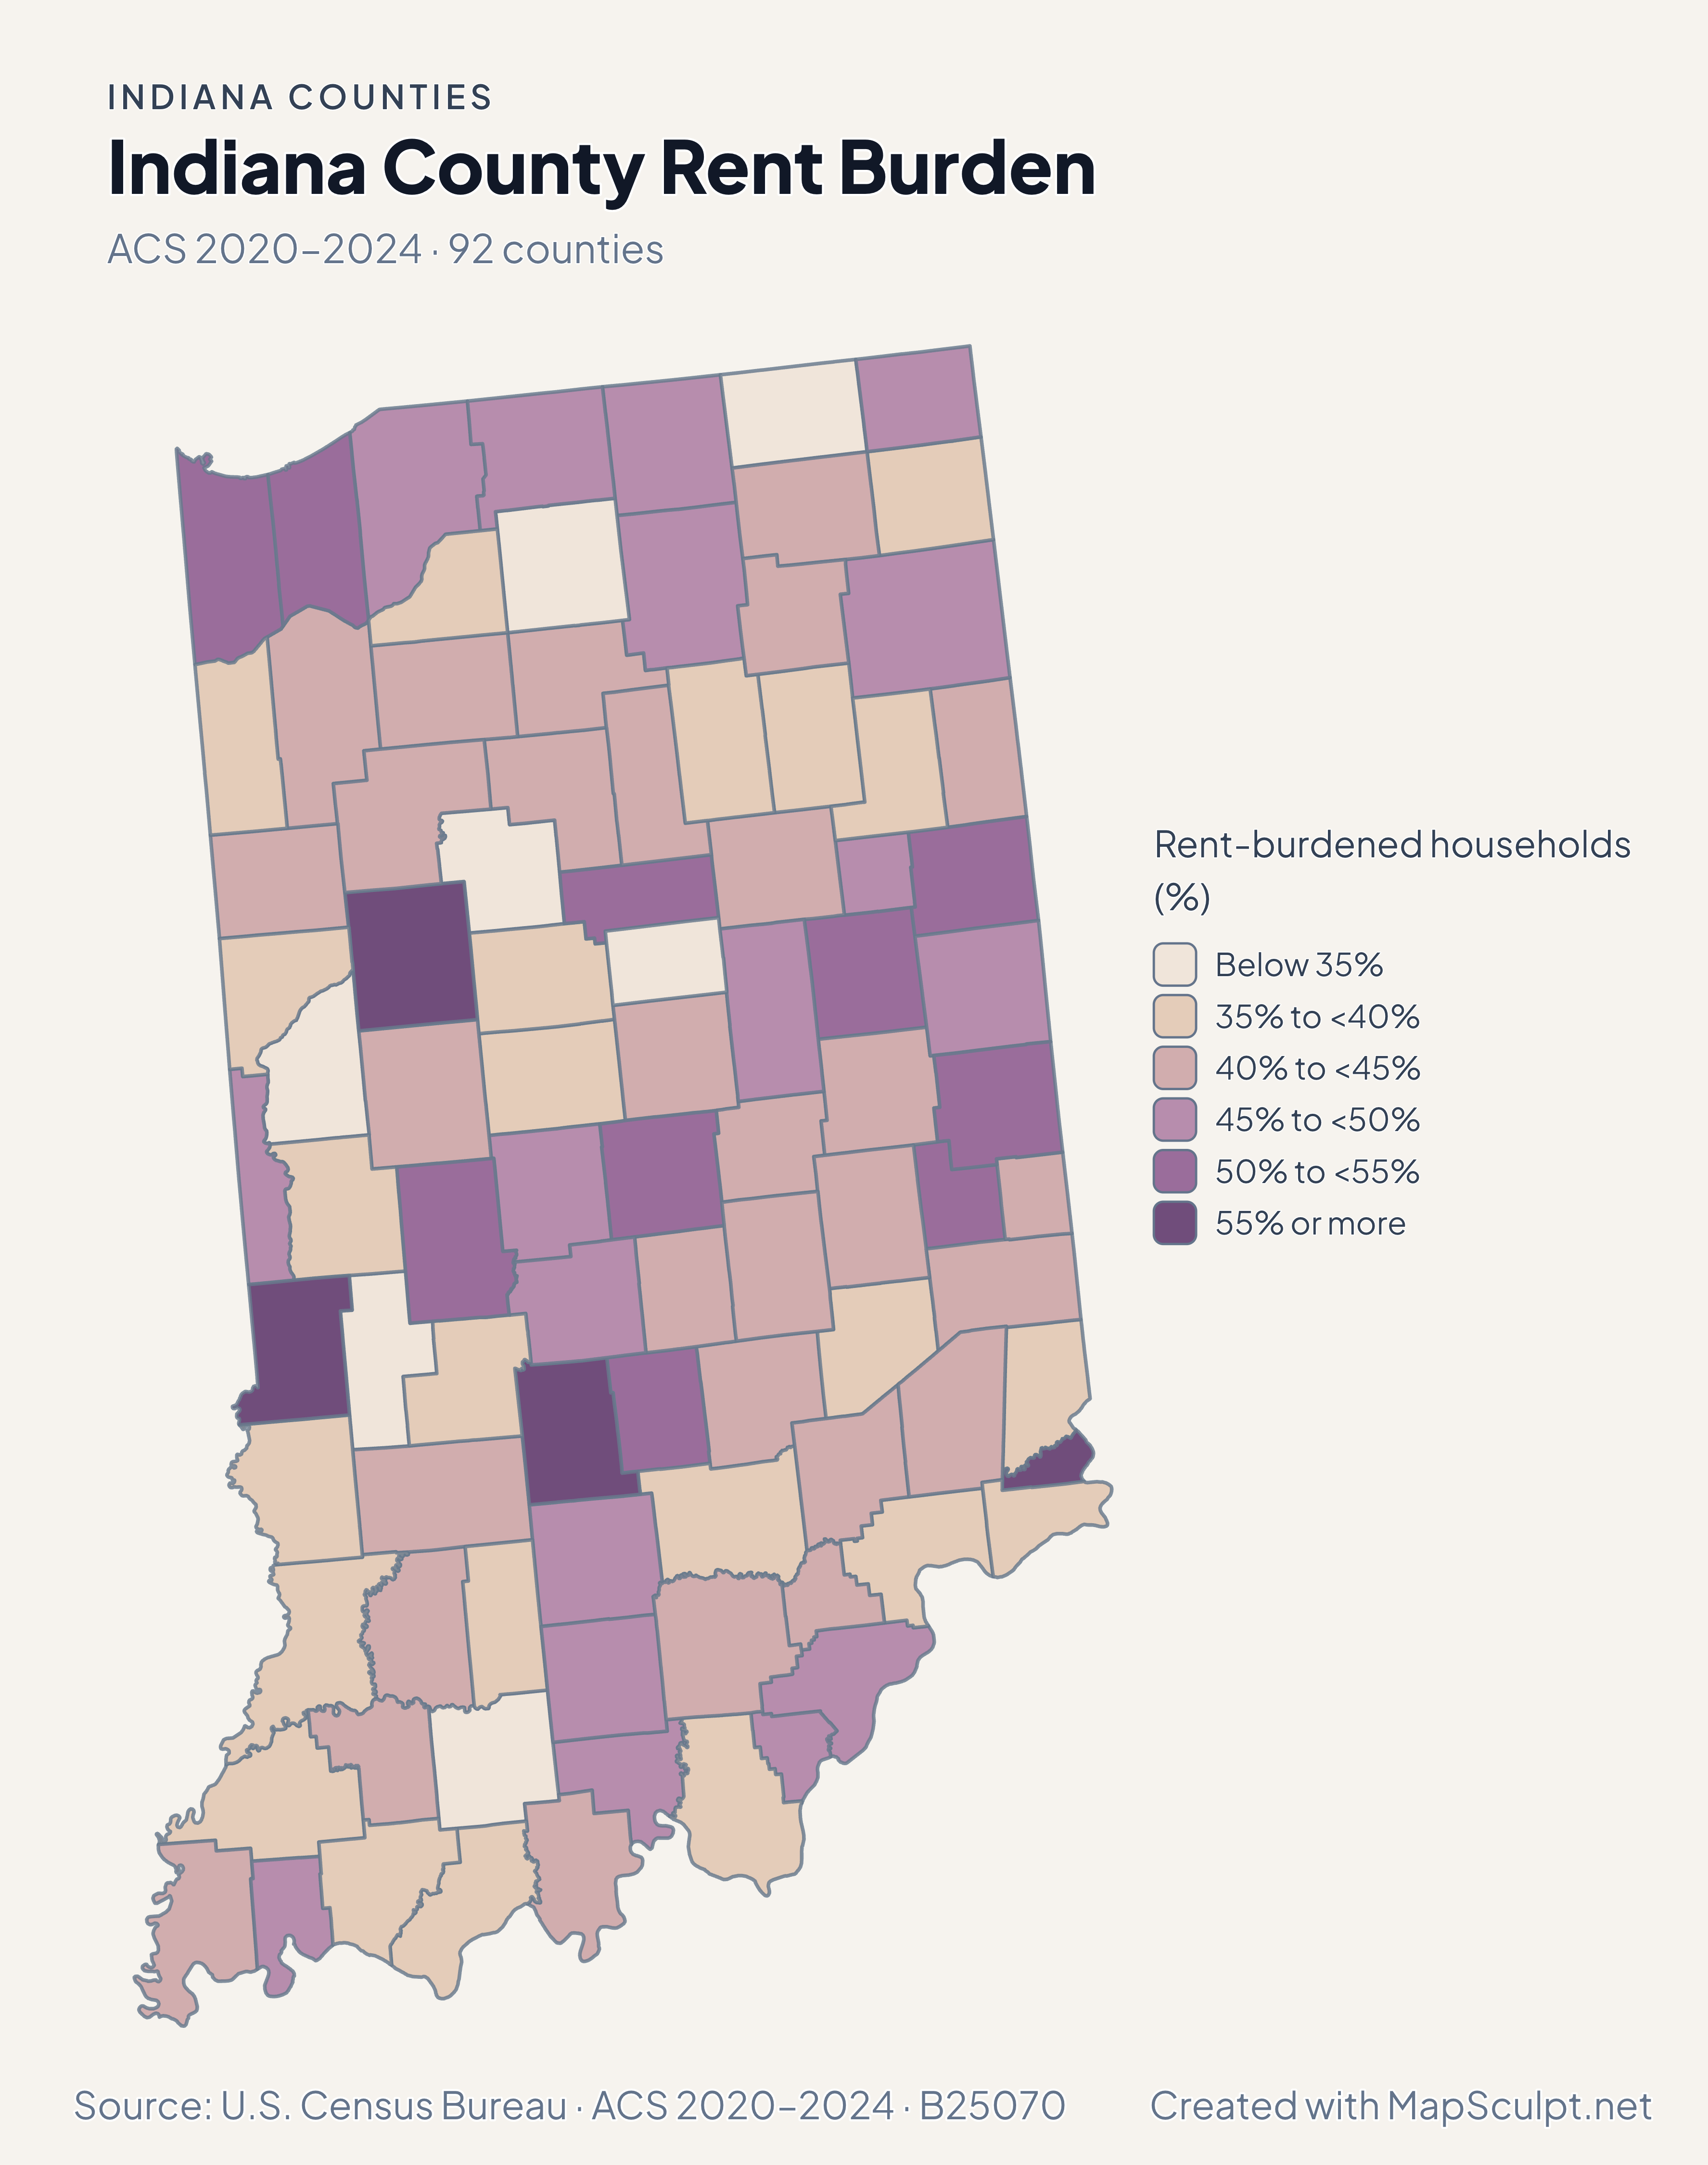
Compare growth around Indianapolis with the rest of Indiana, then map how domestic moves, incomes and rental costs vary across the same 92 counties.

Free online editor · No sign-up required

92counties
individually editable

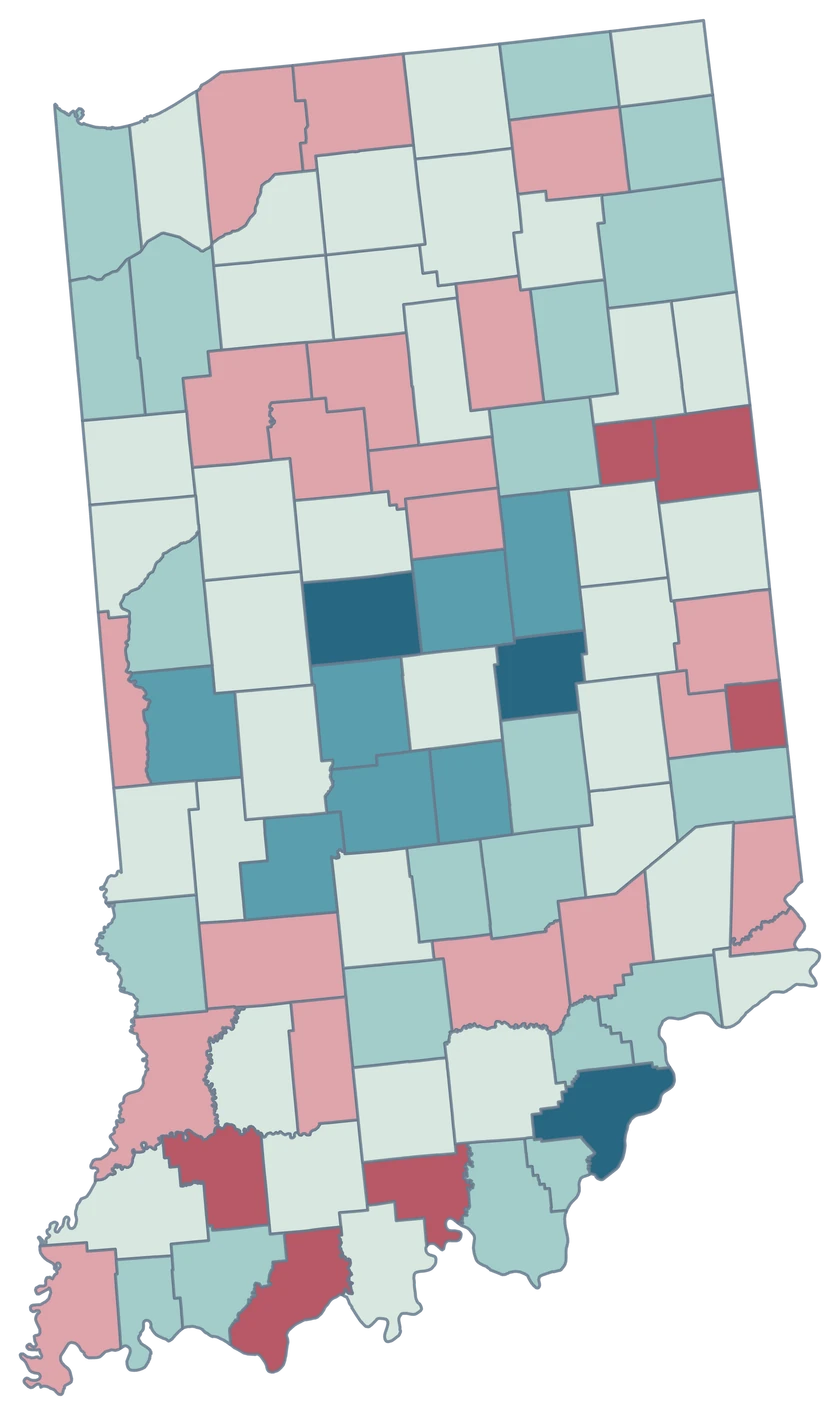
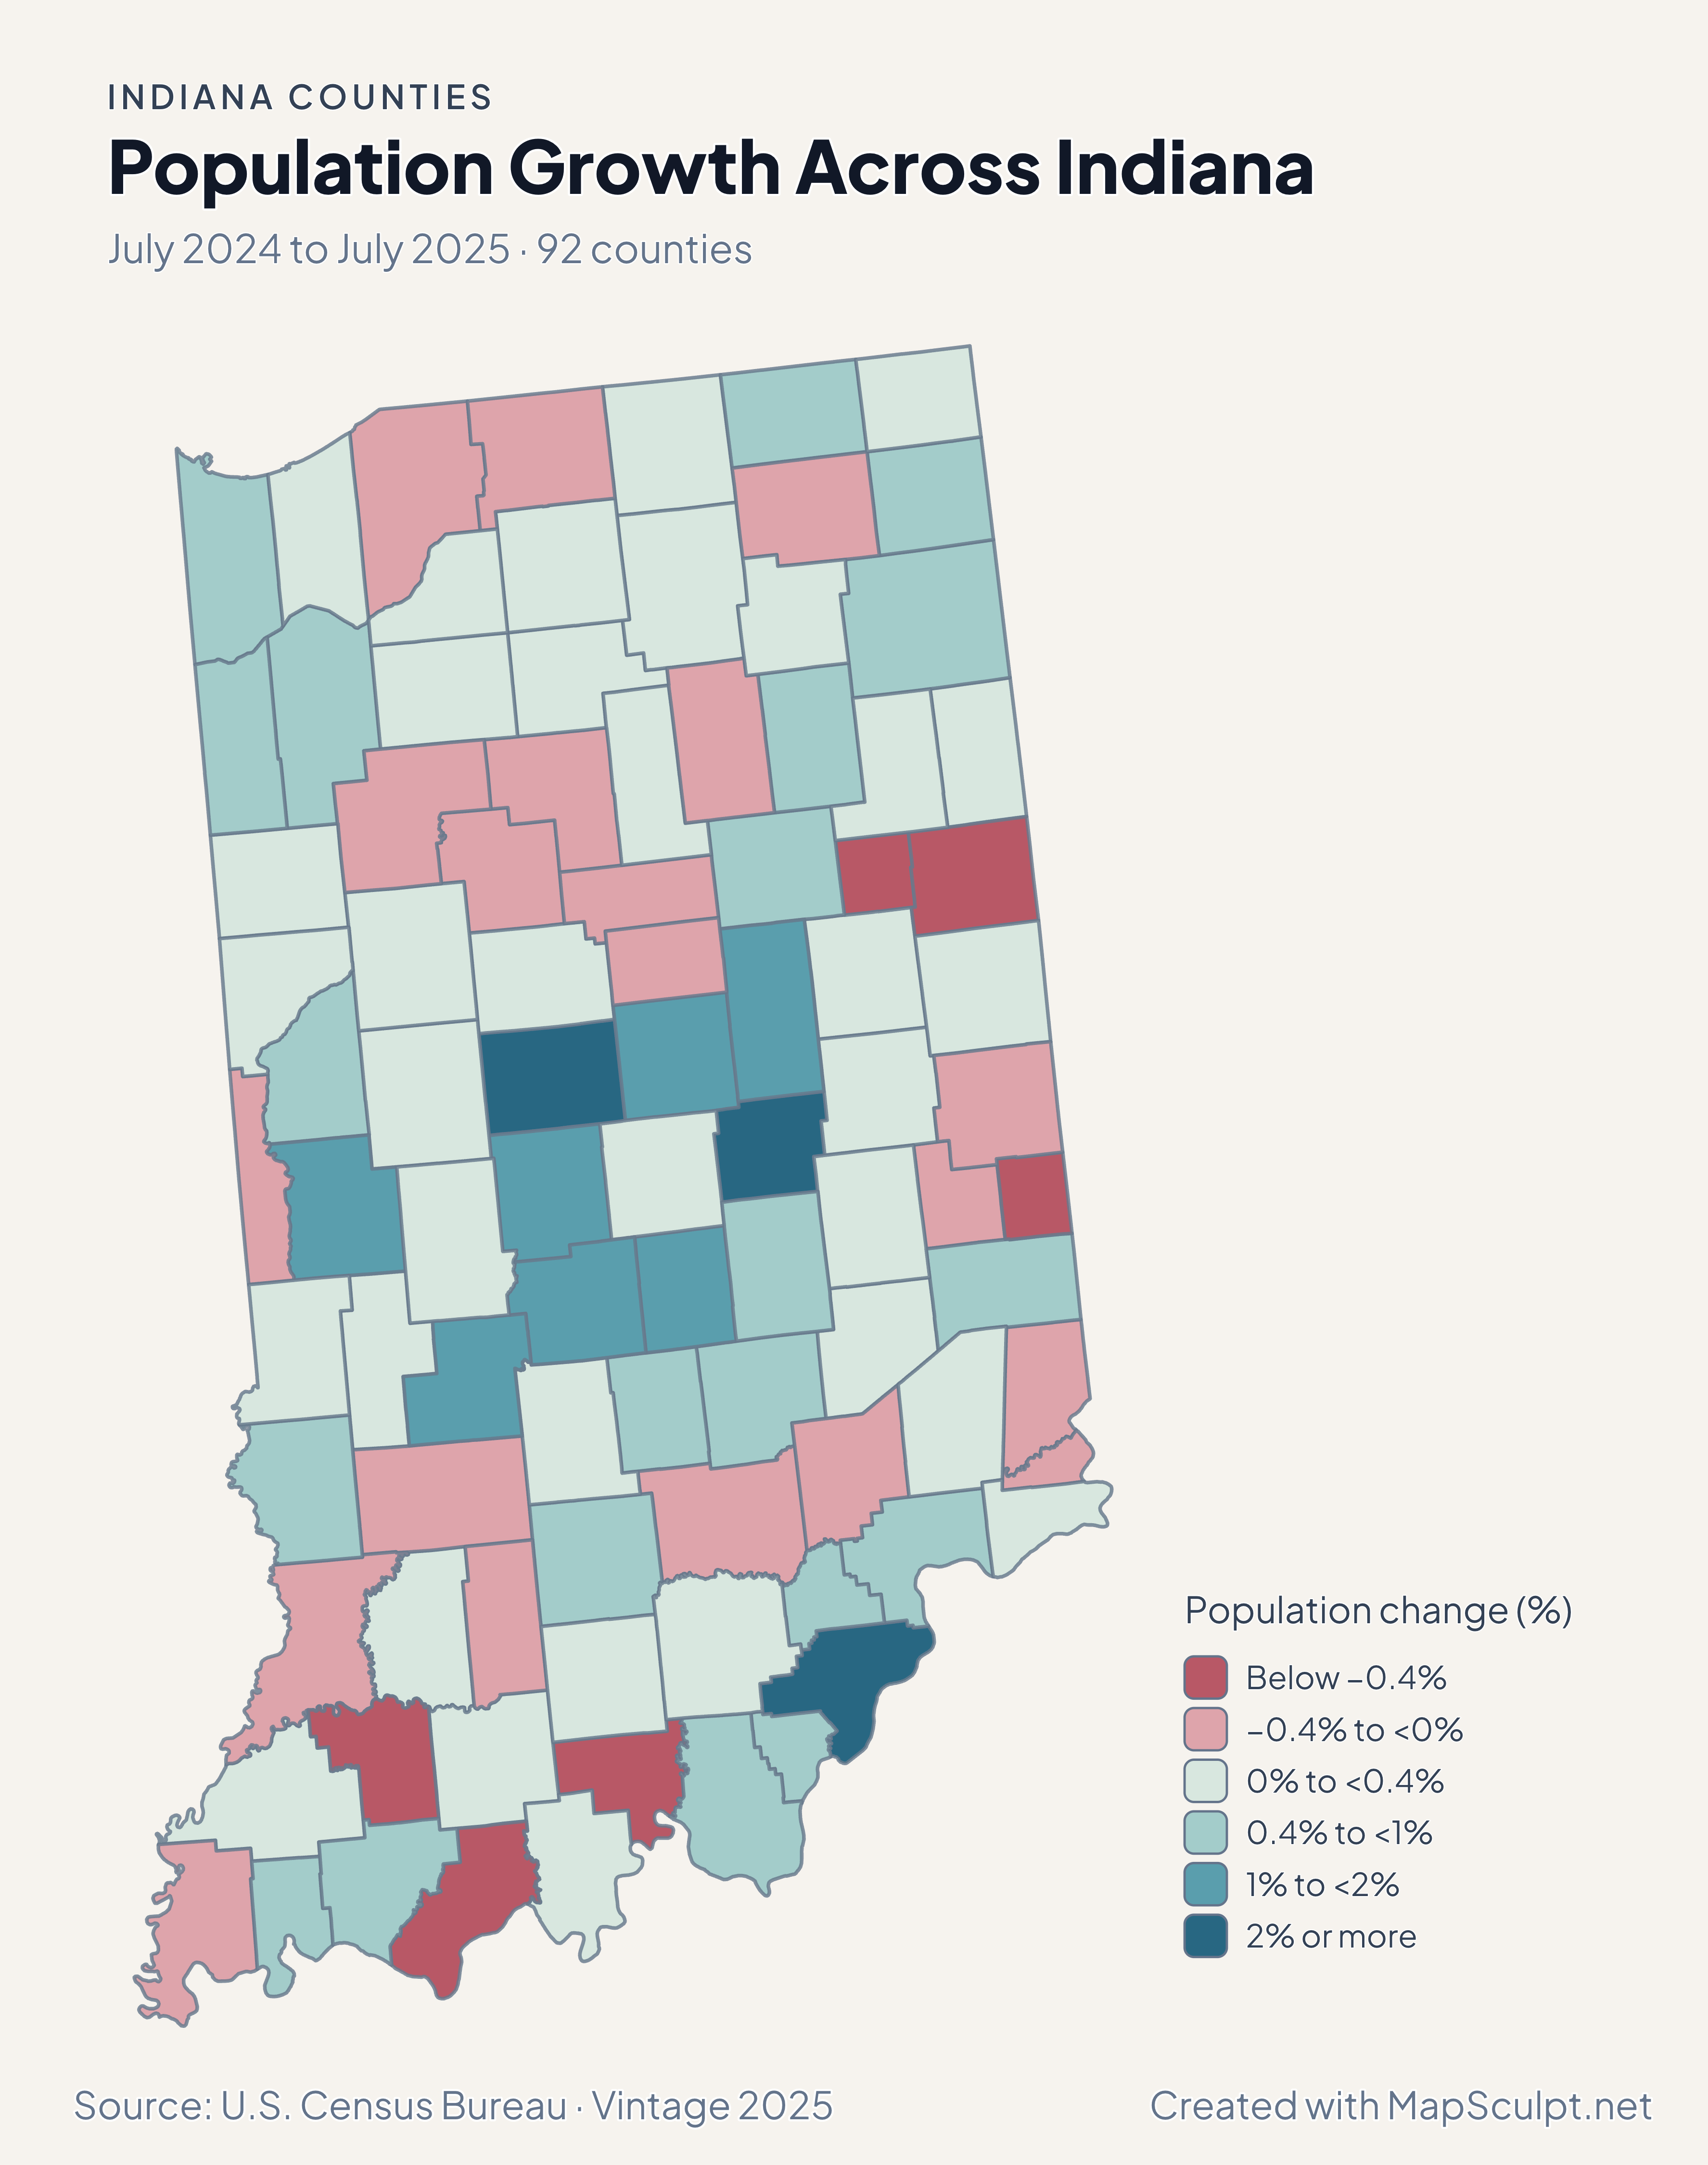
Population Growth Across Indiana

July 2024 to July 2025 · 92 counties

Indiana population map with Boone and Hancock in the highest growth band and Marion in a lower band.

Population change (%)

  • Below −0.4%
  • −0.4% to <0%
  • 0% to <0.4%
  • 0.4% to <1%
  • 1% to <2%
  • 2% or more
U.S. Census Bureau · Vintage 2025Download complete PNG Change from each county-level unit’s own July 2024 population.

KNOW YOUR GEOGRAPHY

From Lake Michigan to the Ohio River

Indiana’s county map reaches from the Lake Michigan shore into the Wabash and Ohio River valleys. Marion, Boone and Hamilton are separate counties even when grouped in an Indianapolis-area study.

Use the full five-digit GEOID for county joins. Place names can be misleading: Ohio County is in Indiana, and Marion County’s boundaries differ from those of the consolidated city of Indianapolis.

Browse all county GEOIDs ↗

2025 Census boundaries

OFFICIAL DATA

The strongest gains include counties around Indianapolis.

Look at the counties around Indianapolis in the statewide context, then change measure without changing the map boundaries.

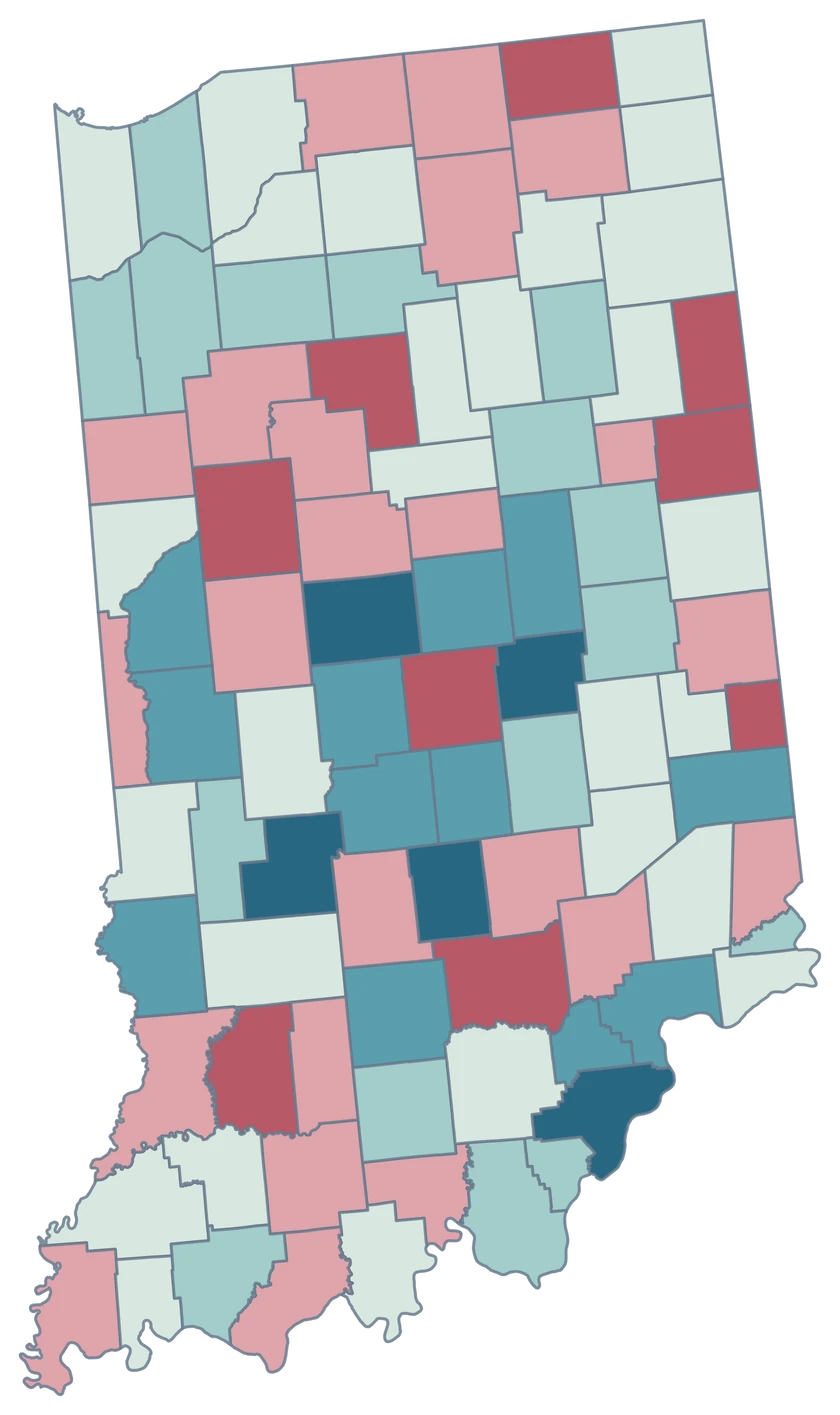
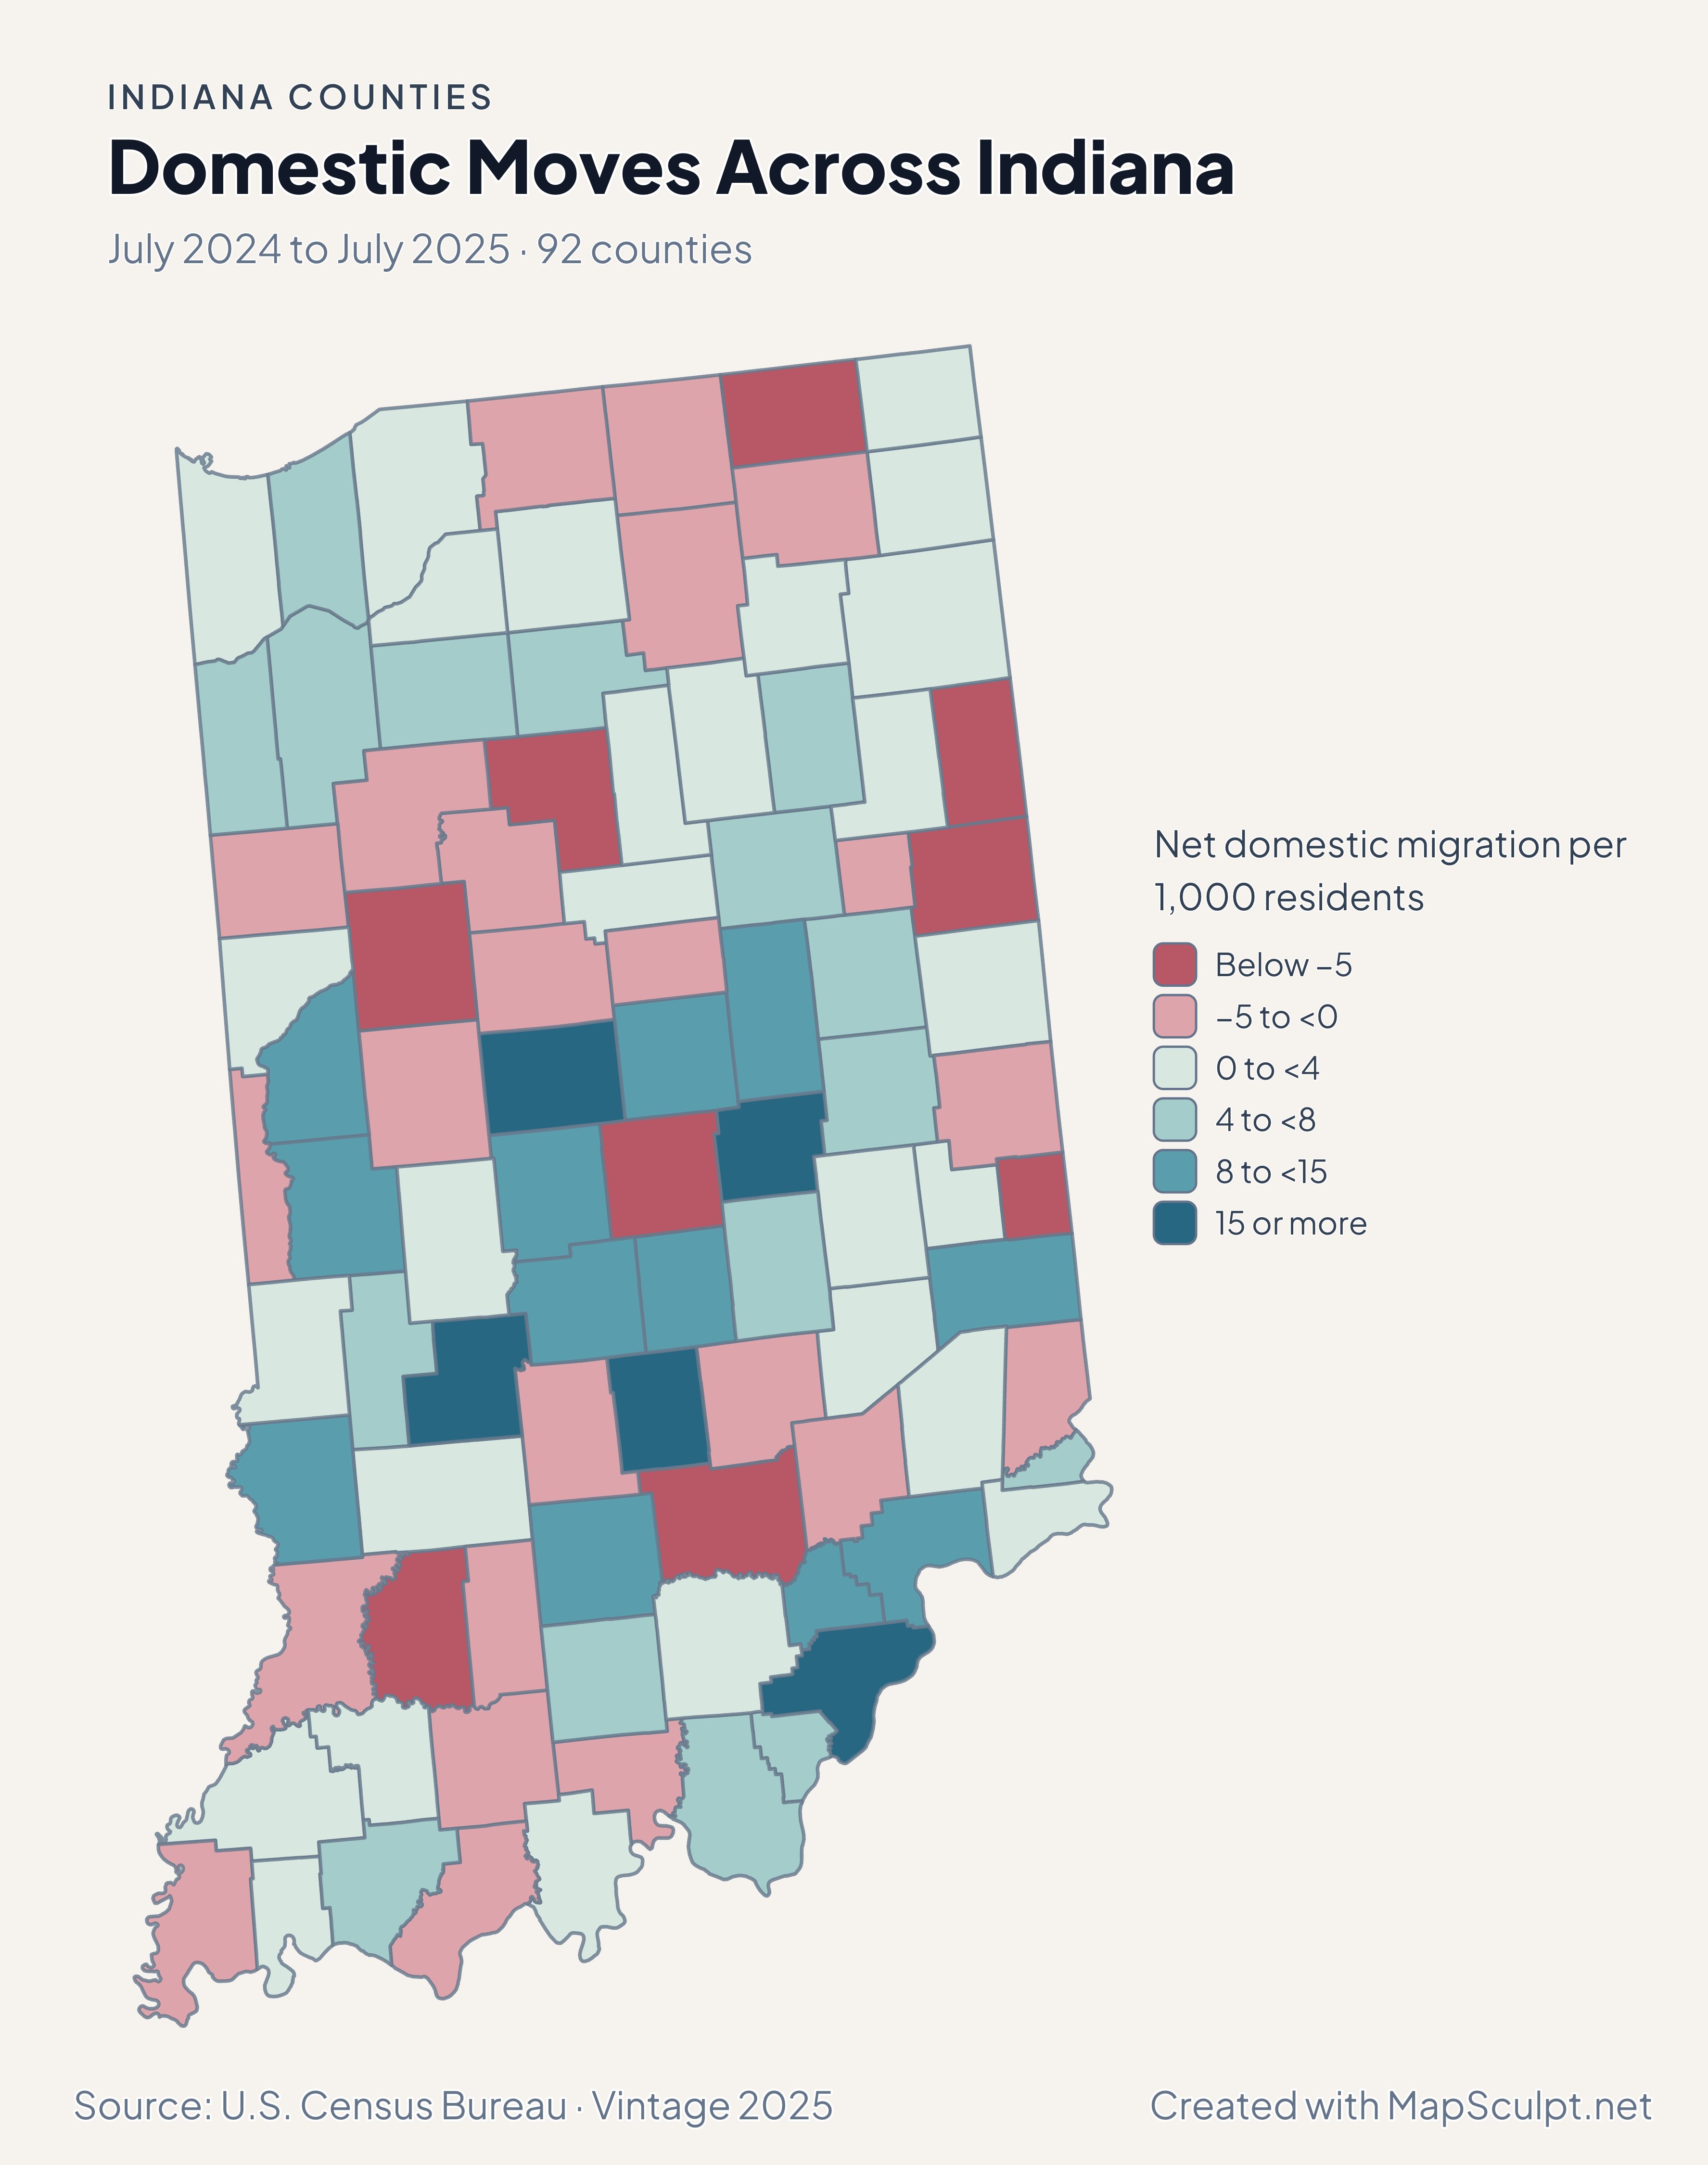
Indiana migration map highlighting Boone and Clark gains and Marion losses.

July 2024 to July 2025 · 92 counties

Domestic moves sharpen the central Indiana contrast

Boone gained 23.06 net domestic movers per 1,000 residents, while Marion recorded −10.75. Clark, on the Ohio River, recorded 20.53.

Net domestic migration per 1,000 residents

  • Below −5
  • −5 to <0
  • 0 to <4
  • 4 to <8
  • 8 to <15
  • 15 or more

U.S. Census Bureau · Vintage 2025

Download complete PNG

Boone had the largest percentage gain at 2.61%. Hancock gained 2.35% and Hamilton 1.94%, compared with 0.20% in Marion. See the Census estimates ↗

MAKE IT YOURS

From county data to a finished map.

  1. Open the Indiana editor

    Start with all 92 counties.

  2. Match your data by GEOID

    Keep GEOIDs as text. The example uses Marion County, 18097, and five other official county-level records.

  3. Explain what the colors measure

    Set class breaks, add the reference period, and include a legend and source.

  4. Download the complete map

    Check small features and labels, then export the finished high-resolution PNG.

TRY CSV IMPORT

Practice joining six official GEOIDs.

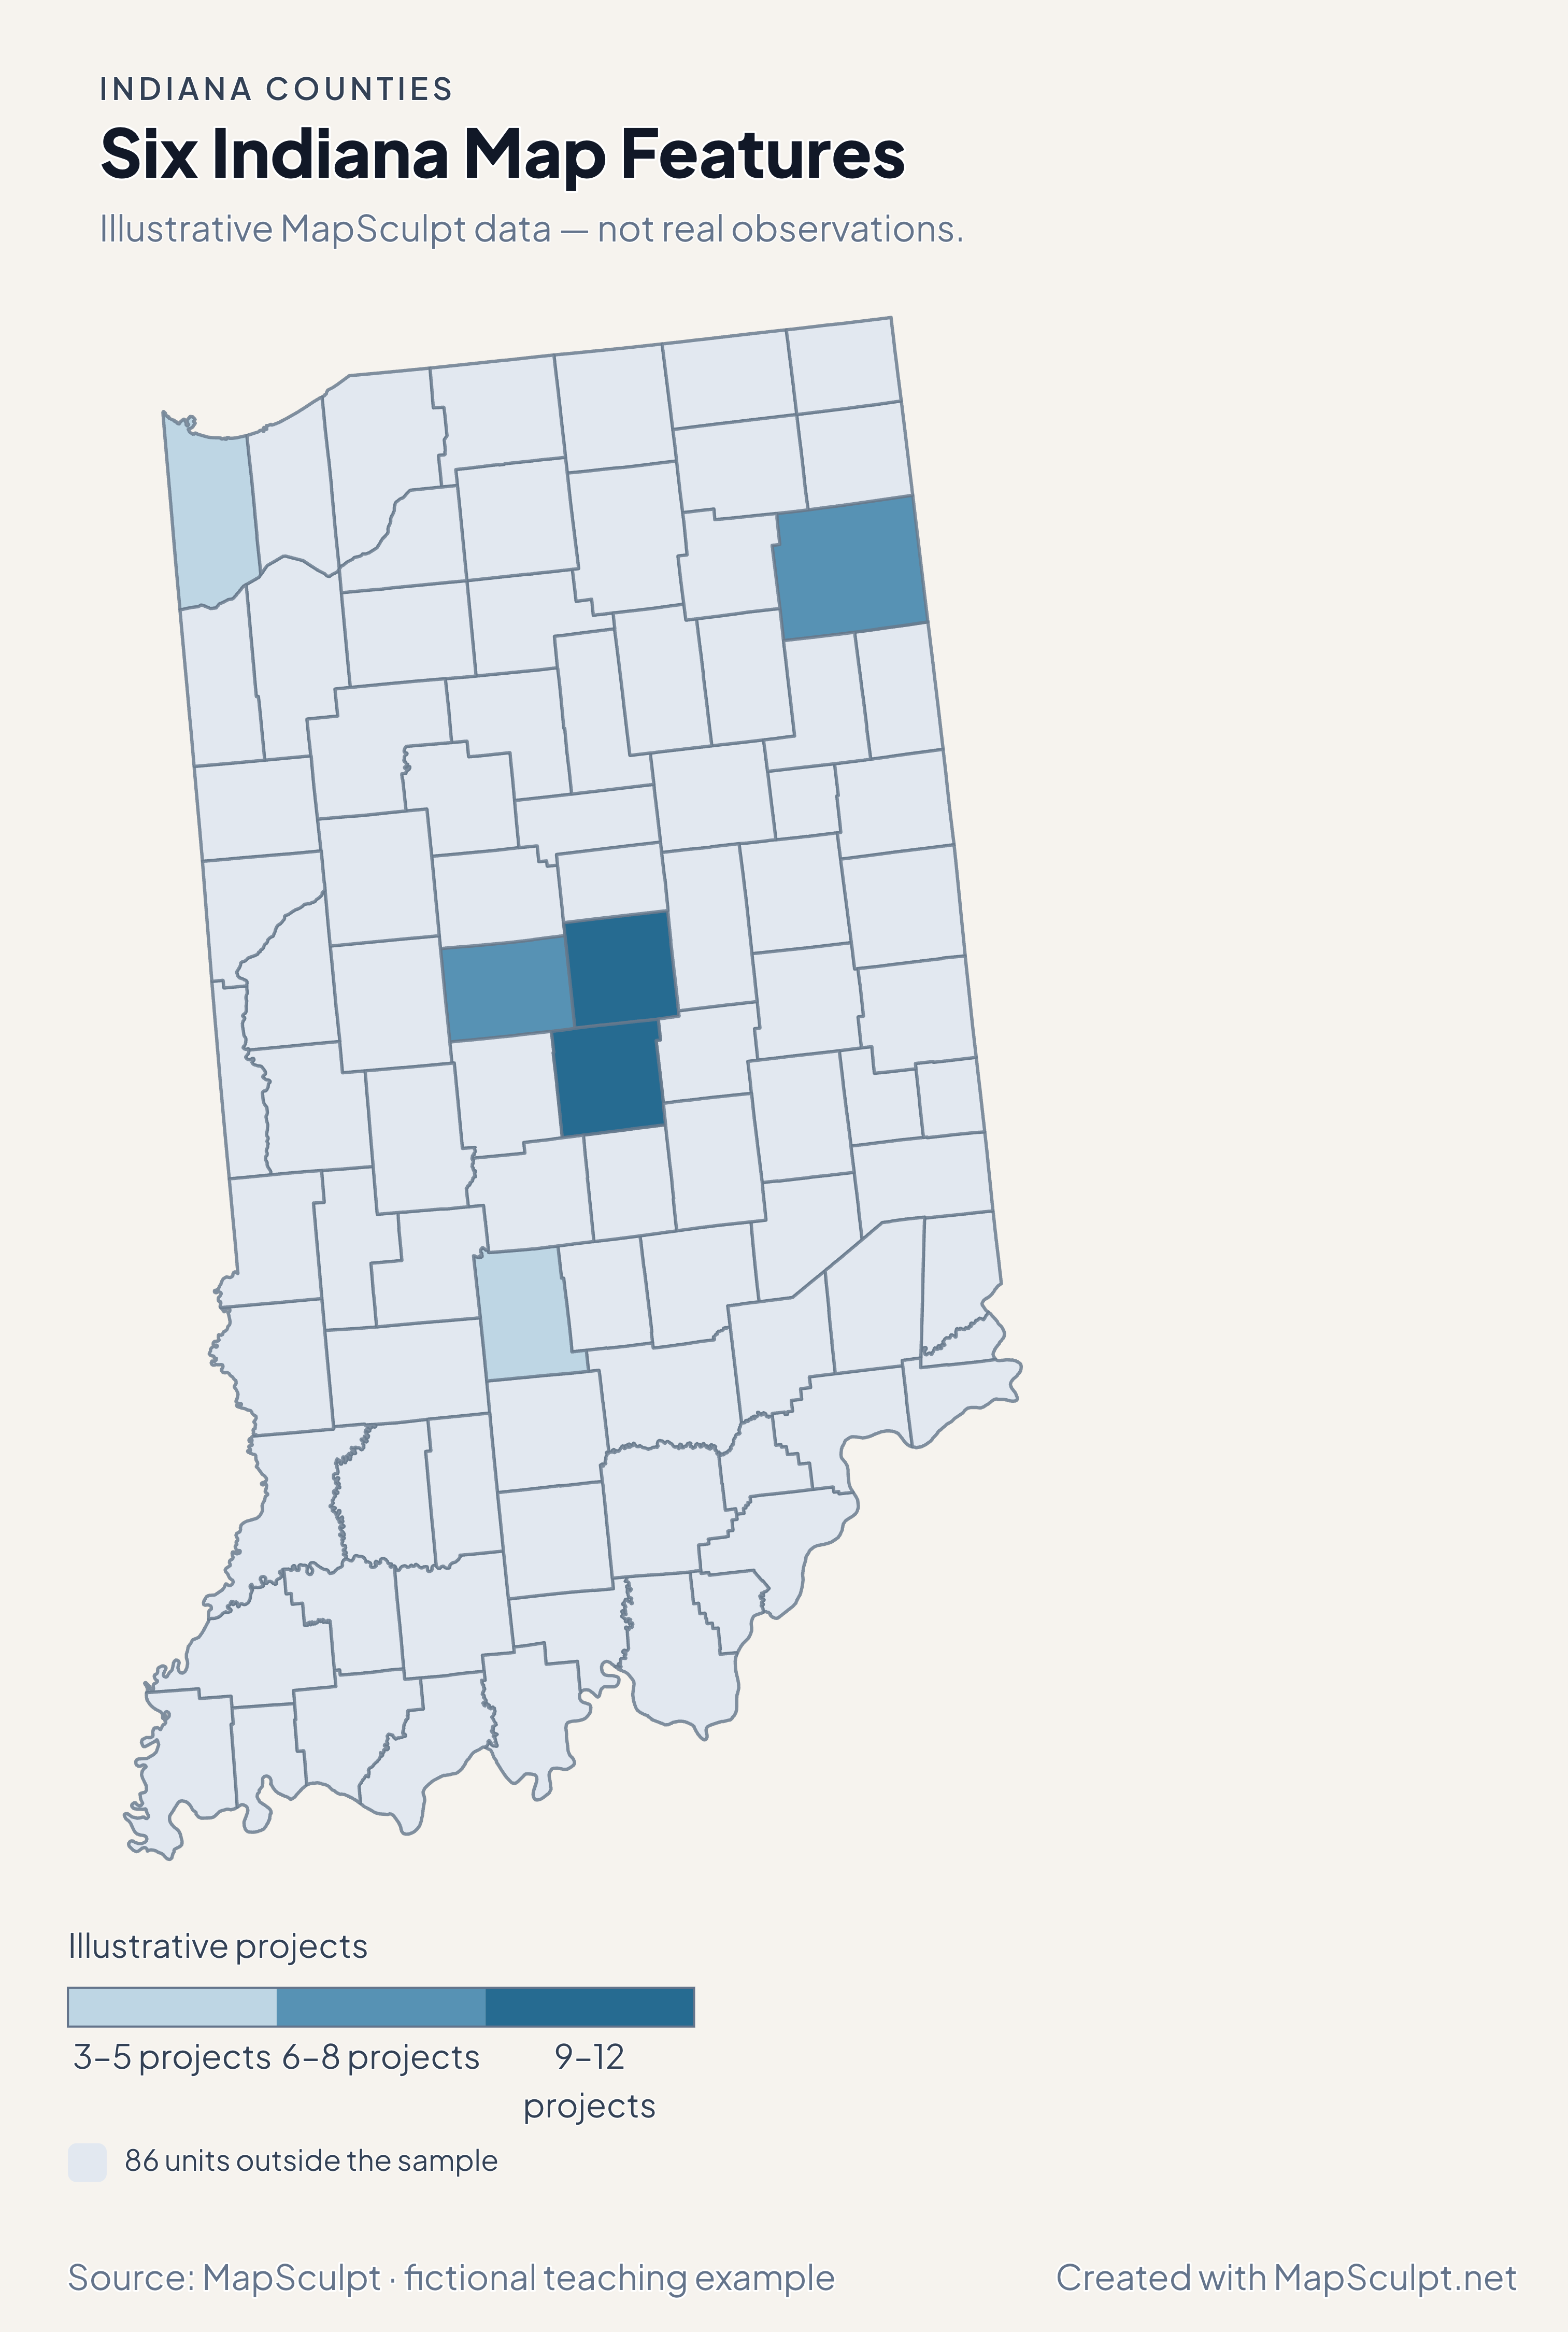
Import the fictional project counts and choose numeric boundaries of 3, 6, 9 and 12. The other 86 counties use a neutral fill.

Illustrative MapSculpt data — not real observations.
CountyGEOIDProjects
Marion County1809712
Boone County180116
Hamilton County180579
Lake County180893
Allen County180037
Monroe County181055

Keep GEOIDs as text. The example uses Marion County, 18097, and five other official county-level records.

Download illustrative CSV ↓

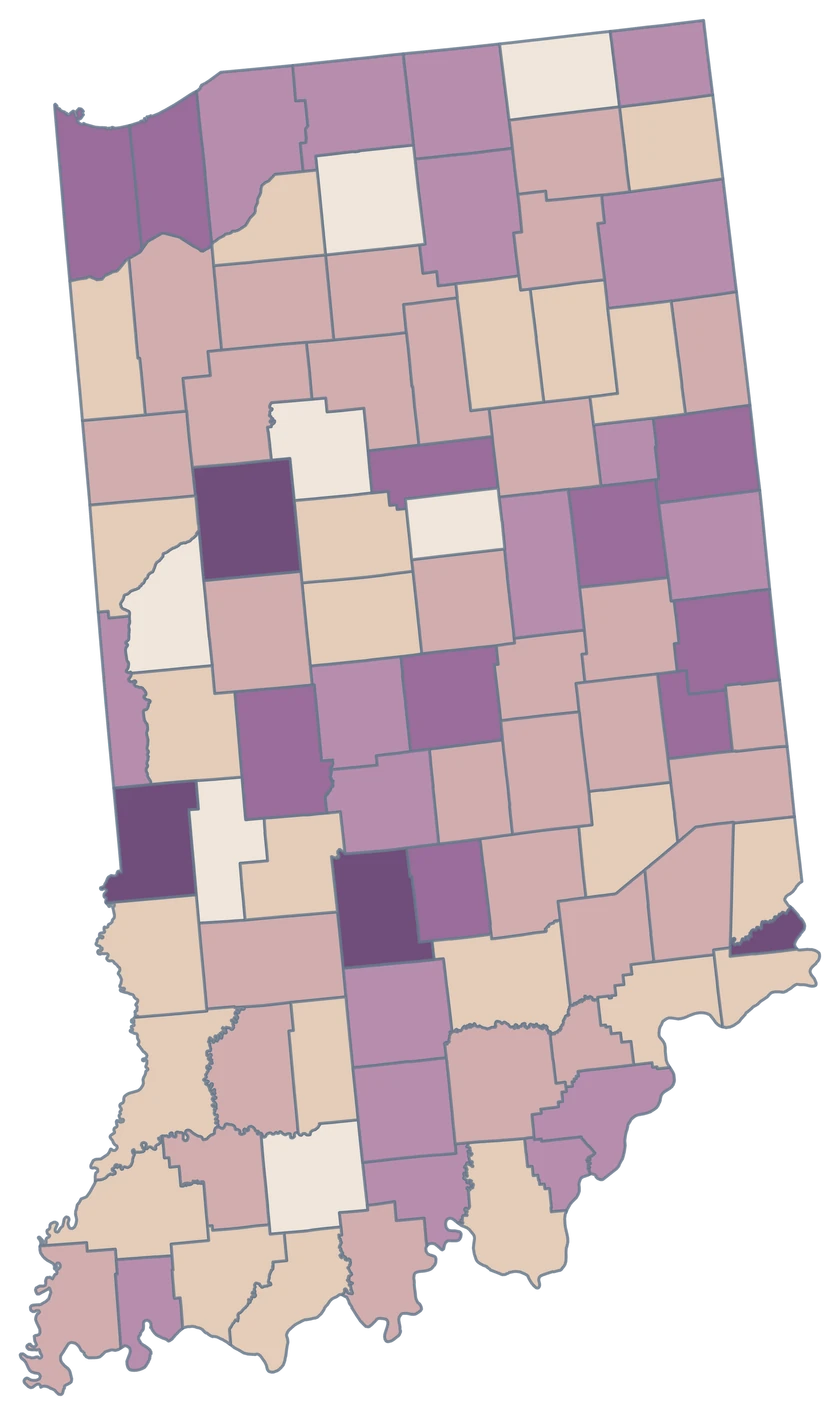
Six Indiana Map Features

Illustrative MapSculpt data — not real observations.

Illustrative Indiana project map identifying six features and leaving 86 neutral.

Illustrative projects

  • 3–5 projects
  • 6–8 projects
  • 9–12 projects
  • 86 units outside the sample
Download complete PNG

CSV → Match 6 counties → Style → Export PNG Create an Indiana map

COUNTY REFERENCE

Find all 92 Indiana counties and GEOIDs.

Official county names and five-digit Census GEOIDs. Search by name or code.

  1. Adams CountyGEOID 18001
  2. Allen CountyGEOID 18003
  3. Bartholomew CountyGEOID 18005
  4. Benton CountyGEOID 18007
  5. Blackford CountyGEOID 18009
  6. Boone CountyGEOID 18011
  7. Brown CountyGEOID 18013
  8. Carroll CountyGEOID 18015
  9. Cass CountyGEOID 18017
  10. Clark CountyGEOID 18019
  11. Clay CountyGEOID 18021
  12. Clinton CountyGEOID 18023
  13. Crawford CountyGEOID 18025
  14. Daviess CountyGEOID 18027
  15. Dearborn CountyGEOID 18029
  16. Decatur CountyGEOID 18031
  17. DeKalb CountyGEOID 18033
  18. Delaware CountyGEOID 18035
  19. Dubois CountyGEOID 18037
  20. Elkhart CountyGEOID 18039
  21. Fayette CountyGEOID 18041
  22. Floyd CountyGEOID 18043
  23. Fountain CountyGEOID 18045
  24. Franklin CountyGEOID 18047
  25. Fulton CountyGEOID 18049
  26. Gibson CountyGEOID 18051
  27. Grant CountyGEOID 18053
  28. Greene CountyGEOID 18055
  29. Hamilton CountyGEOID 18057
  30. Hancock CountyGEOID 18059
  31. Harrison CountyGEOID 18061
  32. Hendricks CountyGEOID 18063
  33. Henry CountyGEOID 18065
  34. Howard CountyGEOID 18067
  35. Huntington CountyGEOID 18069
  36. Jackson CountyGEOID 18071
  37. Jasper CountyGEOID 18073
  38. Jay CountyGEOID 18075
  39. Jefferson CountyGEOID 18077
  40. Jennings CountyGEOID 18079
  41. Johnson CountyGEOID 18081
  42. Knox CountyGEOID 18083
  43. Kosciusko CountyGEOID 18085
  44. LaGrange CountyGEOID 18087
  45. Lake CountyGEOID 18089
  46. LaPorte CountyGEOID 18091
  47. Lawrence CountyGEOID 18093
  48. Madison CountyGEOID 18095
  49. Marion CountyGEOID 18097
  50. Marshall CountyGEOID 18099
  51. Martin CountyGEOID 18101
  52. Miami CountyGEOID 18103
  53. Monroe CountyGEOID 18105
  54. Montgomery CountyGEOID 18107
  55. Morgan CountyGEOID 18109
  56. Newton CountyGEOID 18111
  57. Noble CountyGEOID 18113
  58. Ohio CountyGEOID 18115
  59. Orange CountyGEOID 18117
  60. Owen CountyGEOID 18119
  61. Parke CountyGEOID 18121
  62. Perry CountyGEOID 18123
  63. Pike CountyGEOID 18125
  64. Porter CountyGEOID 18127
  65. Posey CountyGEOID 18129
  66. Pulaski CountyGEOID 18131
  67. Putnam CountyGEOID 18133
  68. Randolph CountyGEOID 18135
  69. Ripley CountyGEOID 18137
  70. Rush CountyGEOID 18139
  71. Scott CountyGEOID 18143
  72. Shelby CountyGEOID 18145
  73. Spencer CountyGEOID 18147
  74. St. Joseph CountyGEOID 18141
  75. Starke CountyGEOID 18149
  76. Steuben CountyGEOID 18151
  77. Sullivan CountyGEOID 18153
  78. Switzerland CountyGEOID 18155
  79. Tippecanoe CountyGEOID 18157
  80. Tipton CountyGEOID 18159
  81. Union CountyGEOID 18161
  82. Vanderburgh CountyGEOID 18163
  83. Vermillion CountyGEOID 18165
  84. Vigo CountyGEOID 18167
  85. Wabash CountyGEOID 18169
  86. Warren CountyGEOID 18171
  87. Warrick CountyGEOID 18173
  88. Washington CountyGEOID 18175
  89. Wayne CountyGEOID 18177
  90. Wells CountyGEOID 18179
  91. White CountyGEOID 18181
  92. Whitley CountyGEOID 18183

U.S. Census Bureau · 2025 Cartographic Boundary Files

COMMON QUESTIONS

Indiana county map questions.

How do I map Indianapolis-area county estimates?

Select the counties covered by your data. Marion is 18097, Boone is 18011, and Hamilton is 18057.

Is Ohio County part of this Indiana map?

Yes. Indiana’s Ohio County is GEOID 18115. The state prefix 18 prevents confusion with counties in Ohio.

Where does Fort Wayne appear?

Fort Wayne is within Allen County. Use GEOID 18003 for whole-county observations.

Can I show the Indiana and Kentucky sides of the Ohio River?

Use the national county editor to include both states and join by the full GEOID.

Why did Marion grow despite domestic losses?

Total population change includes components beyond net moves within the country. The two PEP maps each isolate a different measure.

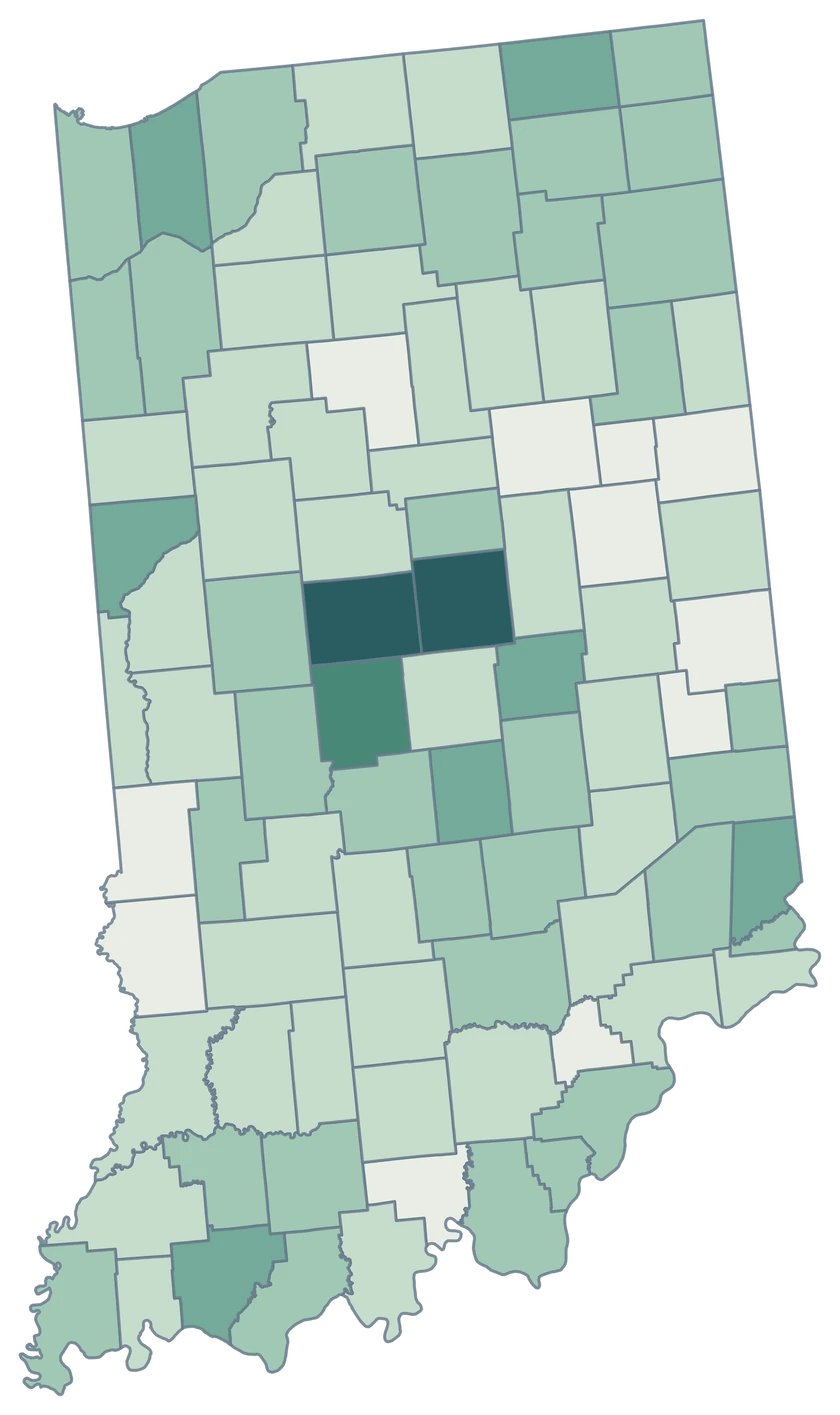
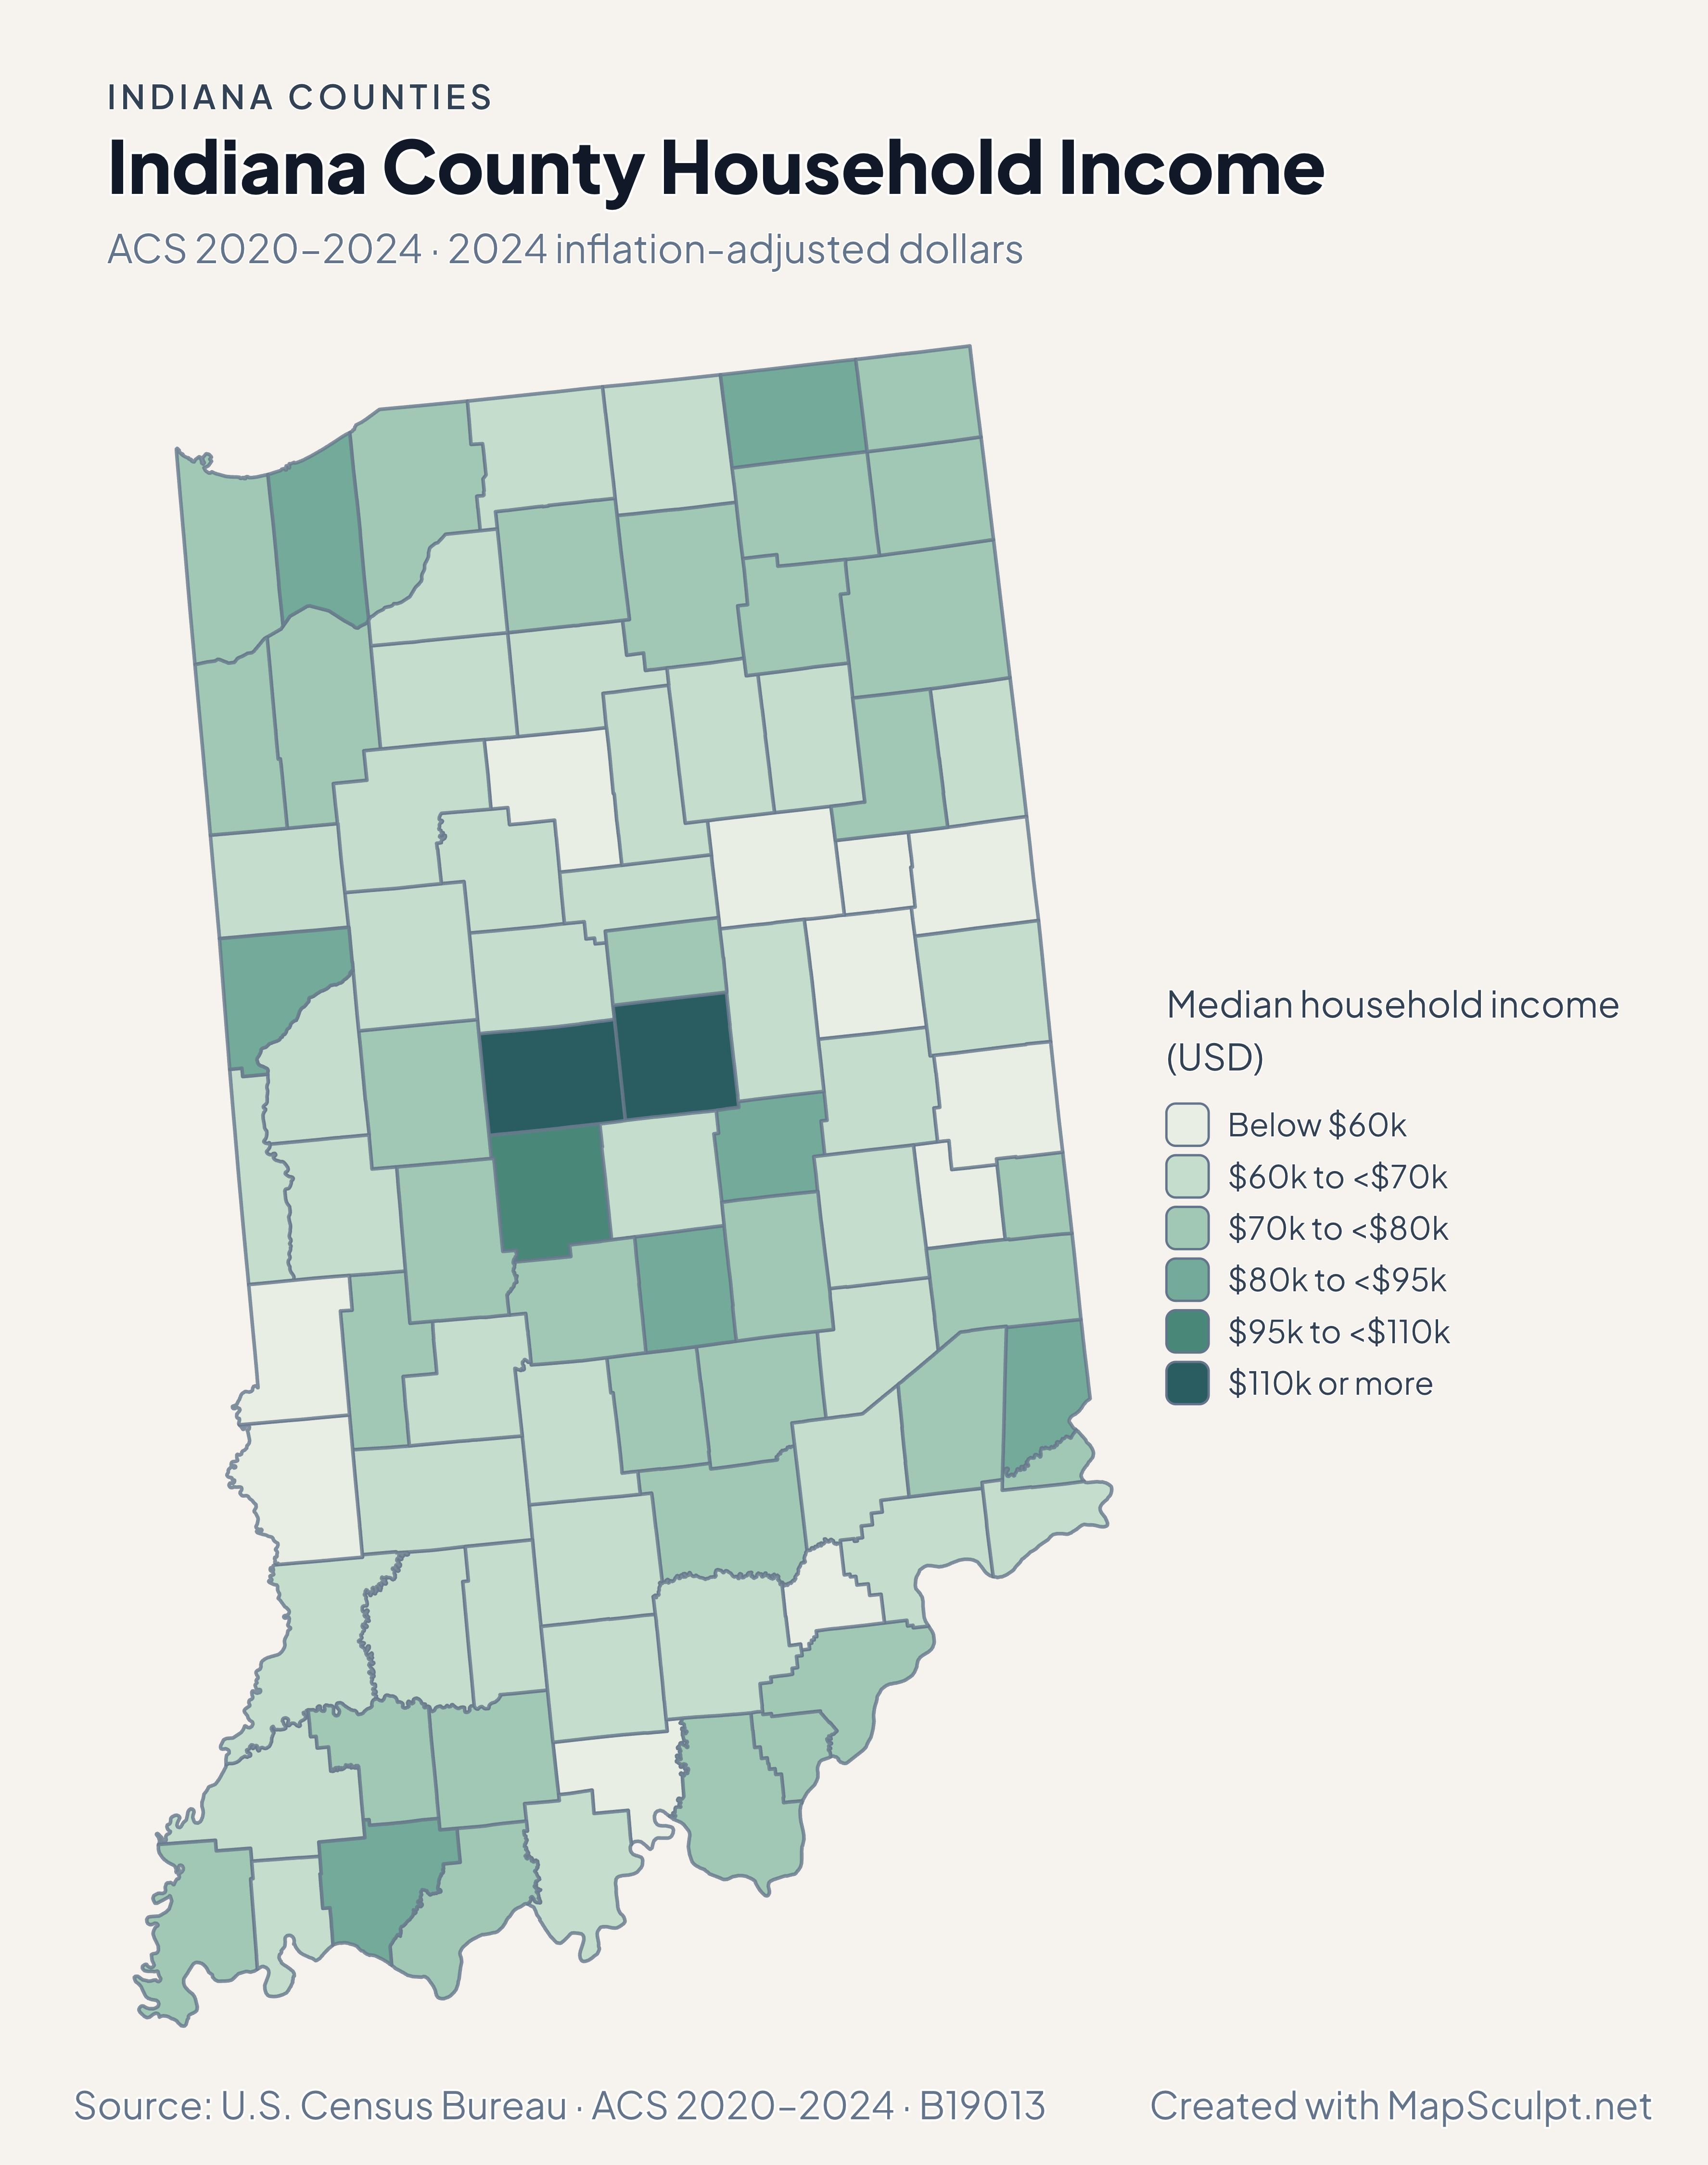
What do the income colors mean around Indianapolis?

They show classes of estimated county medians, with darker fills for higher dollar bands. They describe neither individual incomes nor city-only data.

YOUR NEXT MAP STARTS HERE

Make your own Indiana county comparison.

Join your data by GEOID or select features by hand, then export a PNG with a useful title and source.

Create an Indiana map