Skip to content
MapSculpt

GEOGRAPHIC MAP MAKER / NEW MEXICO

New Mexico
Counties Map Maker

Compare domestic moves in Bernalillo, Sandoval, Valencia and counties farther from Albuquerque. Then map your county records using New Mexico’s official Census identifiers.

Free online editor · No sign-up required

33counties
individually editable

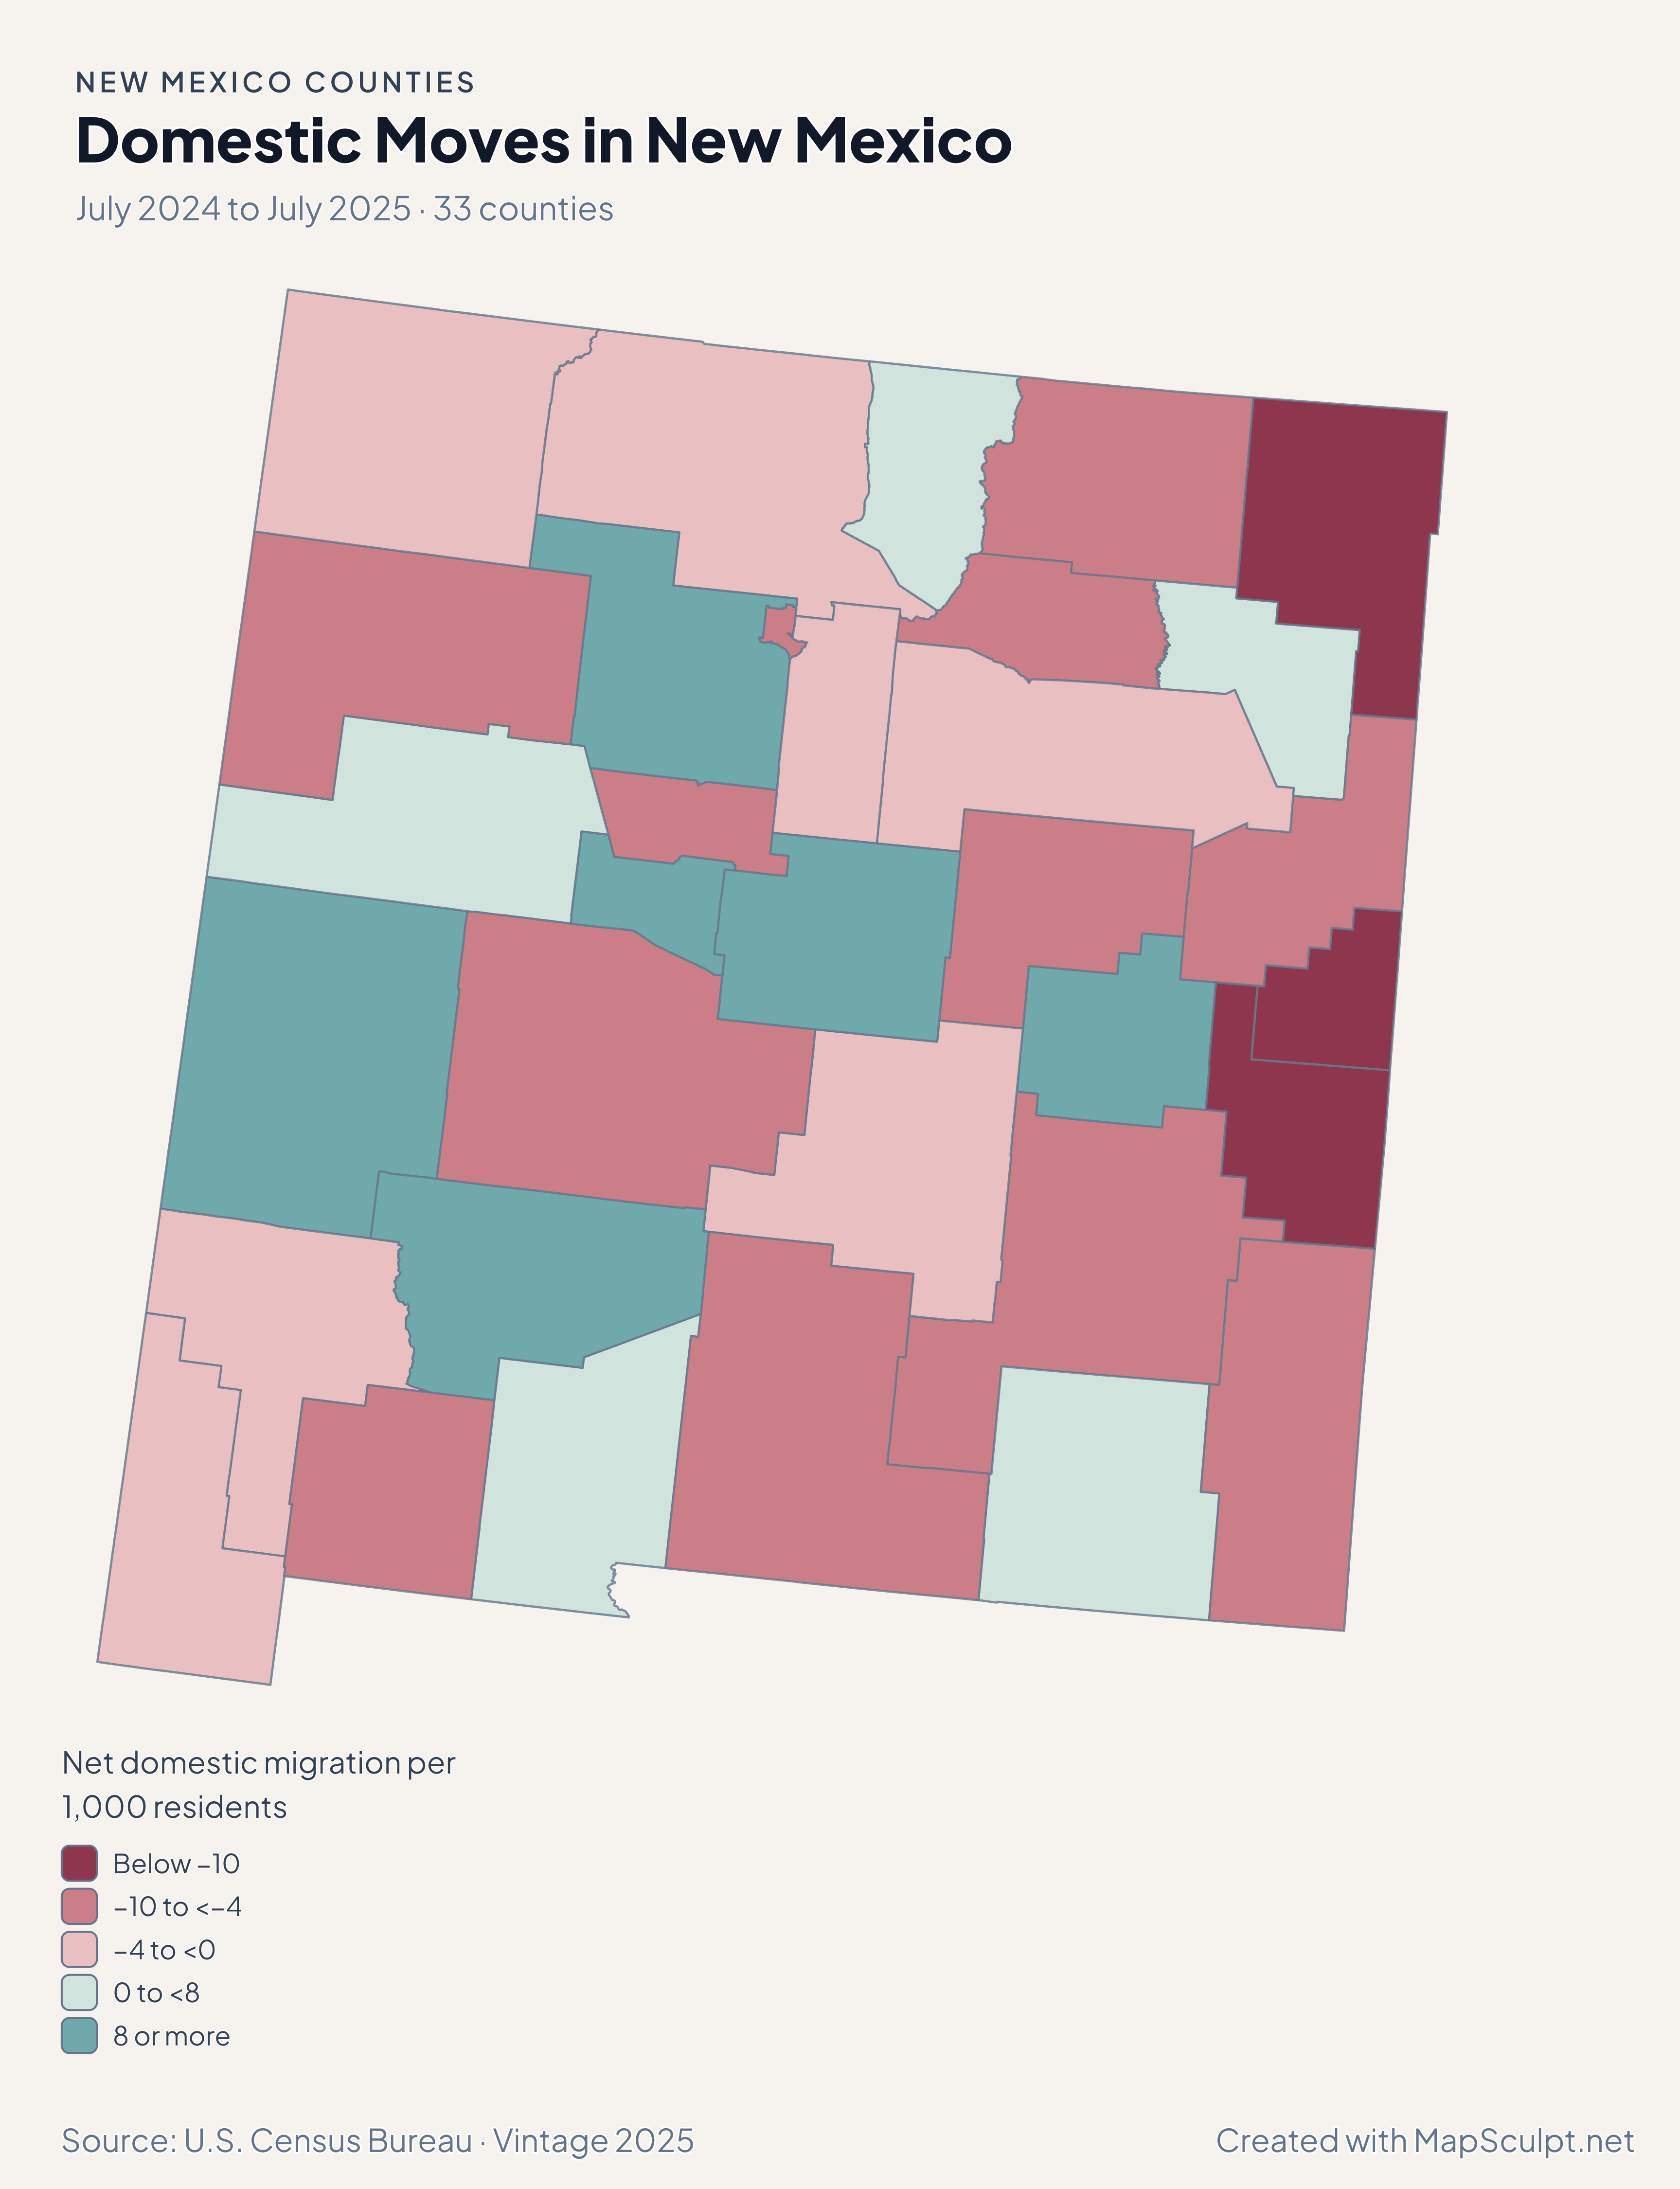
Domestic Moves in New Mexico

July 2024 to July 2025 · 33 counties

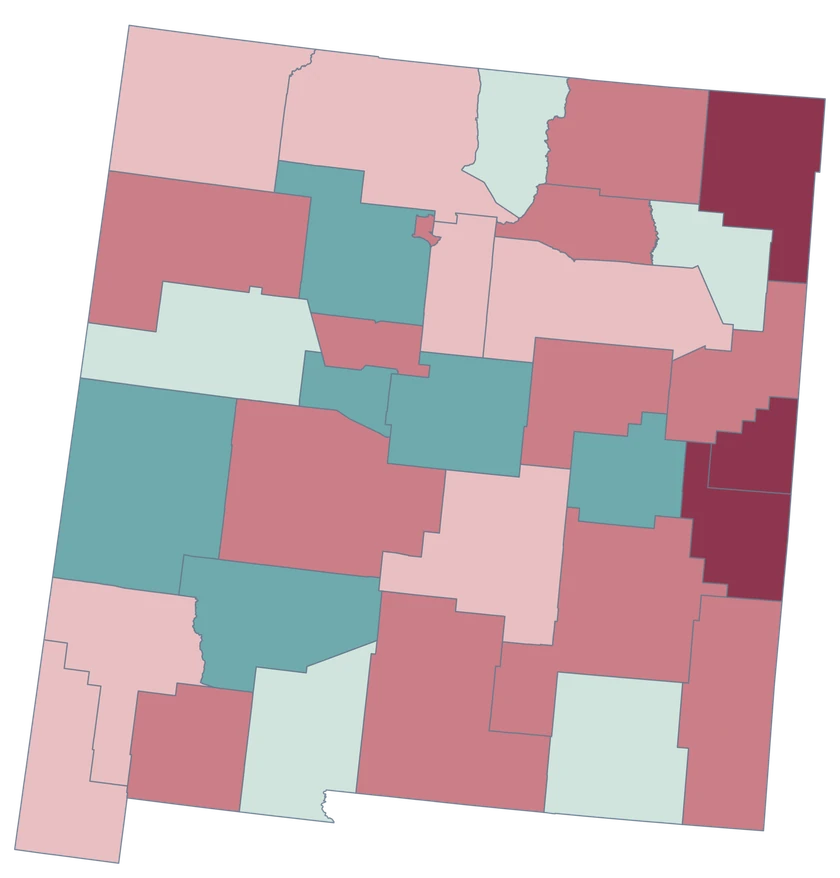
New Mexico county choropleth of domestic moves, including Bernalillo, Sandoval, Valencia, Doña Ana.

Net domestic migration per 1,000 residents

  • Below −10
  • −10 to <−4
  • −4 to <0
  • 0 to <8
  • 8 or more
U.S. Census Bureau · Vintage 2025Download complete PNG Net domestic moves within the United States are measured per 1,000 average residents.

KNOW YOUR GEOGRAPHY

New Mexico from the Four Corners to Doña Ana

This map shows New Mexico’s 33 counties, including Doña Ana along the southern border and Cibola west of the Albuquerque area.

County features follow generalized Census boundaries. Municipalities and Tribal lands have different boundaries. Use authoritative sources for those geographies.

Browse all county GEOIDs ↗

2025 Census boundaries

OFFICIAL DATA

Central seats of population and smaller counties

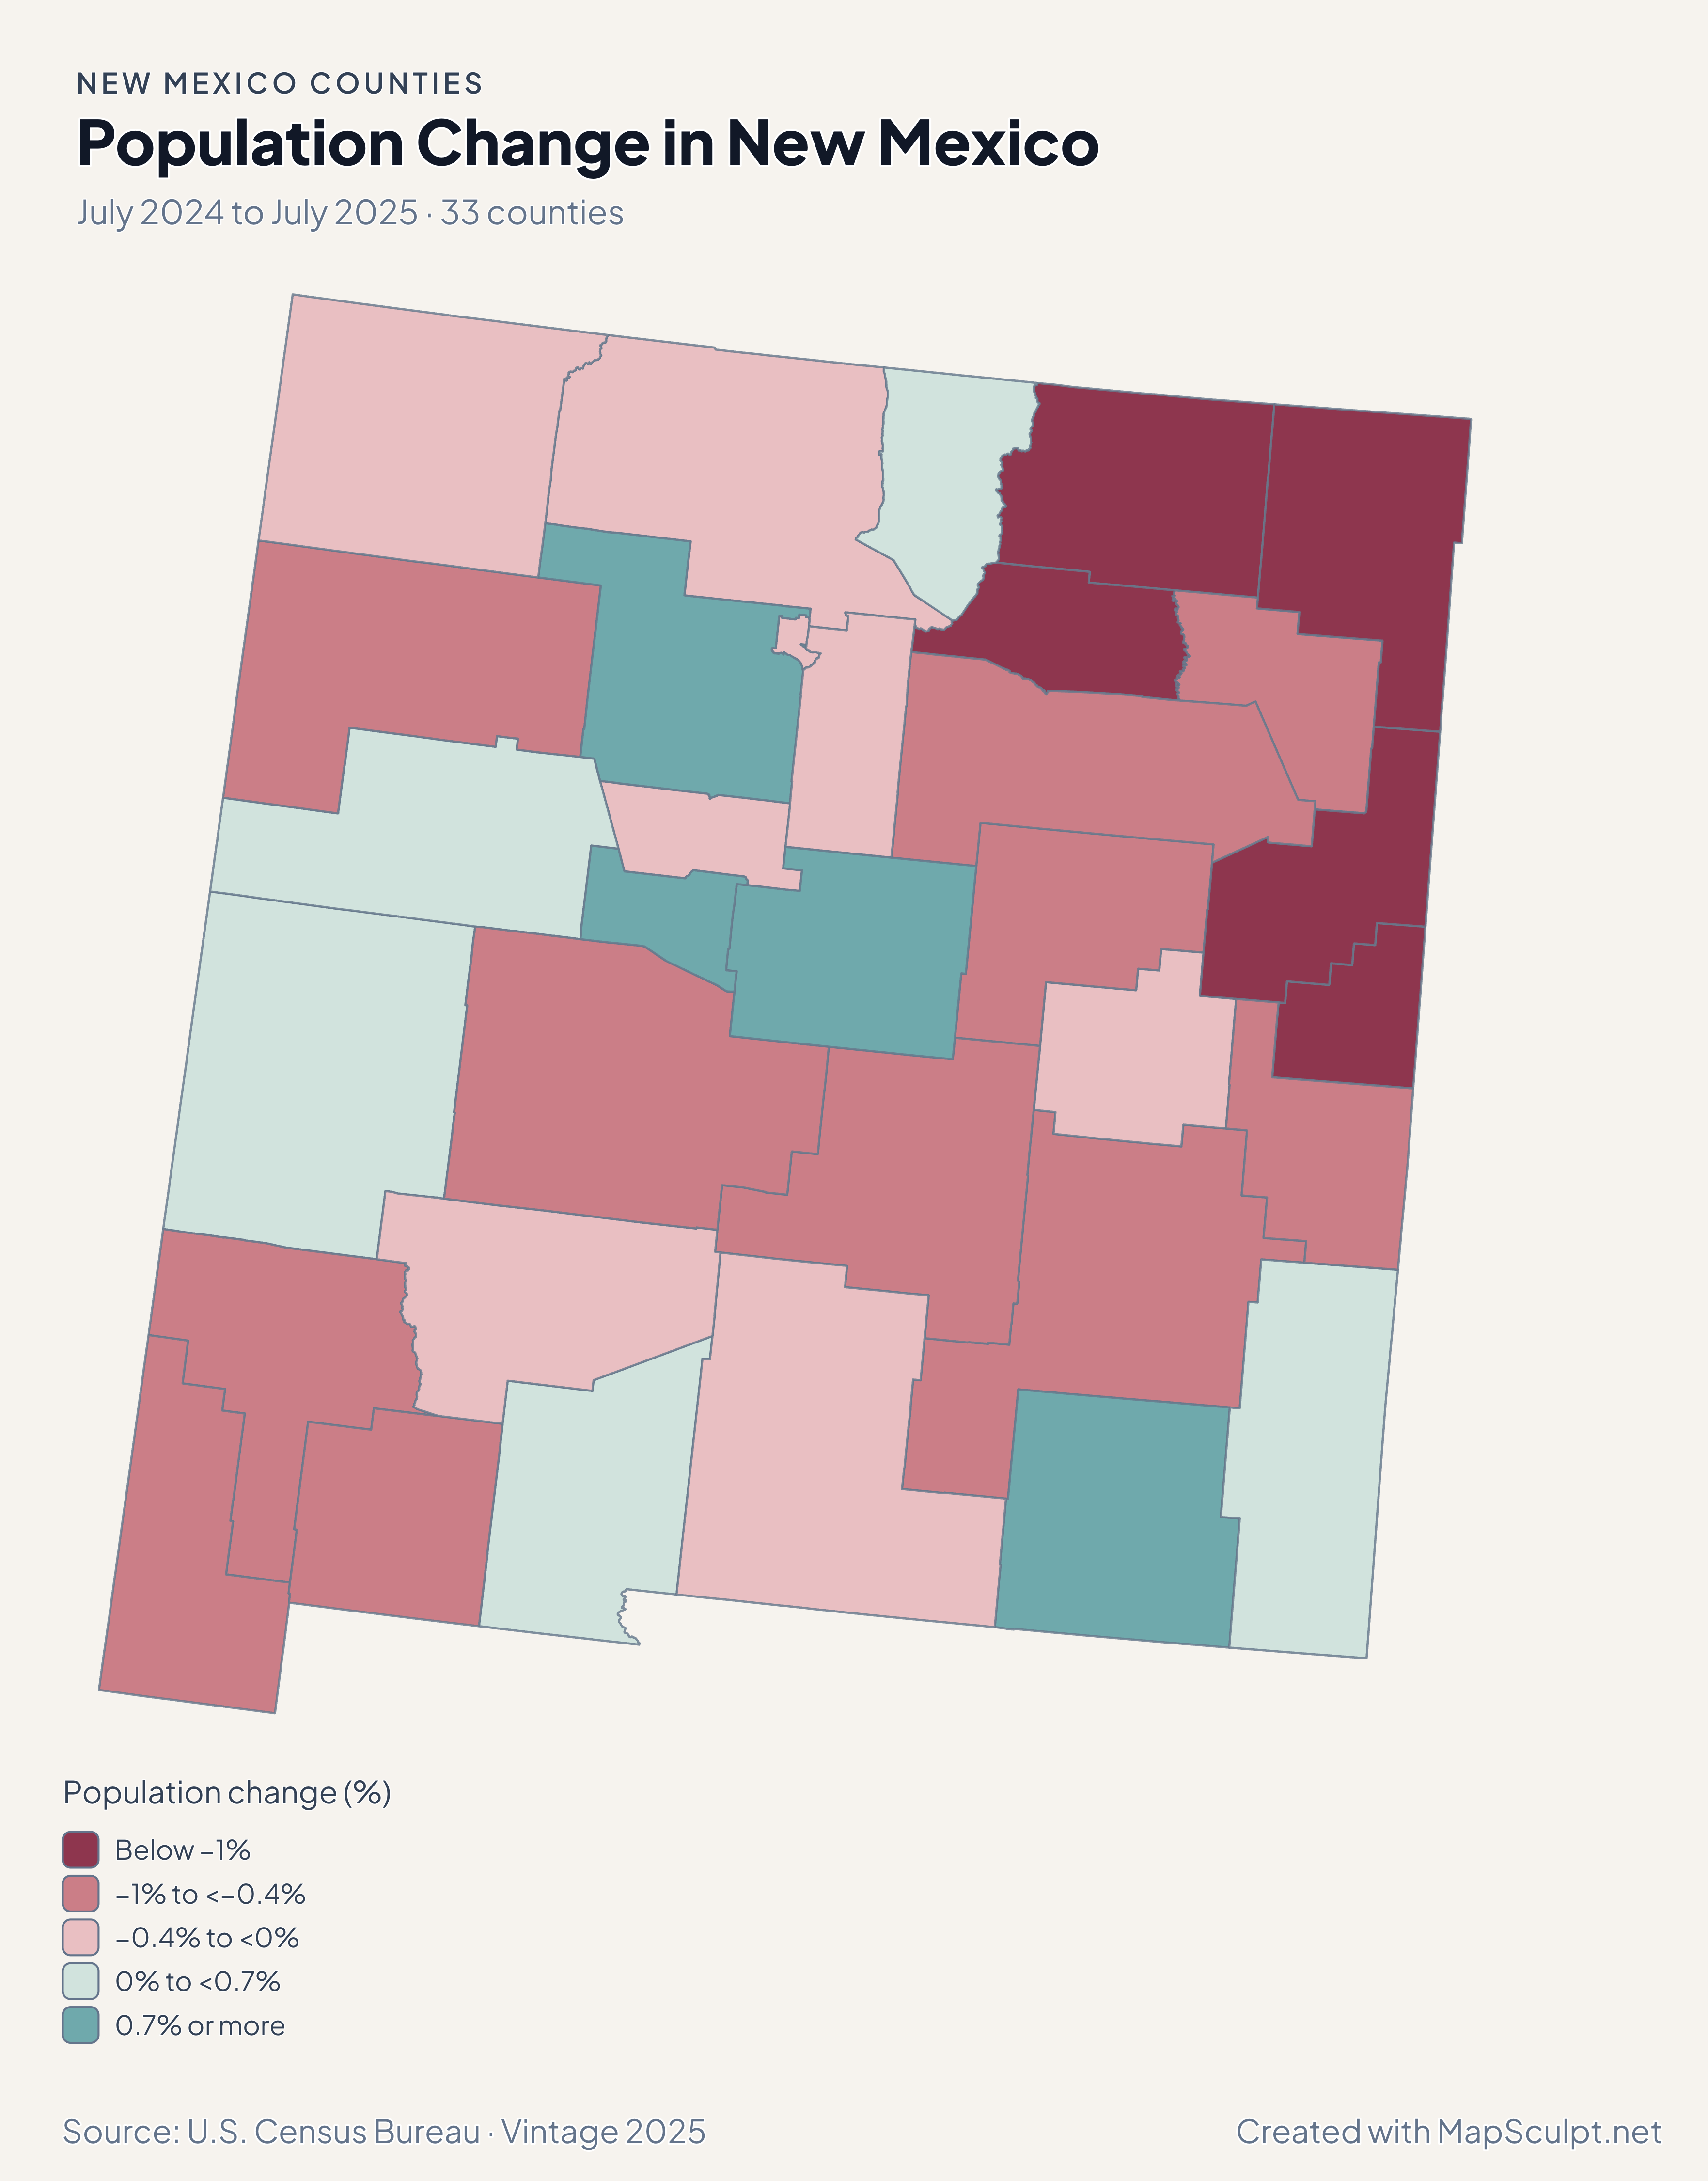
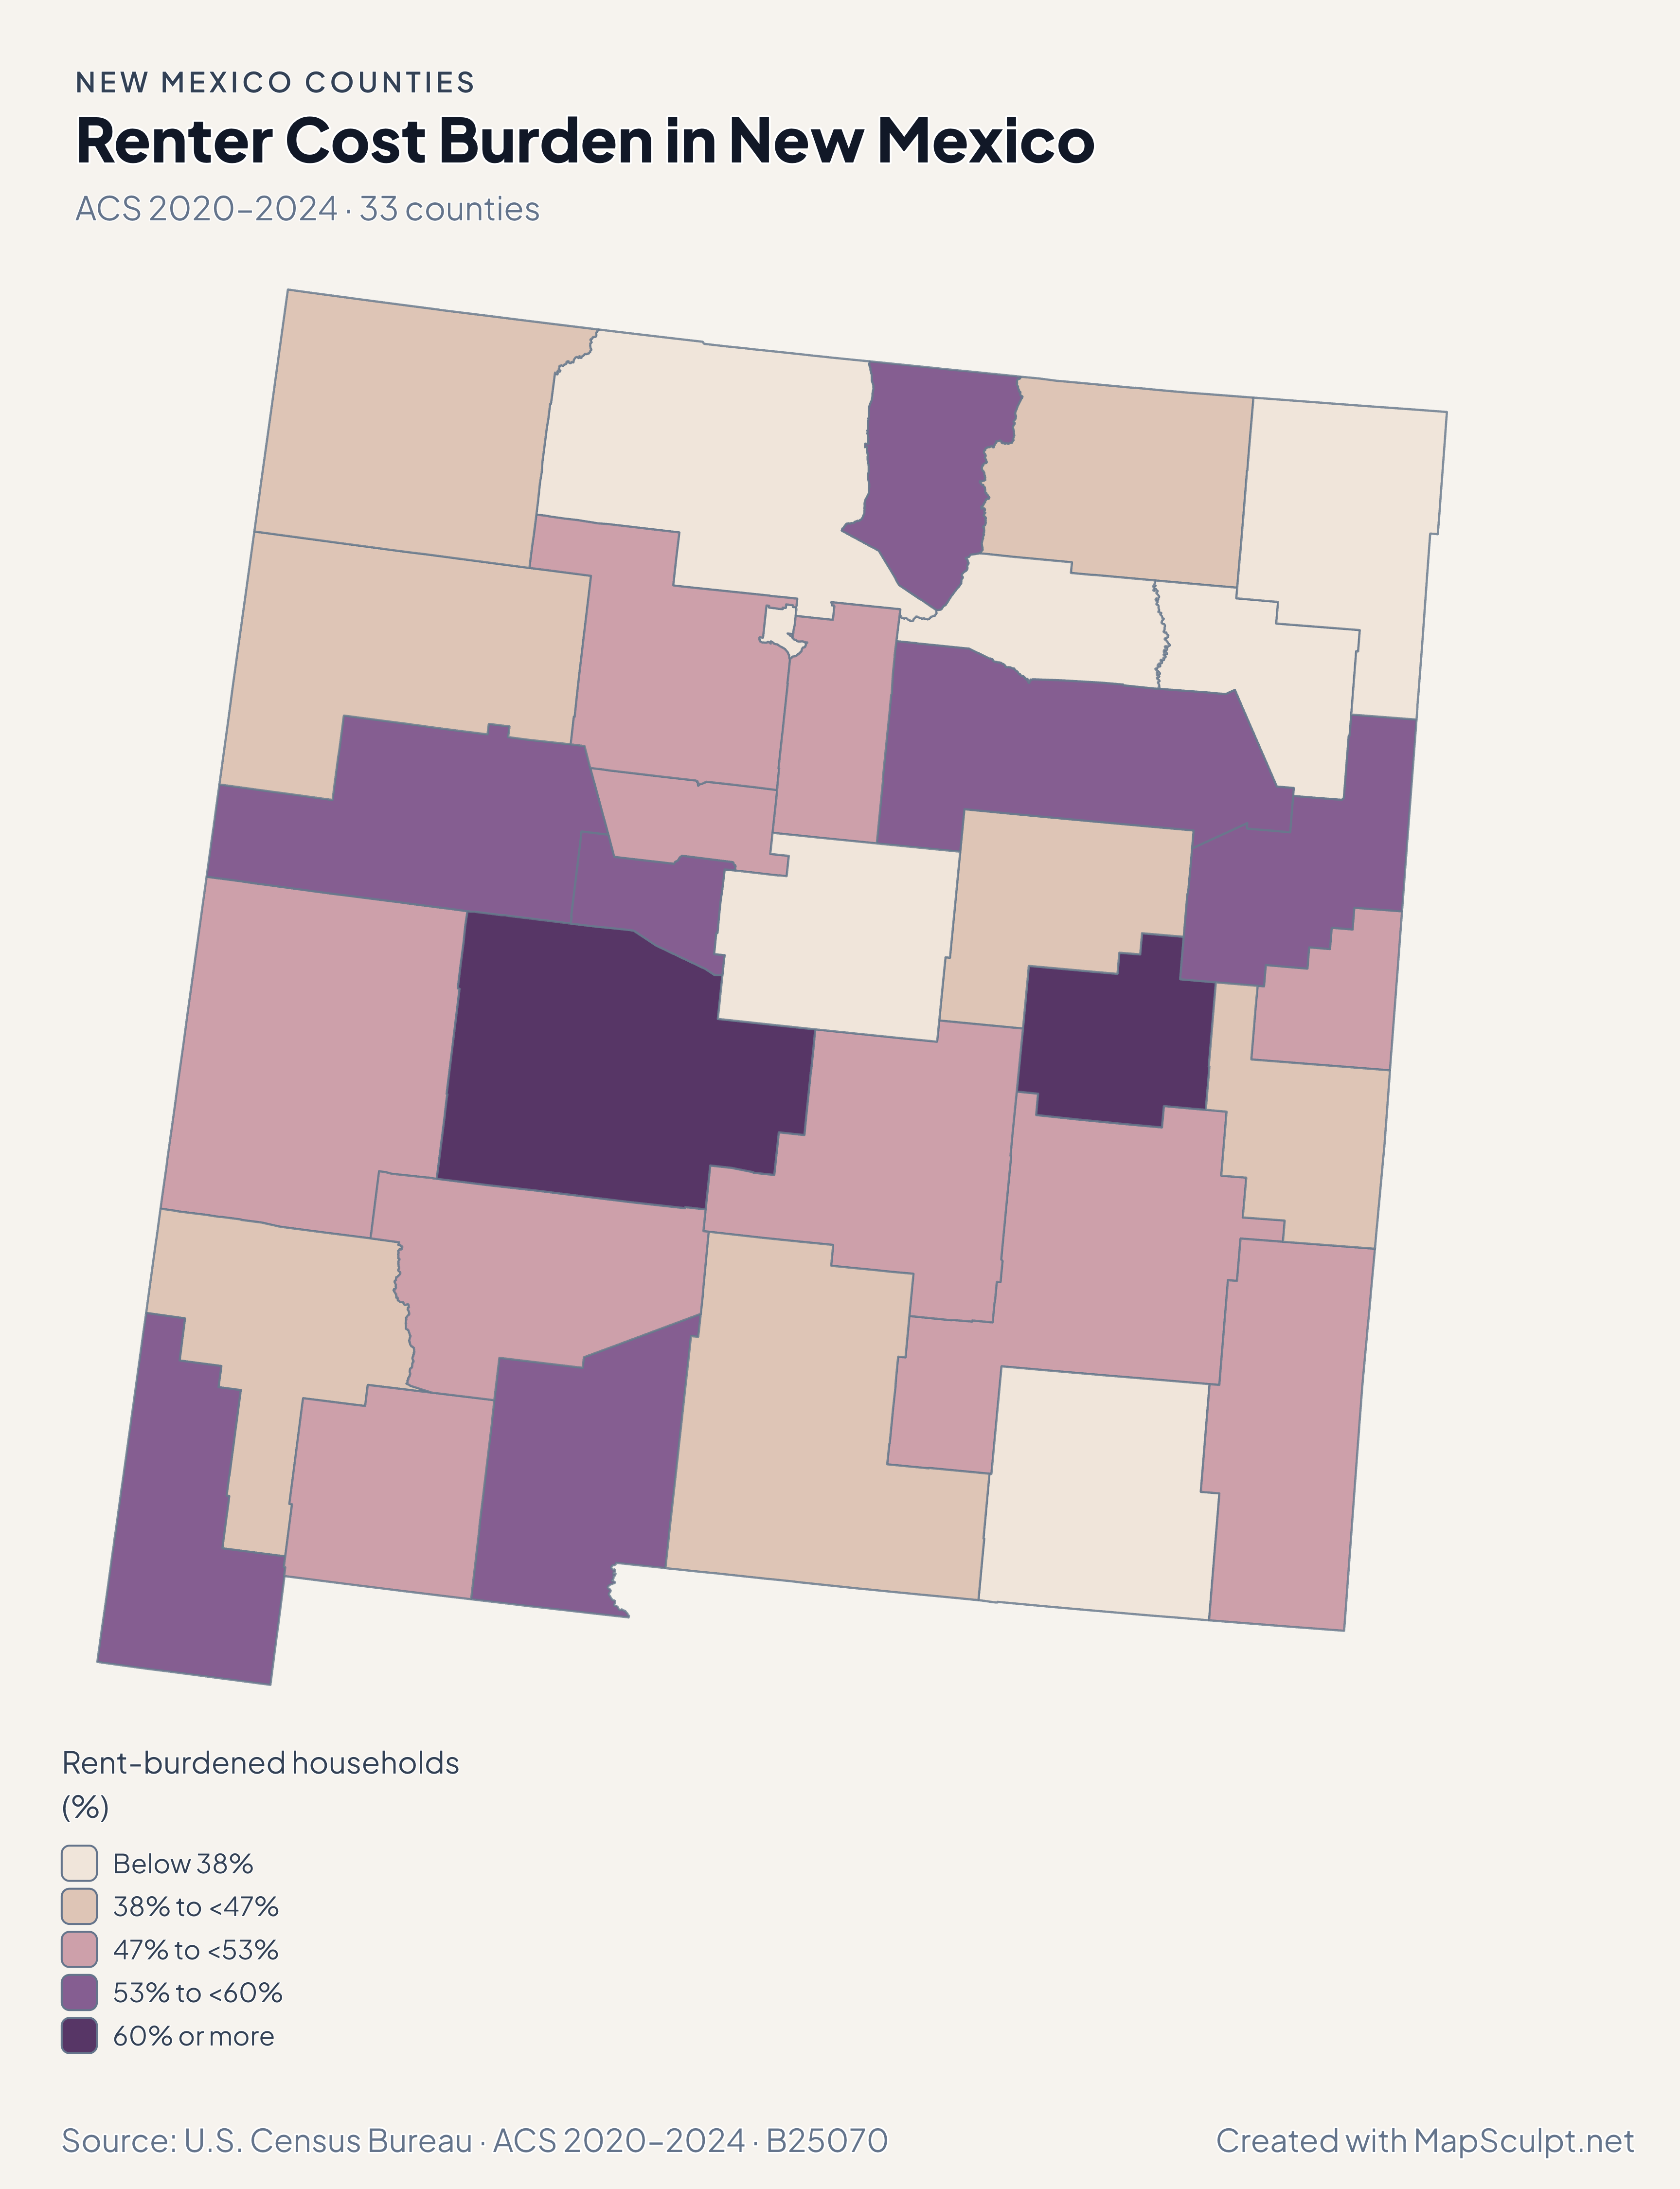
Population and net domestic moves compare July 2024 and July 2025. Household income and renter costs use the 2020–2024 American Community Survey.

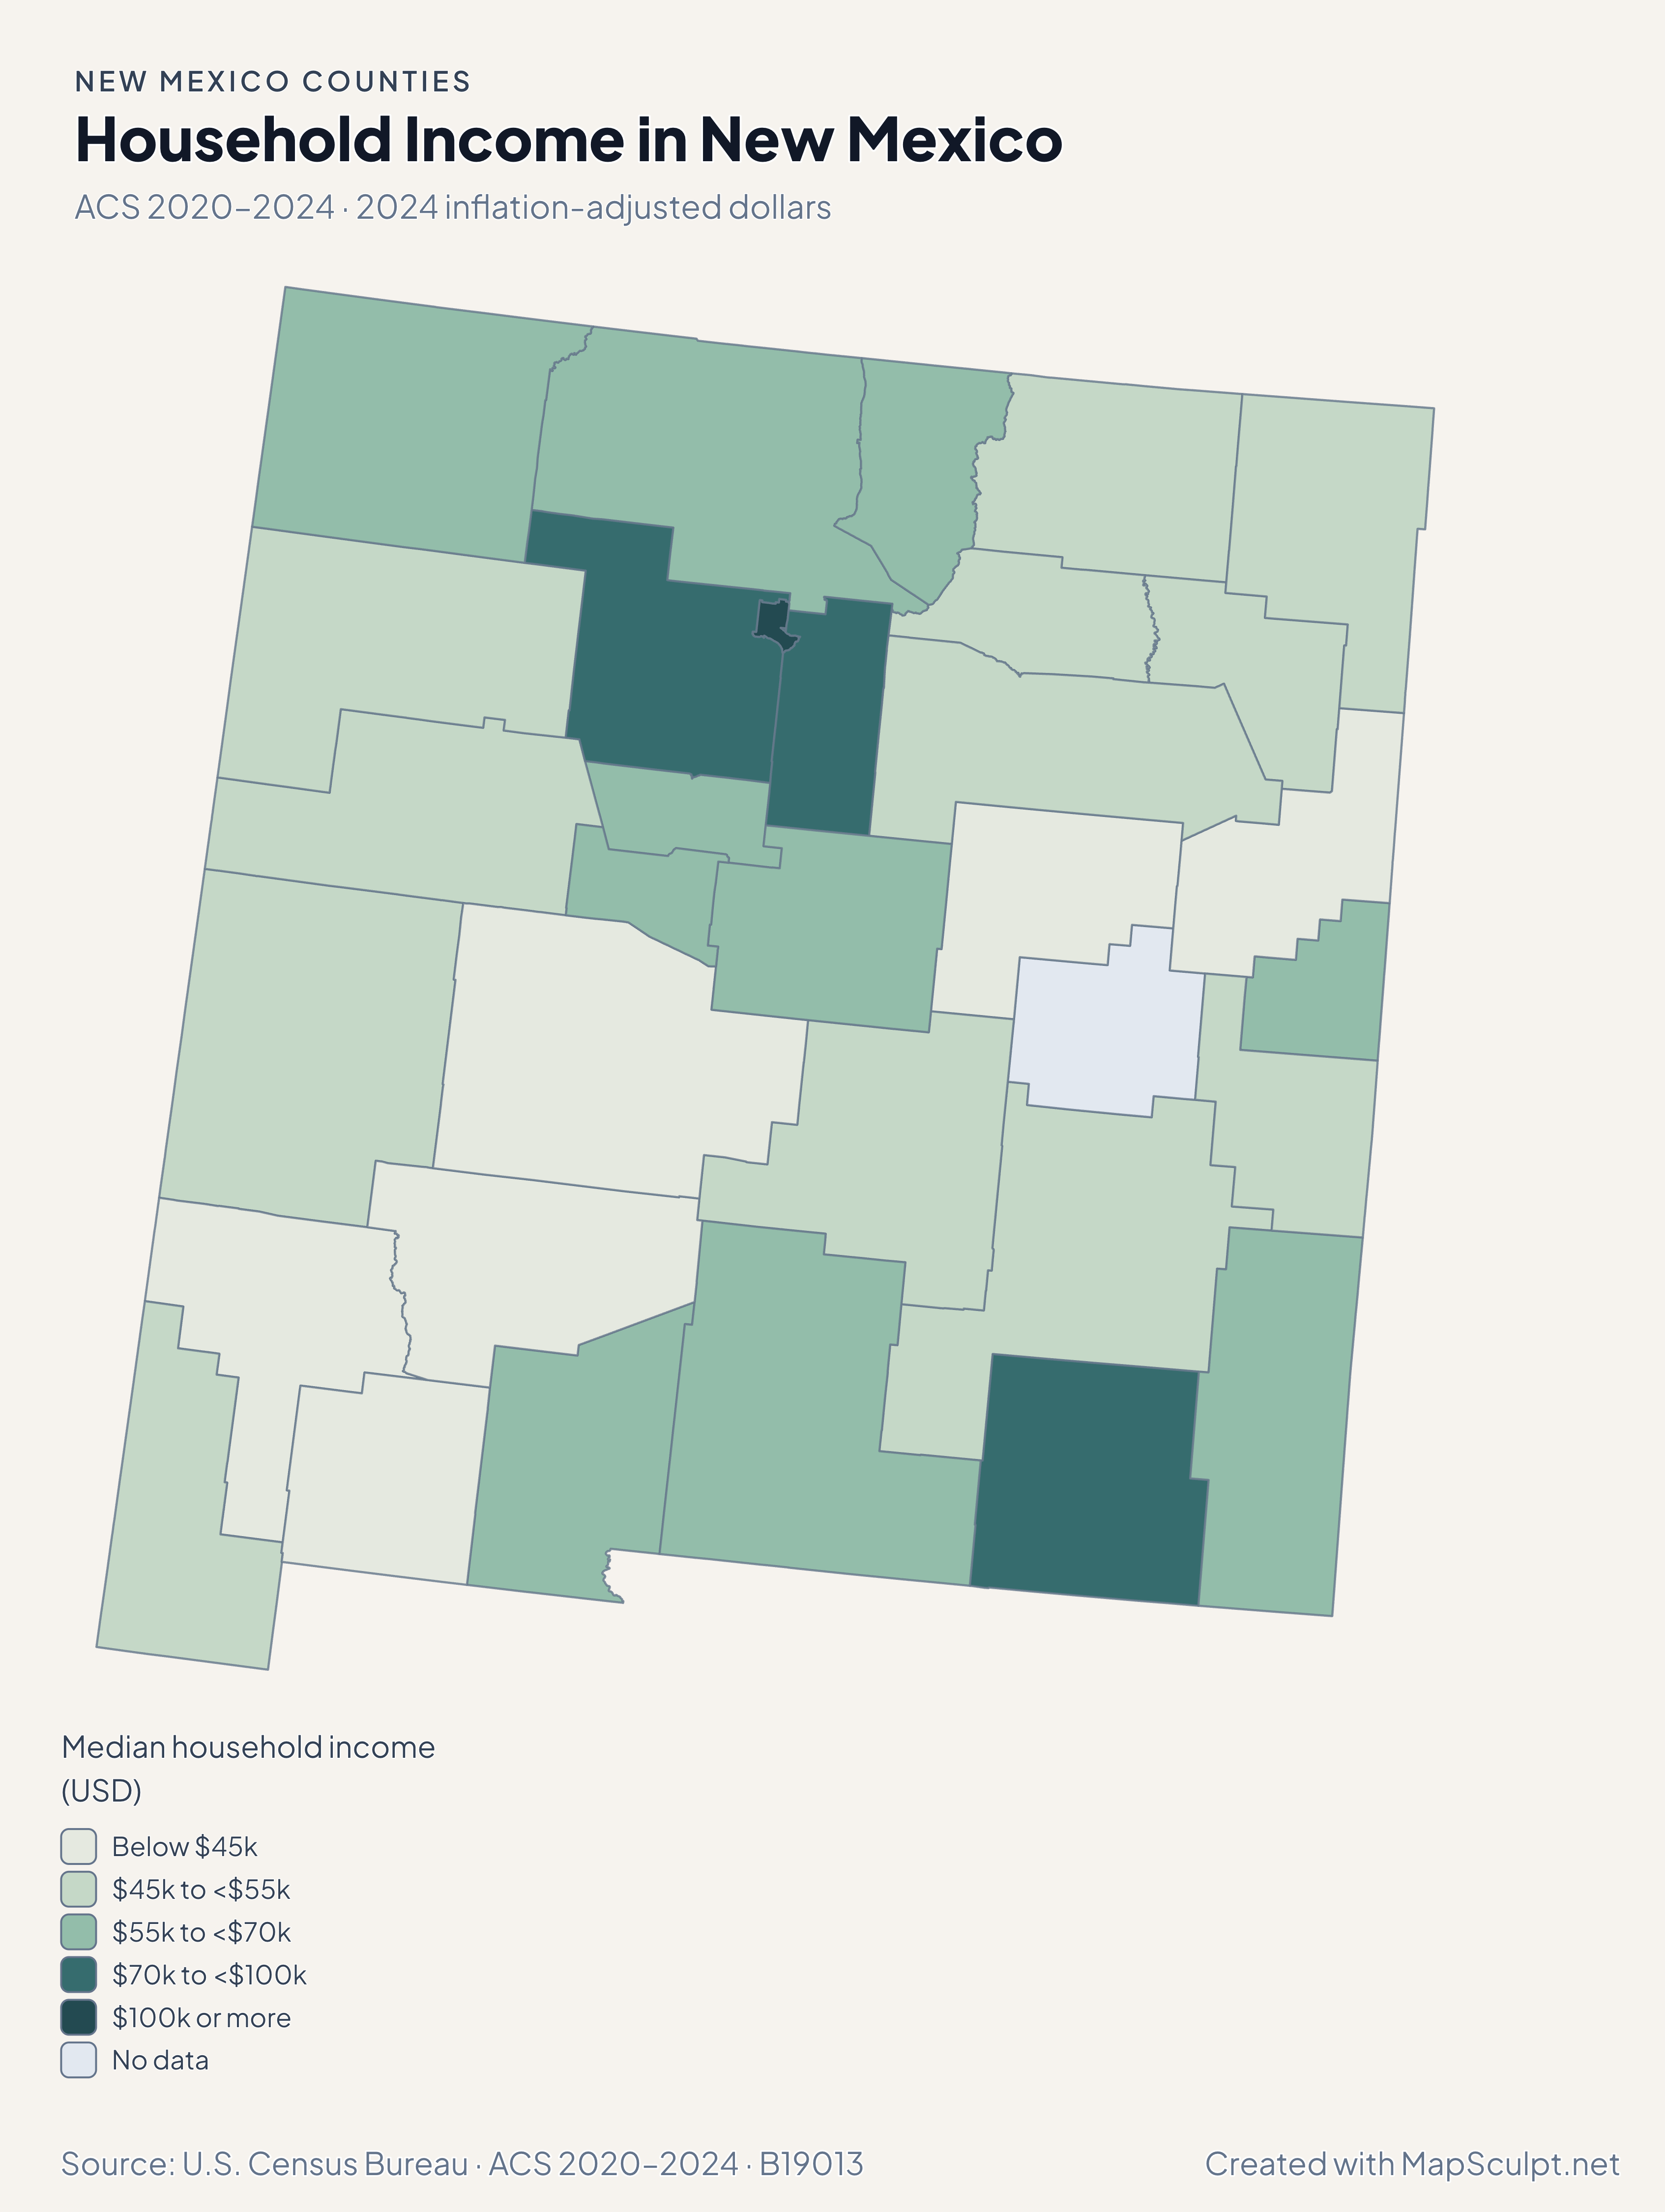
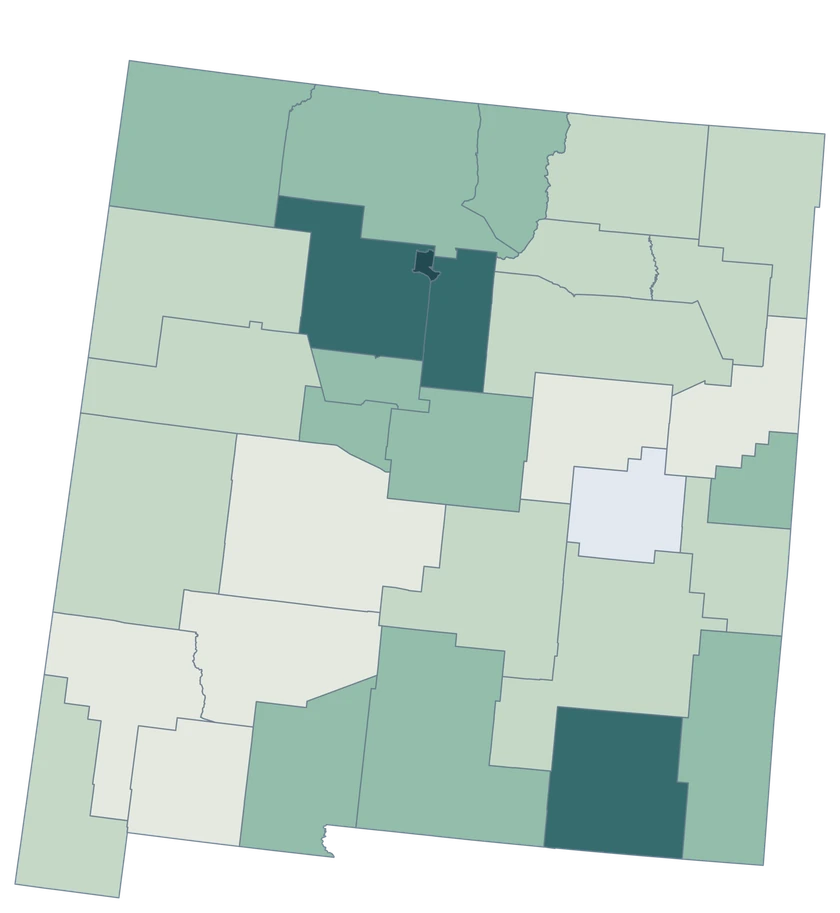
New Mexico county choropleth of household income, including Los Alamos, Santa Fe, Doña Ana.

ACS 2020–2024 · 2024 inflation-adjusted dollars

Household income estimates span several bands.

Estimated median household income was $147,139 in Los Alamos, $79,071 in Santa Fe and $56,848 in Doña Ana. The ACS omits a usable De Baca County income estimate, shown as missing. Other comparisons should account for the margins of error.

Median household income (USD)

  • Below $45k
  • $45k to <$55k
  • $55k to <$70k
  • $70k to <$100k
  • $100k or more
  • No data

U.S. Census Bureau · ACS 2020–2024 · B19013

Download complete PNG
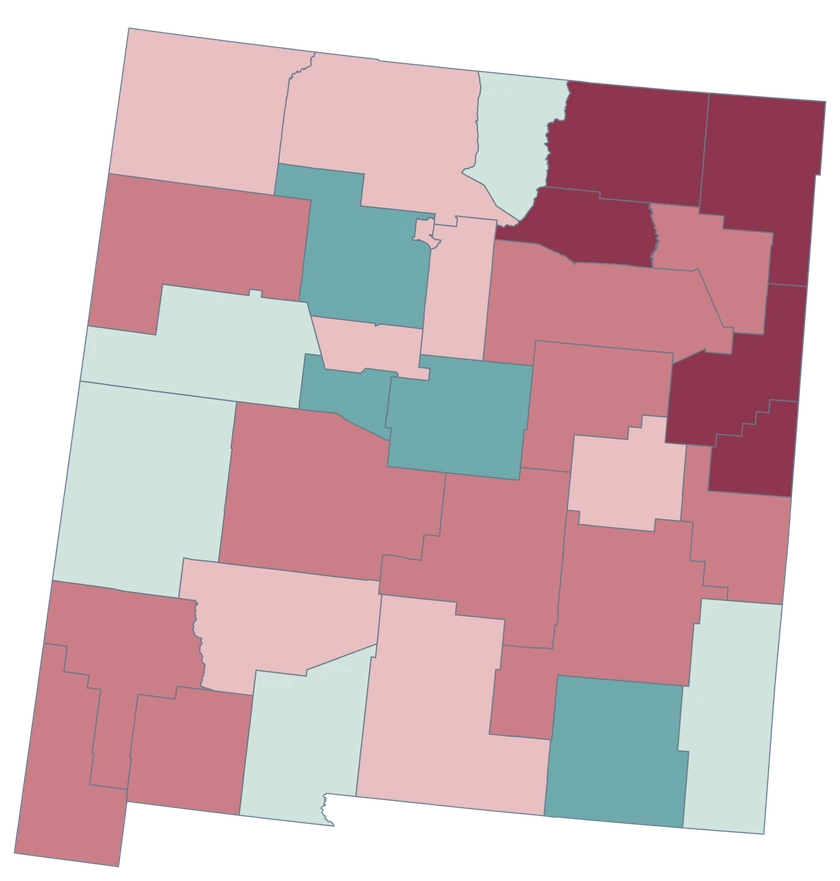
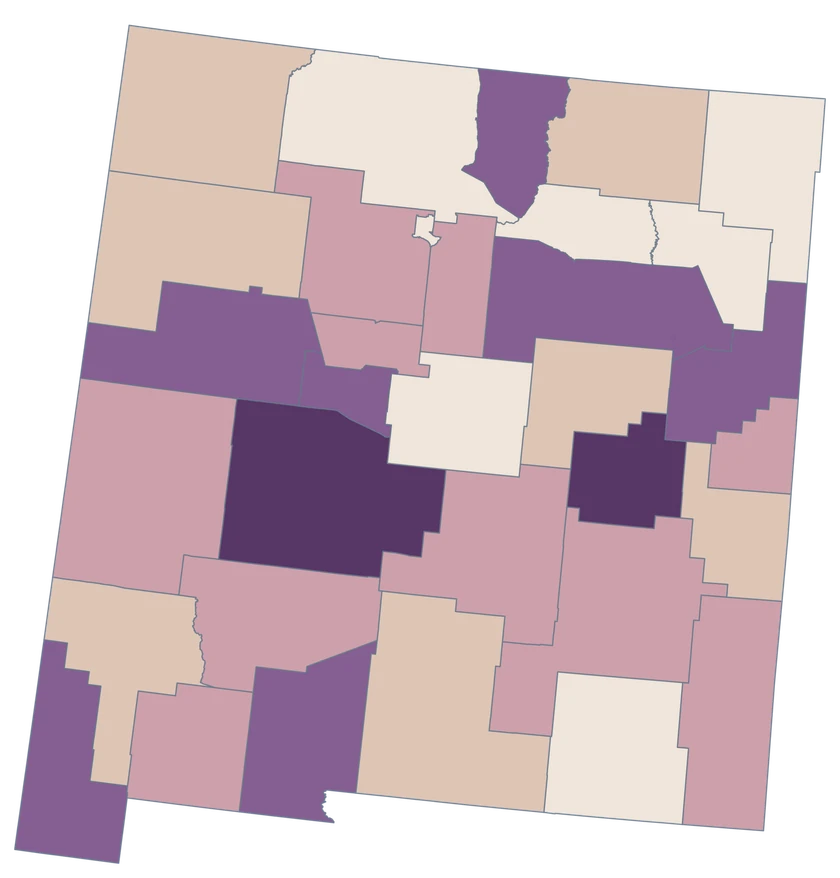
Bernalillo recorded −4.68 net domestic movers per 1,000 residents, while Sandoval recorded +13.00 and Valencia +13.85. In southern New Mexico, Doña Ana recorded +2.54 per 1,000. See the Census estimates ↗

MAKE IT YOURS

From county data to a finished map.

  1. Open the New Mexico editor

    Start with all 33 county features.

  2. Match county records

    Use the five-digit GEOID, such as 35001. Review matches before applying a color scale.

  3. Classify by measurement

    Choose intervals and colors that make the units and direction of change easy to read.

  4. Export the finished map

    Include the source, period and legend in a downloadable PNG.

TRY CSV IMPORT

Try six New Mexico records.

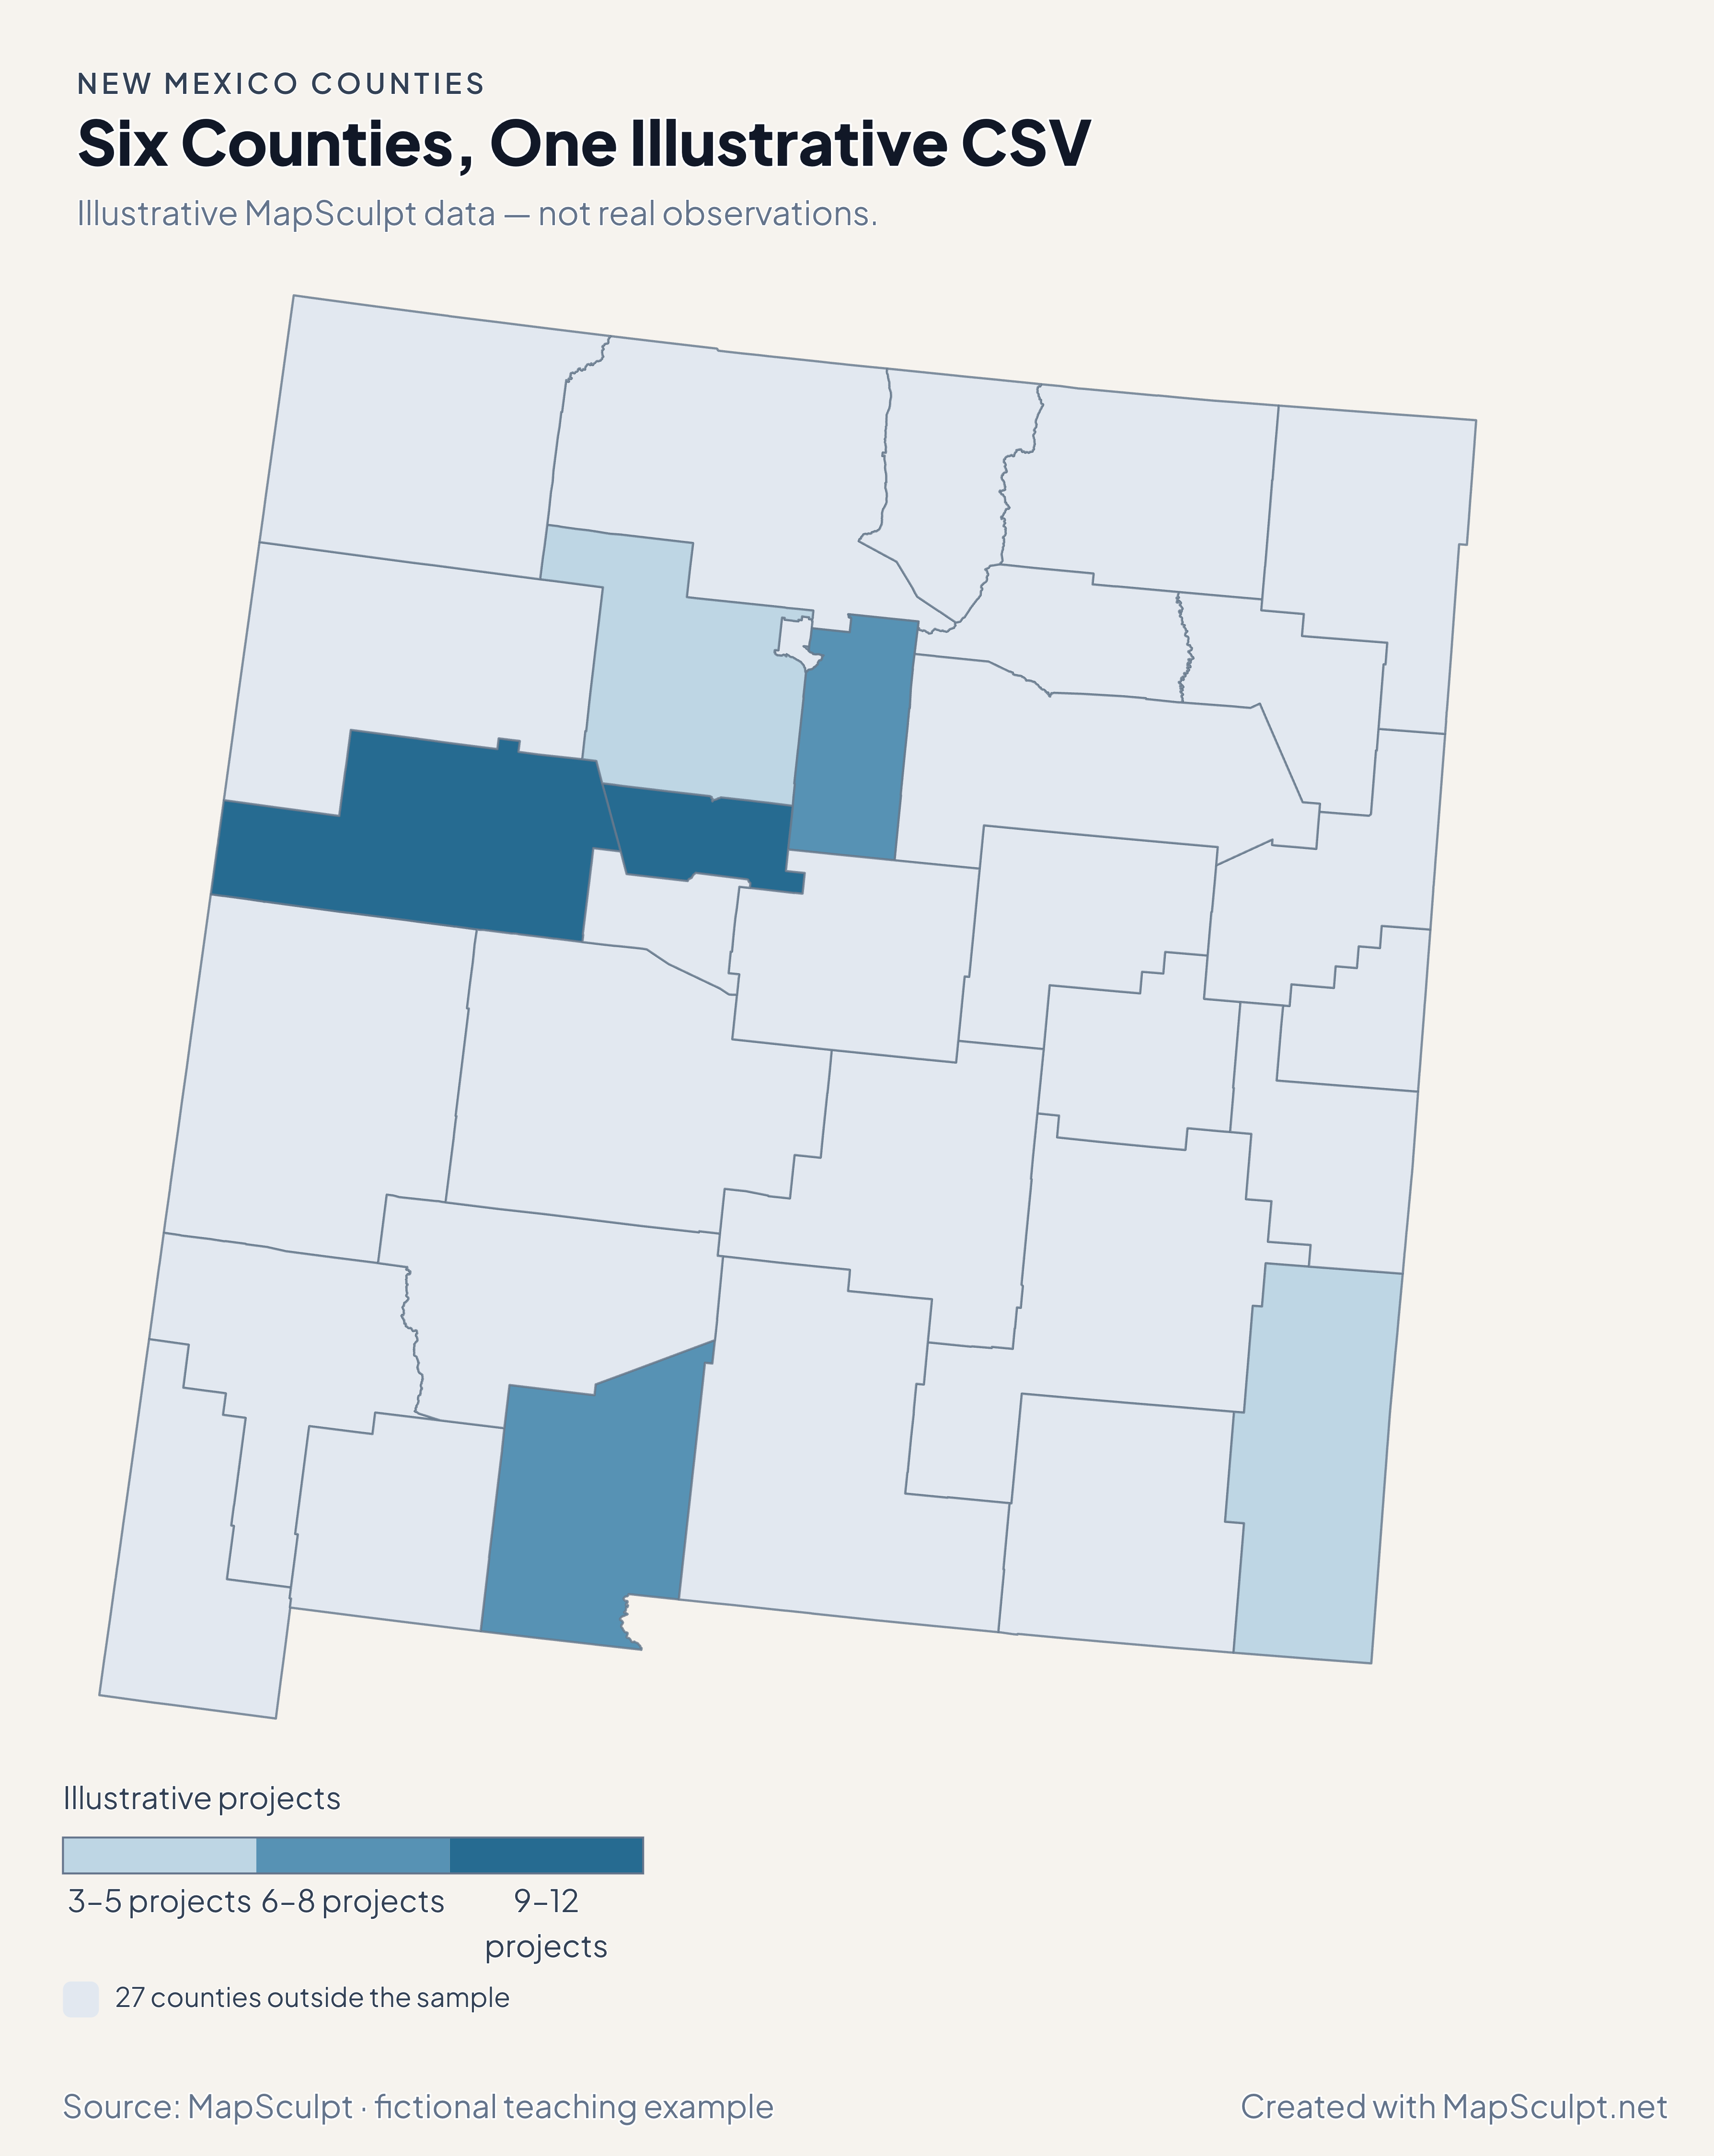
Import the fictional project counts and use breaks of 3, 6, 9 and 12. The remaining 27 counties stay neutral.

Illustrative MapSculpt data — not real observations.
CountyGEOIDProjects
Bernalillo County3500112
Cibola County350069
Doña Ana County350137
Sandoval County350433
Santa Fe County350498
Lea County350255

Keep five-digit GEOIDs as text. The sample uses 35001 for Bernalillo County.

Download illustrative CSV ↓

Six Counties, One Illustrative CSV

Illustrative MapSculpt data — not real observations.

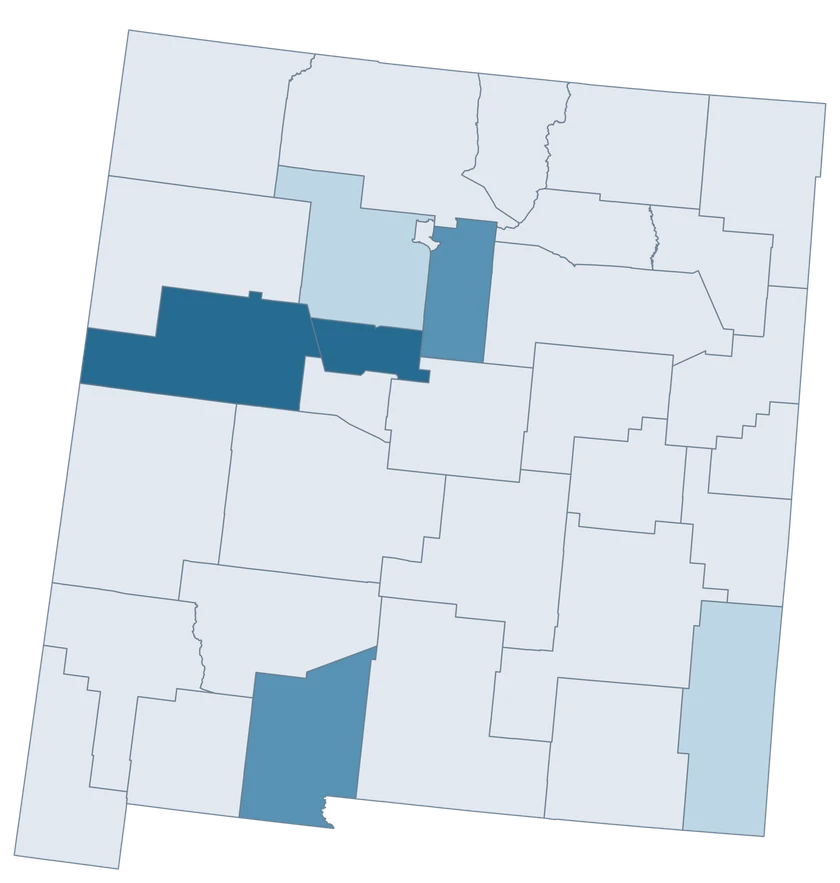
New Mexico example map with six fictional project counts and 27 neutral counties.

Illustrative projects

  • 3–5 projects
  • 6–8 projects
  • 9–12 projects
  • 27 counties outside the sample
Download complete PNG

CSV → Match 6 counties → Style → Export PNG Create a New Mexico map

COUNTY REFERENCE

All 33 New Mexico counties and GEOIDs.

Official county names and five-digit Census GEOIDs. Search by name or code.

  1. Bernalillo CountyGEOID 35001
  2. Catron CountyGEOID 35003
  3. Chaves CountyGEOID 35005
  4. Cibola CountyGEOID 35006
  5. Colfax CountyGEOID 35007
  6. Curry CountyGEOID 35009
  7. De Baca CountyGEOID 35011
  8. Doña Ana CountyGEOID 35013
  9. Eddy CountyGEOID 35015
  10. Grant CountyGEOID 35017
  11. Guadalupe CountyGEOID 35019
  12. Harding CountyGEOID 35021
  13. Hidalgo CountyGEOID 35023
  14. Lea CountyGEOID 35025
  15. Lincoln CountyGEOID 35027
  16. Los Alamos CountyGEOID 35028
  17. Luna CountyGEOID 35029
  18. McKinley CountyGEOID 35031
  19. Mora CountyGEOID 35033
  20. Otero CountyGEOID 35035
  21. Quay CountyGEOID 35037
  22. Rio Arriba CountyGEOID 35039
  23. Roosevelt CountyGEOID 35041
  24. San Juan CountyGEOID 35045
  25. San Miguel CountyGEOID 35047
  26. Sandoval CountyGEOID 35043
  27. Santa Fe CountyGEOID 35049
  28. Sierra CountyGEOID 35051
  29. Socorro CountyGEOID 35053
  30. Taos CountyGEOID 35055
  31. Torrance CountyGEOID 35057
  32. Union CountyGEOID 35059
  33. Valencia CountyGEOID 35061

U.S. Census Bureau · 2025 Cartographic Boundary Files

COMMON QUESTIONS

New Mexico county map questions.

How do I map New Mexico separately from Mexico?

Use the New Mexico editor for U.S. Census county GEOIDs. The Mexico states editor covers a different national geography.

What is the correct GEOID for Cibola County?

Use 35006. County suffixes are assigned identifiers and are not a sequence of odd numbers.

How should I write Doña Ana in a CSV?

Keep the official spelling Doña Ana County, or join by 35013 to avoid encoding and name-matching differences.

Does Albuquerque have its own polygon?

The layer shows whole counties. Use Bernalillo County GEOID 35001 for county-wide data and a separate municipal boundary for Albuquerque statistics.

Why is De Baca neutral on the income map?

The 2020–2024 ACS does not supply a usable B19013 estimate for De Baca. Neutral shows missing data. The county still appears in the directory and remains selectable.

What should I use for reservations or other Tribal lands?

Use an authoritative Tribal geography dataset for those records. This editor shows the county boundary layer.

YOUR NEXT MAP STARTS HERE

Build your New Mexico county map.

Join your own New Mexico county records by GEOID, review the matches and export with an accurate legend.

Create a New Mexico map