Skip to content
MapSculpt

GEOGRAPHIC MAP MAKER / MONTANA

Montana
Counties Map Maker

Map Montana’s 56 counties, from the western valleys to the eastern plains. Compare percentage growth around Bozeman and Billings with a larger percentage gain in Richland County.

Free online editor · No sign-up required

56counties
individually editable

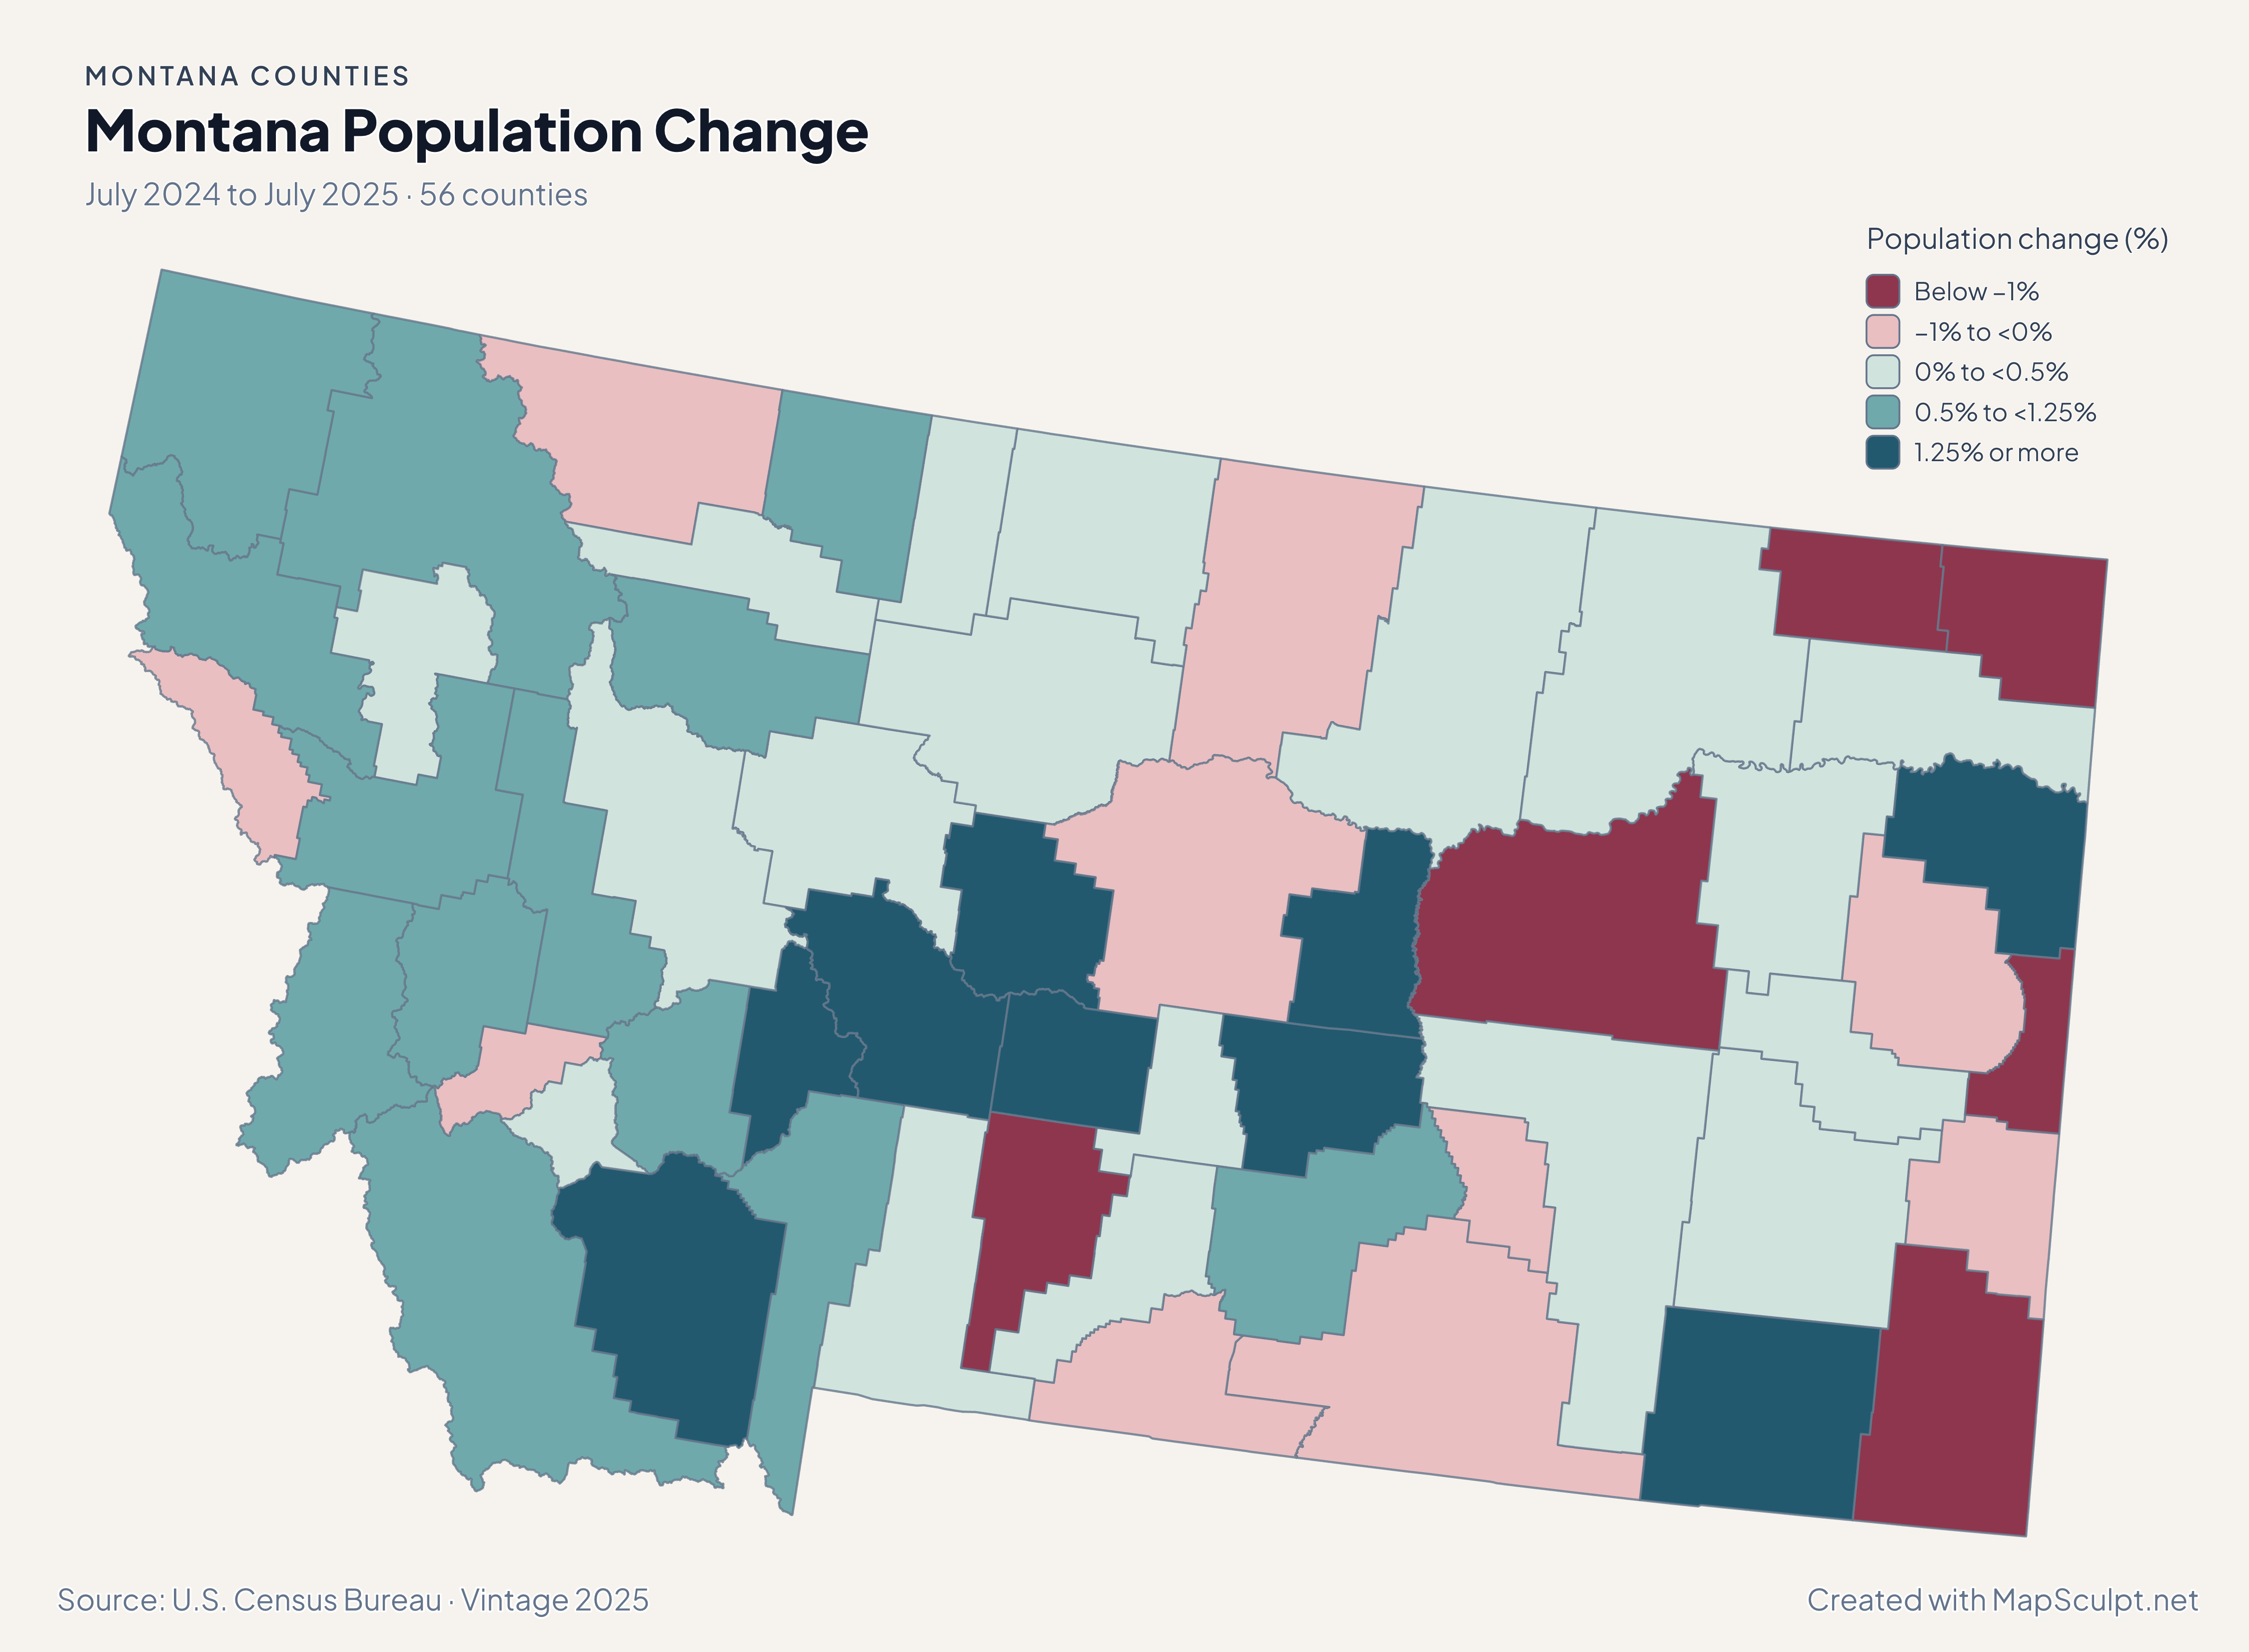
Montana Population Change

July 2024 to July 2025 · 56 counties

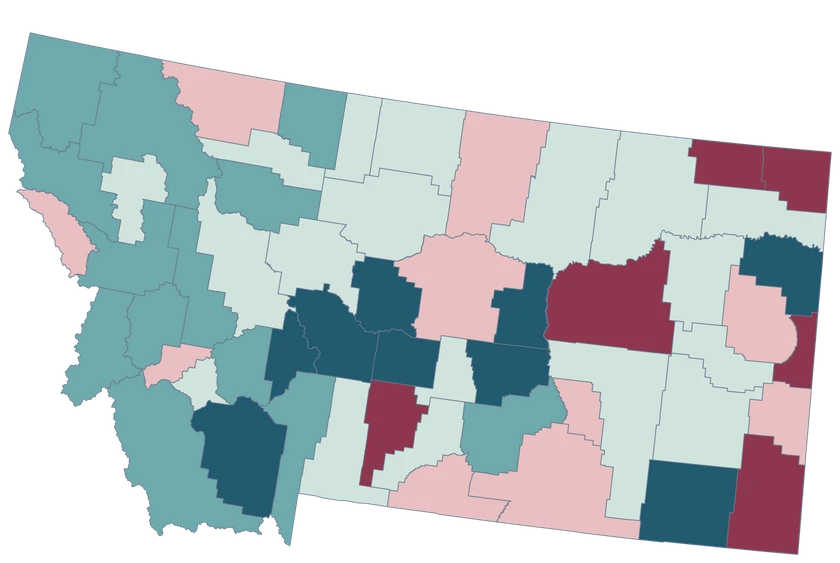
Montana population-change map highlighting Richland in the east and showing growth in Gallatin, Missoula and Flathead.

Population change (%)

  • Below −1%
  • −1% to <0%
  • 0% to <0.5%
  • 0.5% to <1.25%
  • 1.25% or more
U.S. Census Bureau · Vintage 2025Download complete PNG Percentage change in the Census population estimate from July 2024 to July 2025.

KNOW YOUR GEOGRAPHY

County outlines across western mountains and eastern plains

The editor follows Montana’s county boundaries along the western mountains and across the eastern plains. Gallatin contains Bozeman and Yellowstone contains Billings. A larger shape on the map does not imply a larger population.

Tribal lands and reservation boundaries are separate geographic layers. This county map represents Census county identities.

Browse all county GEOIDs ↗

2025 Census boundaries

OFFICIAL DATA

Residents added and percentage growth tell different stories

Yellowstone added more residents than Richland, but Richland had the larger percentage gain. Look at the starting population alongside the mapped rate.

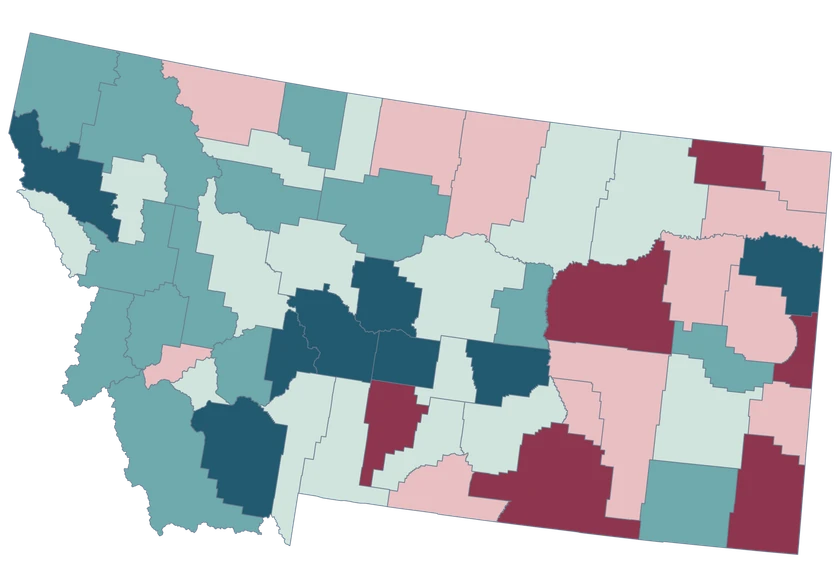
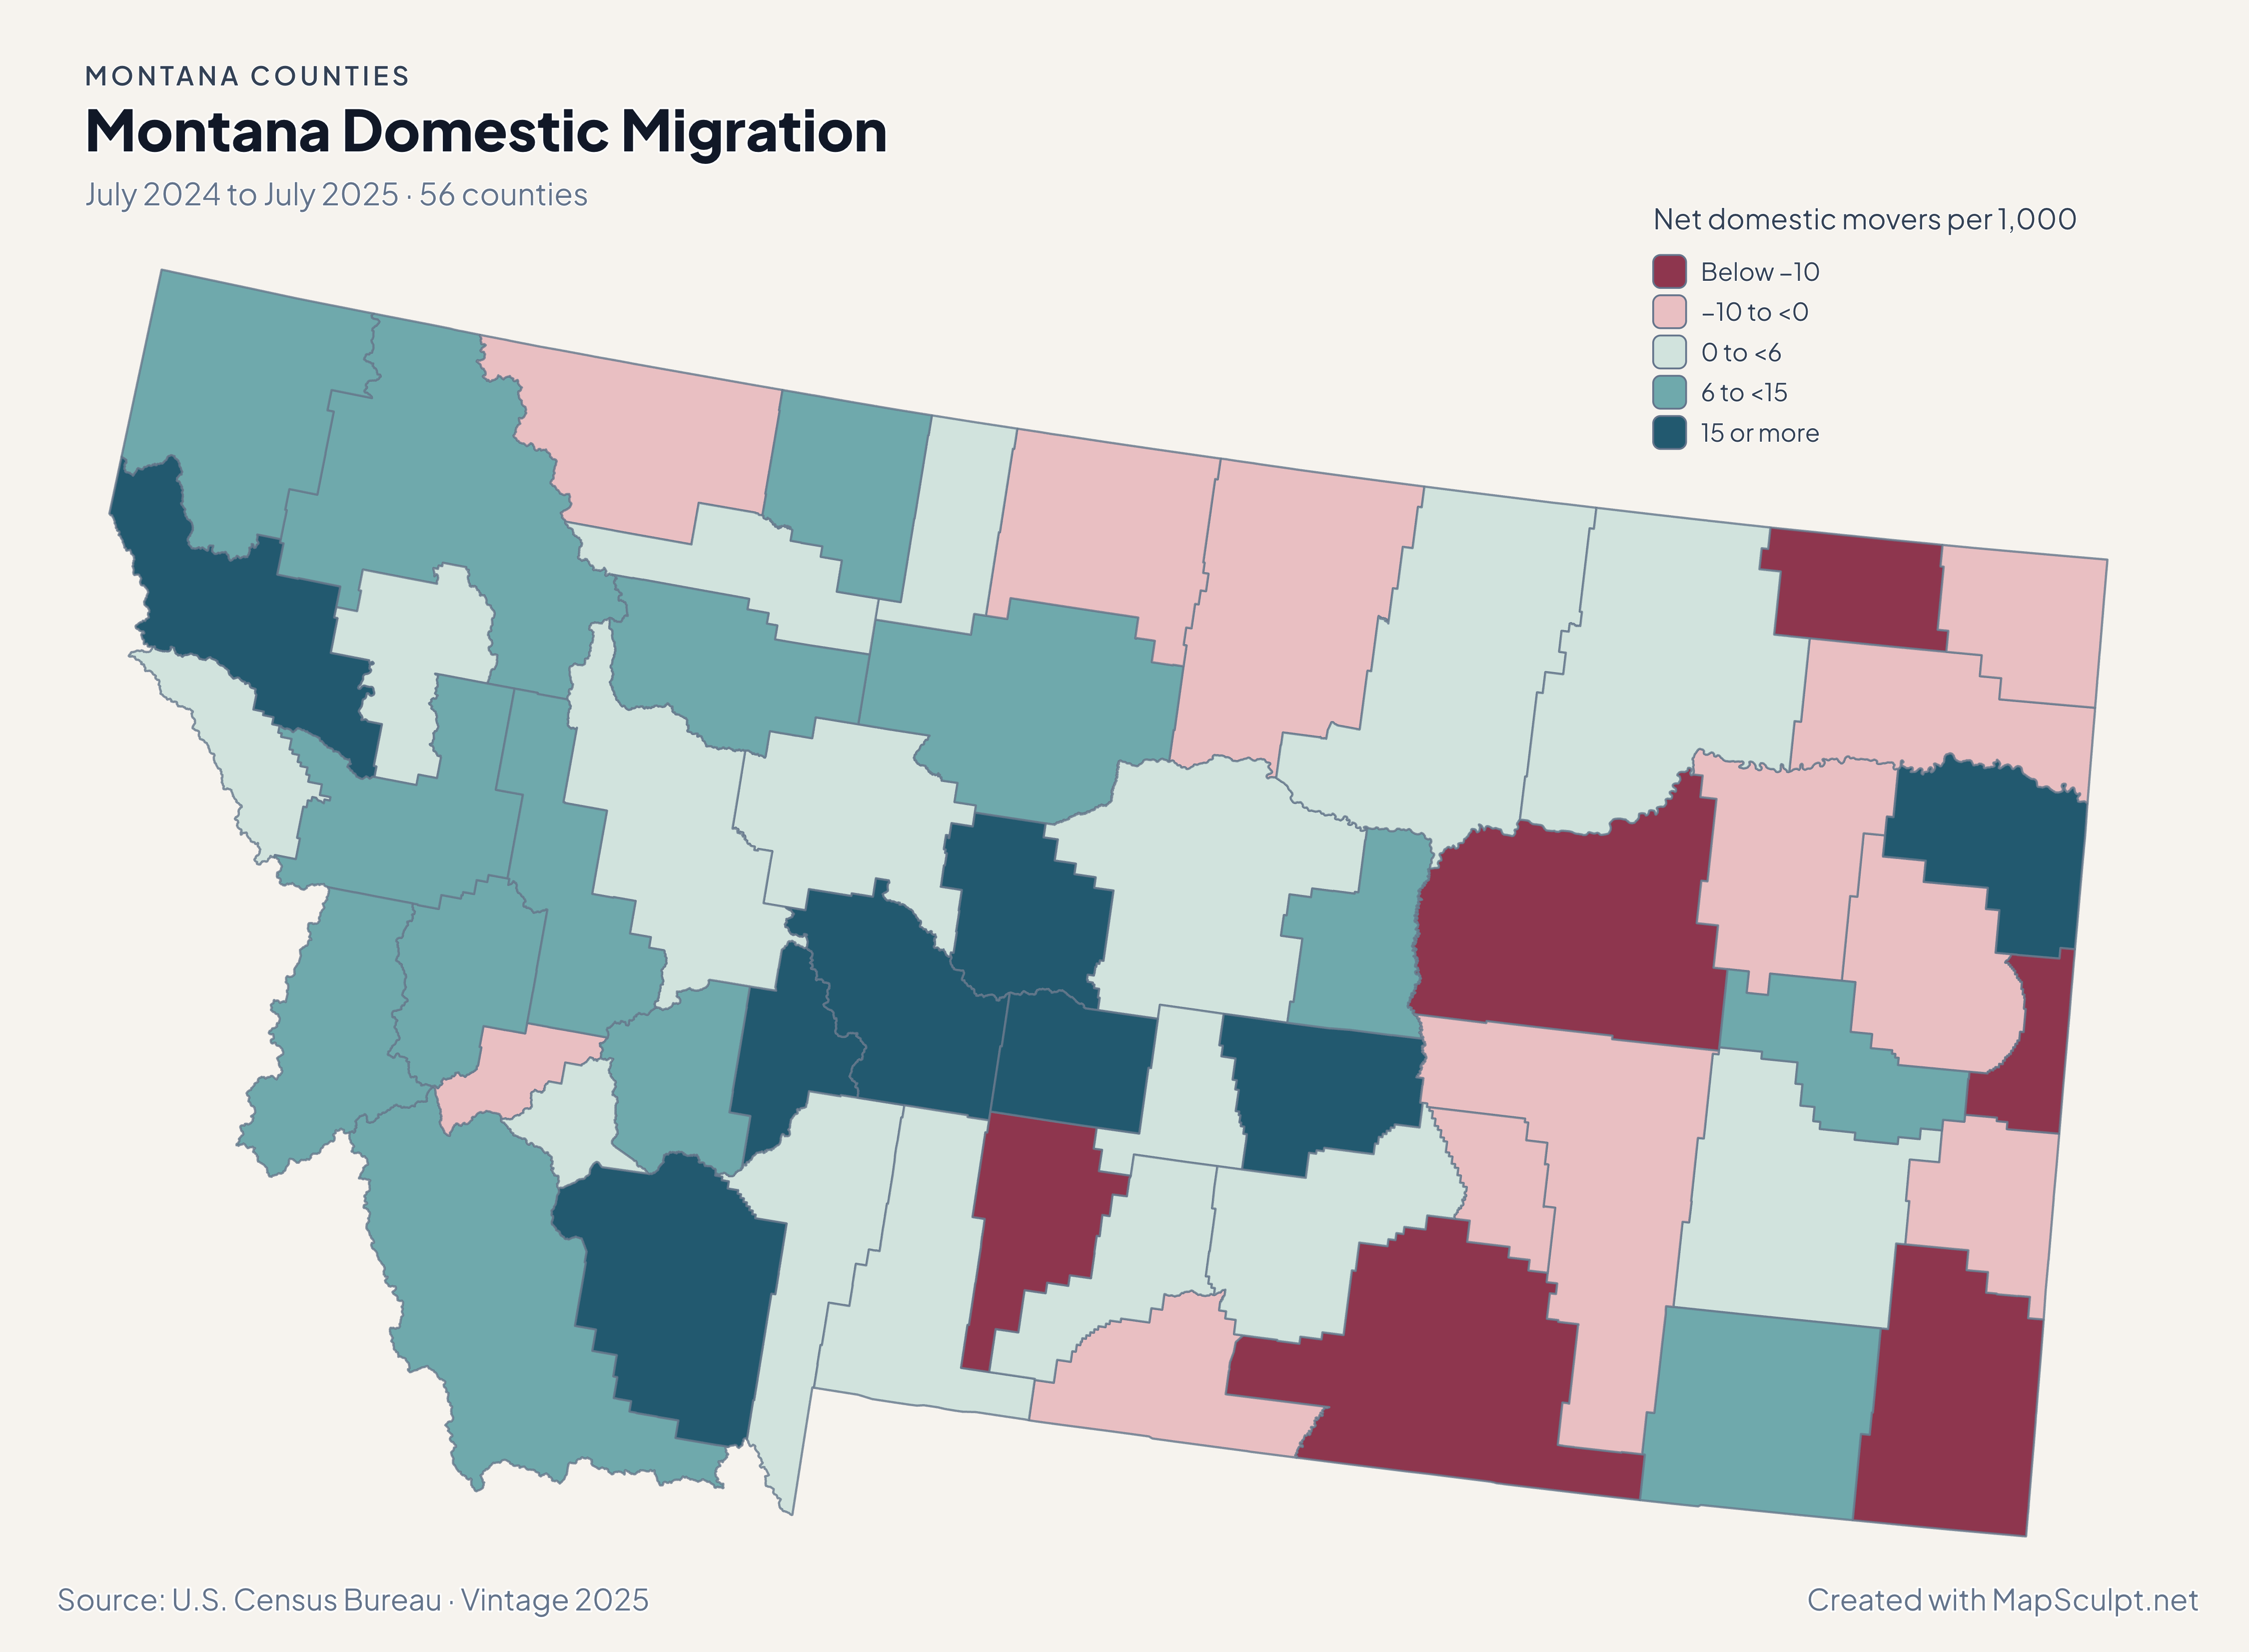
Montana migration map showing gains in Richland and Flathead and a lower band in Lewis and Clark.

July 2024 to July 2025 · 56 counties

Richland and Flathead both recorded net domestic gains

Richland had +23.08 net domestic movers per 1,000 residents, Flathead +7.95, and Lewis and Clark +3.52. A small population makes a rate sensitive to a relatively modest number of movers.

Net domestic movers per 1,000

  • Below −10
  • −10 to <0
  • 0 to <6
  • 6 to <15
  • 15 or more

U.S. Census Bureau · Vintage 2025

Download complete PNG

Richland added 306 residents and grew 2.76%; Yellowstone added 1,144 and grew 0.67%. Gallatin grew 0.97%, Missoula 0.85%, and Flathead 0.93%. The percentage compares each change with that county’s starting population. See the Census estimates ↗

MAKE IT YOURS

From county data to a finished map.

  1. Open the Montana counties editor

    Start with the 56 county areas already on the canvas.

  2. Join your observations by GEOID

    Use 30031 for Gallatin County. Keep the measurement in a separate column.

  3. Choose ranges and check your legend

    Use a neutral color for counties outside your data and label the units and period.

  4. Download your county map

    Review the title, source and legend in the preview, then export the PNG.

TRY CSV IMPORT

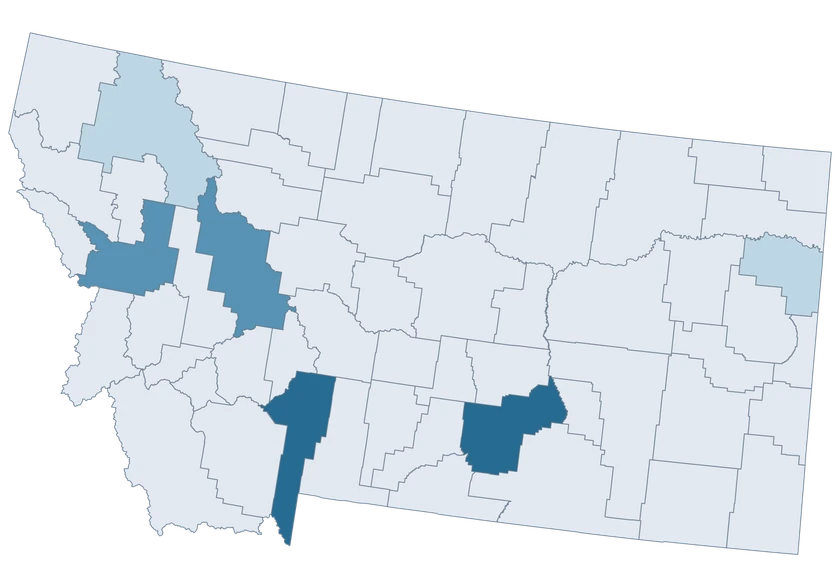
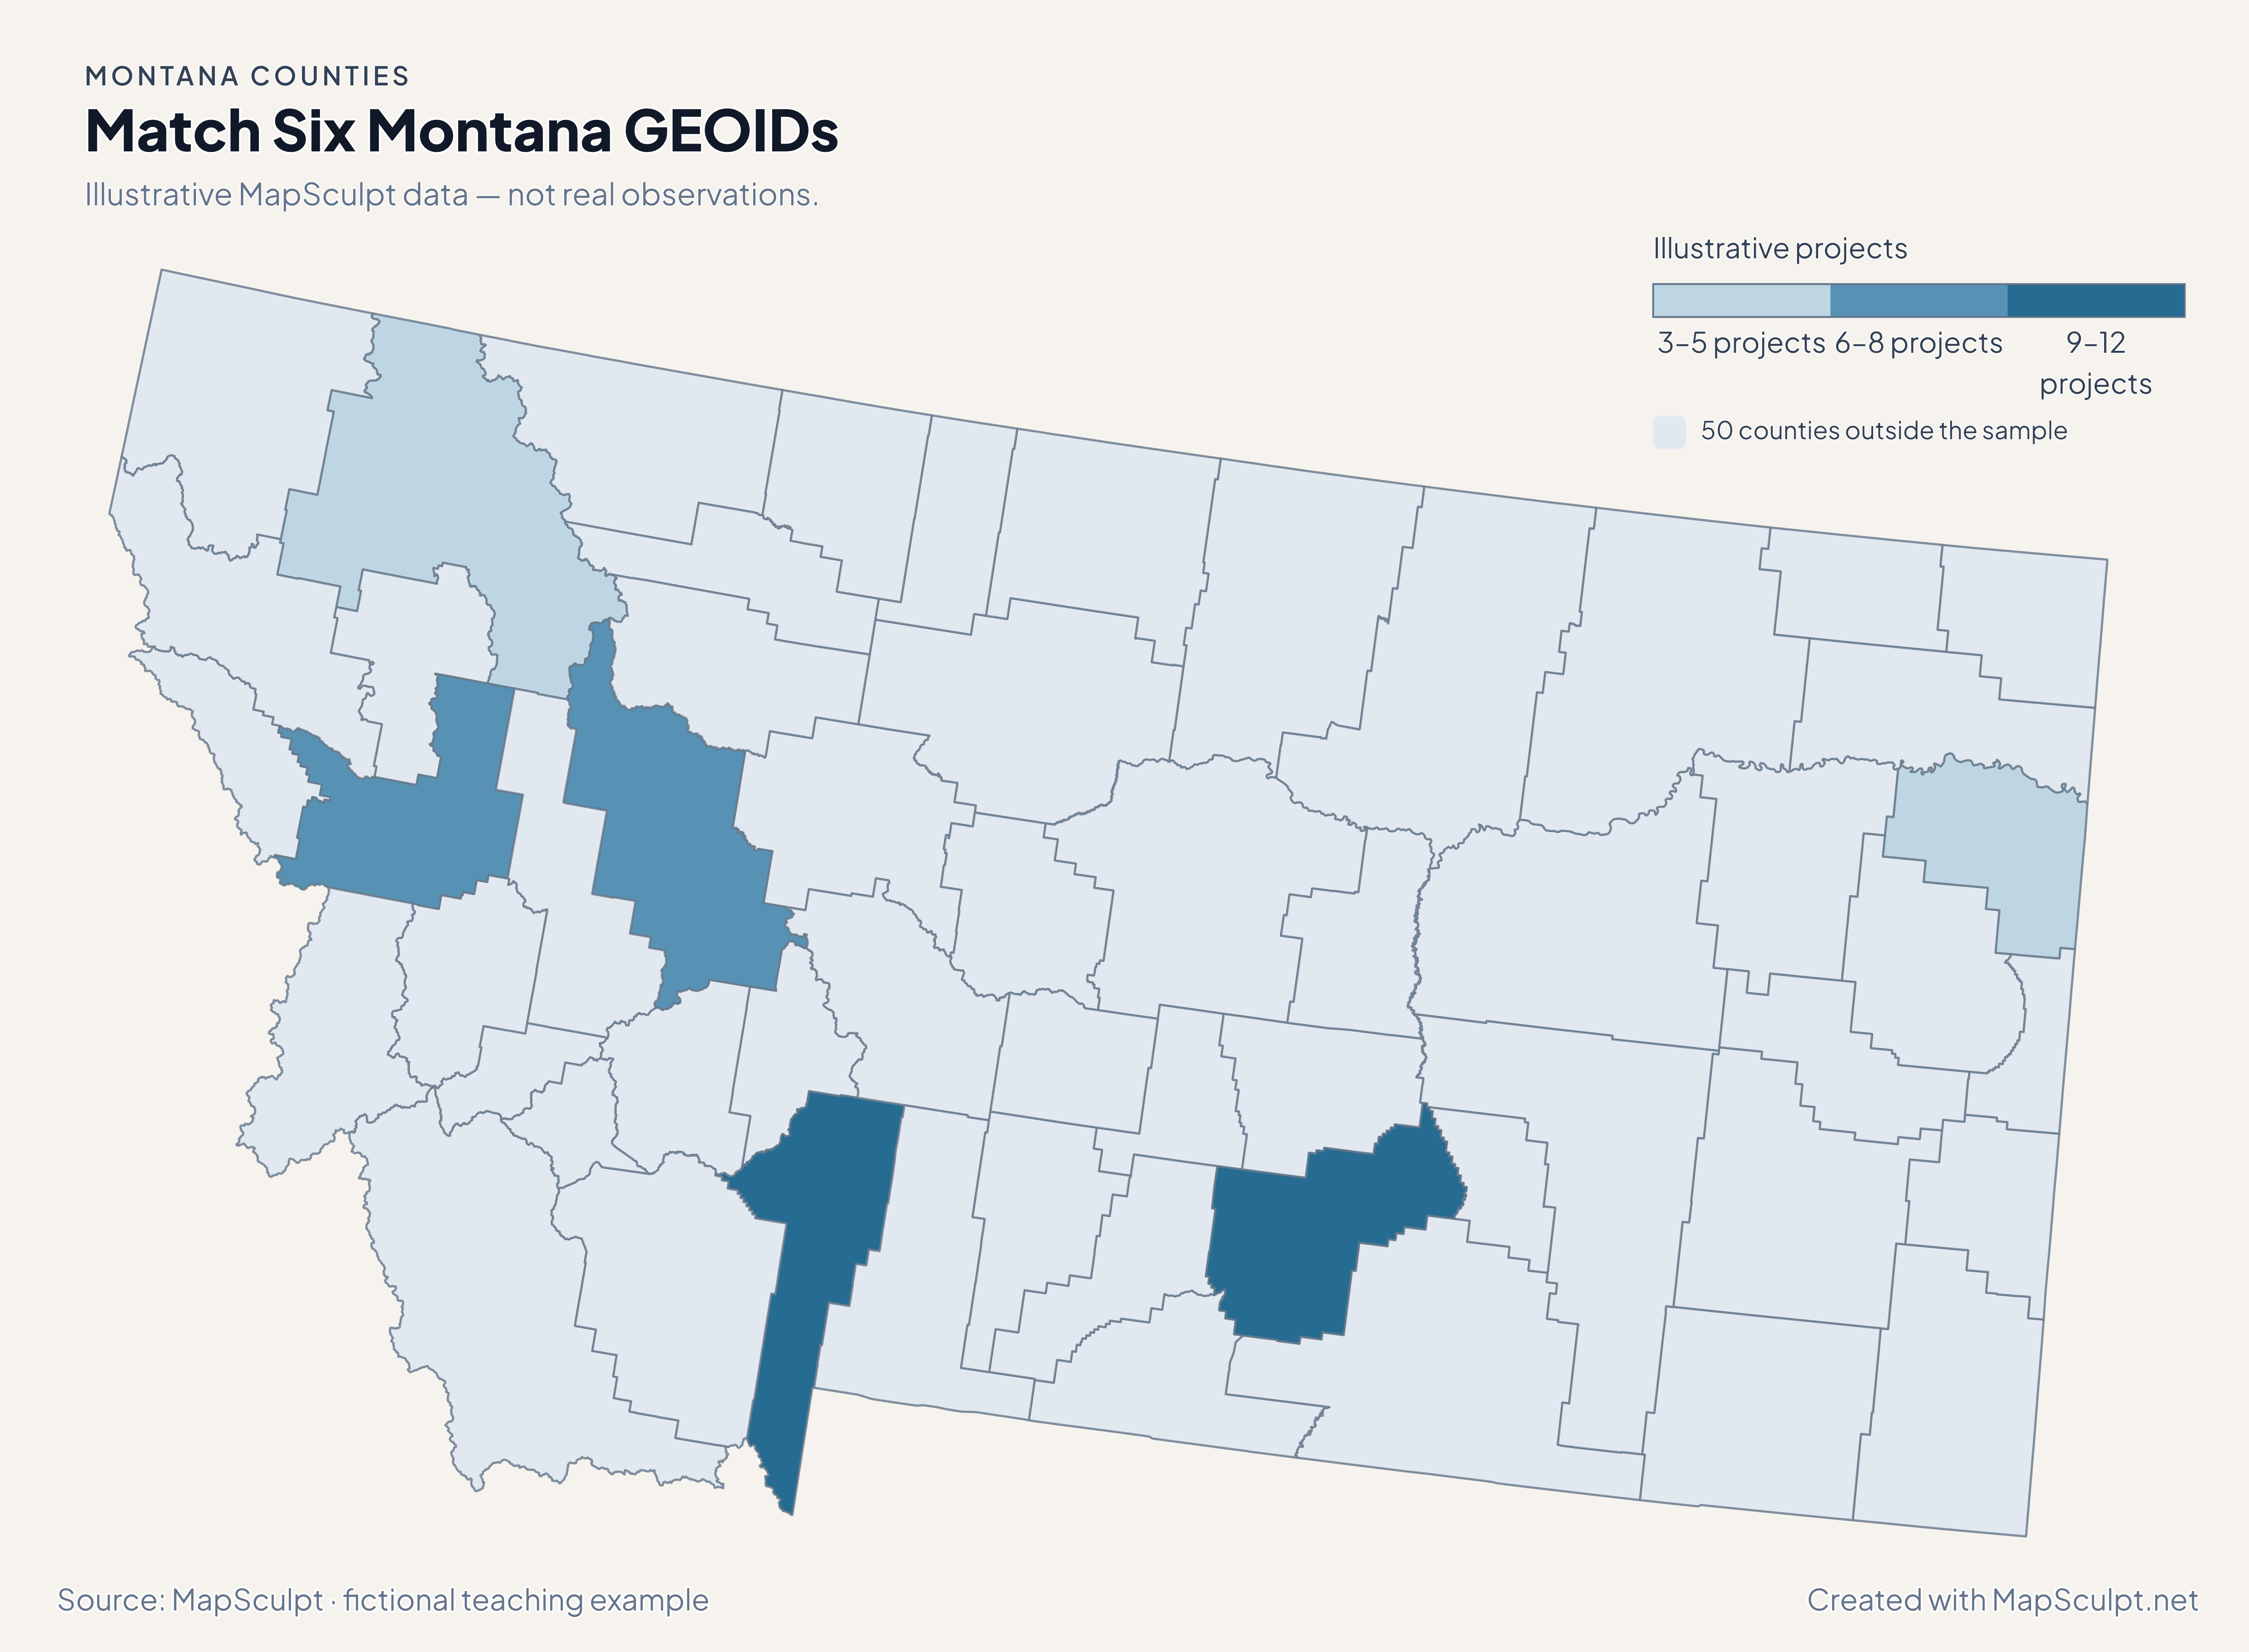
Try matching 6 Montana counties

Compare six counties spanning the west, the state capital, Billings and the eastern plains. The remaining 50 counties are neutral.

Illustrative MapSculpt data — not real observations.
CountyGEOIDProjects
Gallatin County3003112
Missoula County300638
Yellowstone County301119
Flathead County300295
Lewis and Clark County300496
Richland County300833

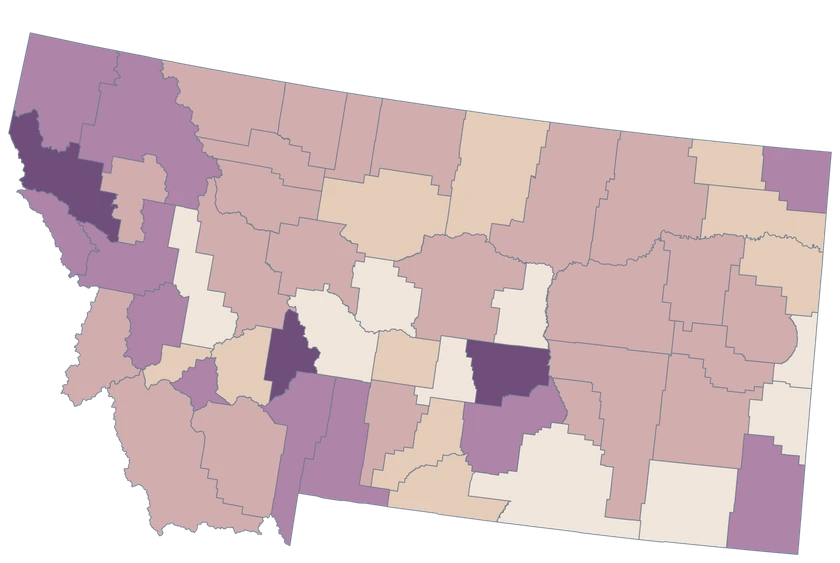
Match the GEOID column (30031 for Gallatin County) and use IllustrativeProjects as the numeric value. Start with boundaries of 3, 6, 9 and 12.

Download illustrative CSV ↓

Match Six Montana GEOIDs

Illustrative MapSculpt data — not real observations.

Illustrative Montana map with 6 styled counties and 50 neutral counties.

Illustrative projects

  • 3–5 projects
  • 6–8 projects
  • 9–12 projects
  • 50 counties outside the sample
Download complete PNG

CSV → Match 6 counties → Style → Export PNG Create a Montana map

COUNTY REFERENCE

Find all 56 Montana counties and GEOIDs.

Official county names and five-digit Census GEOIDs. Search by name or code.

  1. Beaverhead CountyGEOID 30001
  2. Big Horn CountyGEOID 30003
  3. Blaine CountyGEOID 30005
  4. Broadwater CountyGEOID 30007
  5. Carbon CountyGEOID 30009
  6. Carter CountyGEOID 30011
  7. Cascade CountyGEOID 30013
  8. Chouteau CountyGEOID 30015
  9. Custer CountyGEOID 30017
  10. Daniels CountyGEOID 30019
  11. Dawson CountyGEOID 30021
  12. Deer Lodge CountyGEOID 30023
  13. Fallon CountyGEOID 30025
  14. Fergus CountyGEOID 30027
  15. Flathead CountyGEOID 30029
  16. Gallatin CountyGEOID 30031
  17. Garfield CountyGEOID 30033
  18. Glacier CountyGEOID 30035
  19. Golden Valley CountyGEOID 30037
  20. Granite CountyGEOID 30039
  21. Hill CountyGEOID 30041
  22. Jefferson CountyGEOID 30043
  23. Judith Basin CountyGEOID 30045
  24. Lake CountyGEOID 30047
  25. Lewis and Clark CountyGEOID 30049
  26. Liberty CountyGEOID 30051
  27. Lincoln CountyGEOID 30053
  28. Madison CountyGEOID 30057
  29. McCone CountyGEOID 30055
  30. Meagher CountyGEOID 30059
  31. Mineral CountyGEOID 30061
  32. Missoula CountyGEOID 30063
  33. Musselshell CountyGEOID 30065
  34. Park CountyGEOID 30067
  35. Petroleum CountyGEOID 30069
  36. Phillips CountyGEOID 30071
  37. Pondera CountyGEOID 30073
  38. Powder River CountyGEOID 30075
  39. Powell CountyGEOID 30077
  40. Prairie CountyGEOID 30079
  41. Ravalli CountyGEOID 30081
  42. Richland CountyGEOID 30083
  43. Roosevelt CountyGEOID 30085
  44. Rosebud CountyGEOID 30087
  45. Sanders CountyGEOID 30089
  46. Sheridan CountyGEOID 30091
  47. Silver Bow CountyGEOID 30093
  48. Stillwater CountyGEOID 30095
  49. Sweet Grass CountyGEOID 30097
  50. Teton CountyGEOID 30099
  51. Toole CountyGEOID 30101
  52. Treasure CountyGEOID 30103
  53. Valley CountyGEOID 30105
  54. Wheatland CountyGEOID 30107
  55. Wibaux CountyGEOID 30109
  56. Yellowstone CountyGEOID 30111
U.S. Census Bureau · 2025 Cartographic Boundary Files

COMMON QUESTIONS

Montana county map questions.

Is Bozeman a selectable area in this editor?

Bozeman is in Gallatin County. Use GEOID 30031 for the county fill.

Which county contains Billings?

Billings is in Yellowstone County, GEOID 30111.

Can I use reservation-level data directly in this county map?

Use a Tribal geography layer for reservation-level data. Tribal boundaries and county boundaries define different reporting areas.

Why can a small Montana county have a high growth rate?

A modest change becomes a larger percentage when the starting population is small. Compare counts and rates together.

How do I join Lewis and Clark County in a CSV?

Use 30049. The GEOID avoids ambiguity over punctuation and spacing in a name column.

What does domestic migration count here?

The rate measures net moves within the United States relative to county population. It excludes international migration and does not capture total population change.

YOUR NEXT MAP STARTS HERE

Build a Montana county map with your own measurements

Join the official GEOIDs and export a clearly labeled county view.

Create a Montana map