Skip to content
MapSculpt

North America Map Maker

Create Your Own Map of North America

Create a custom map of North America, from Canada and the United States to Central America and the Caribbean. Color countries and territories, import CSV data, customize your legend, and export a polished PNG.

Free online editor · No sign-up required

37selectable areas, including 21 sovereign countries and 16 other areas

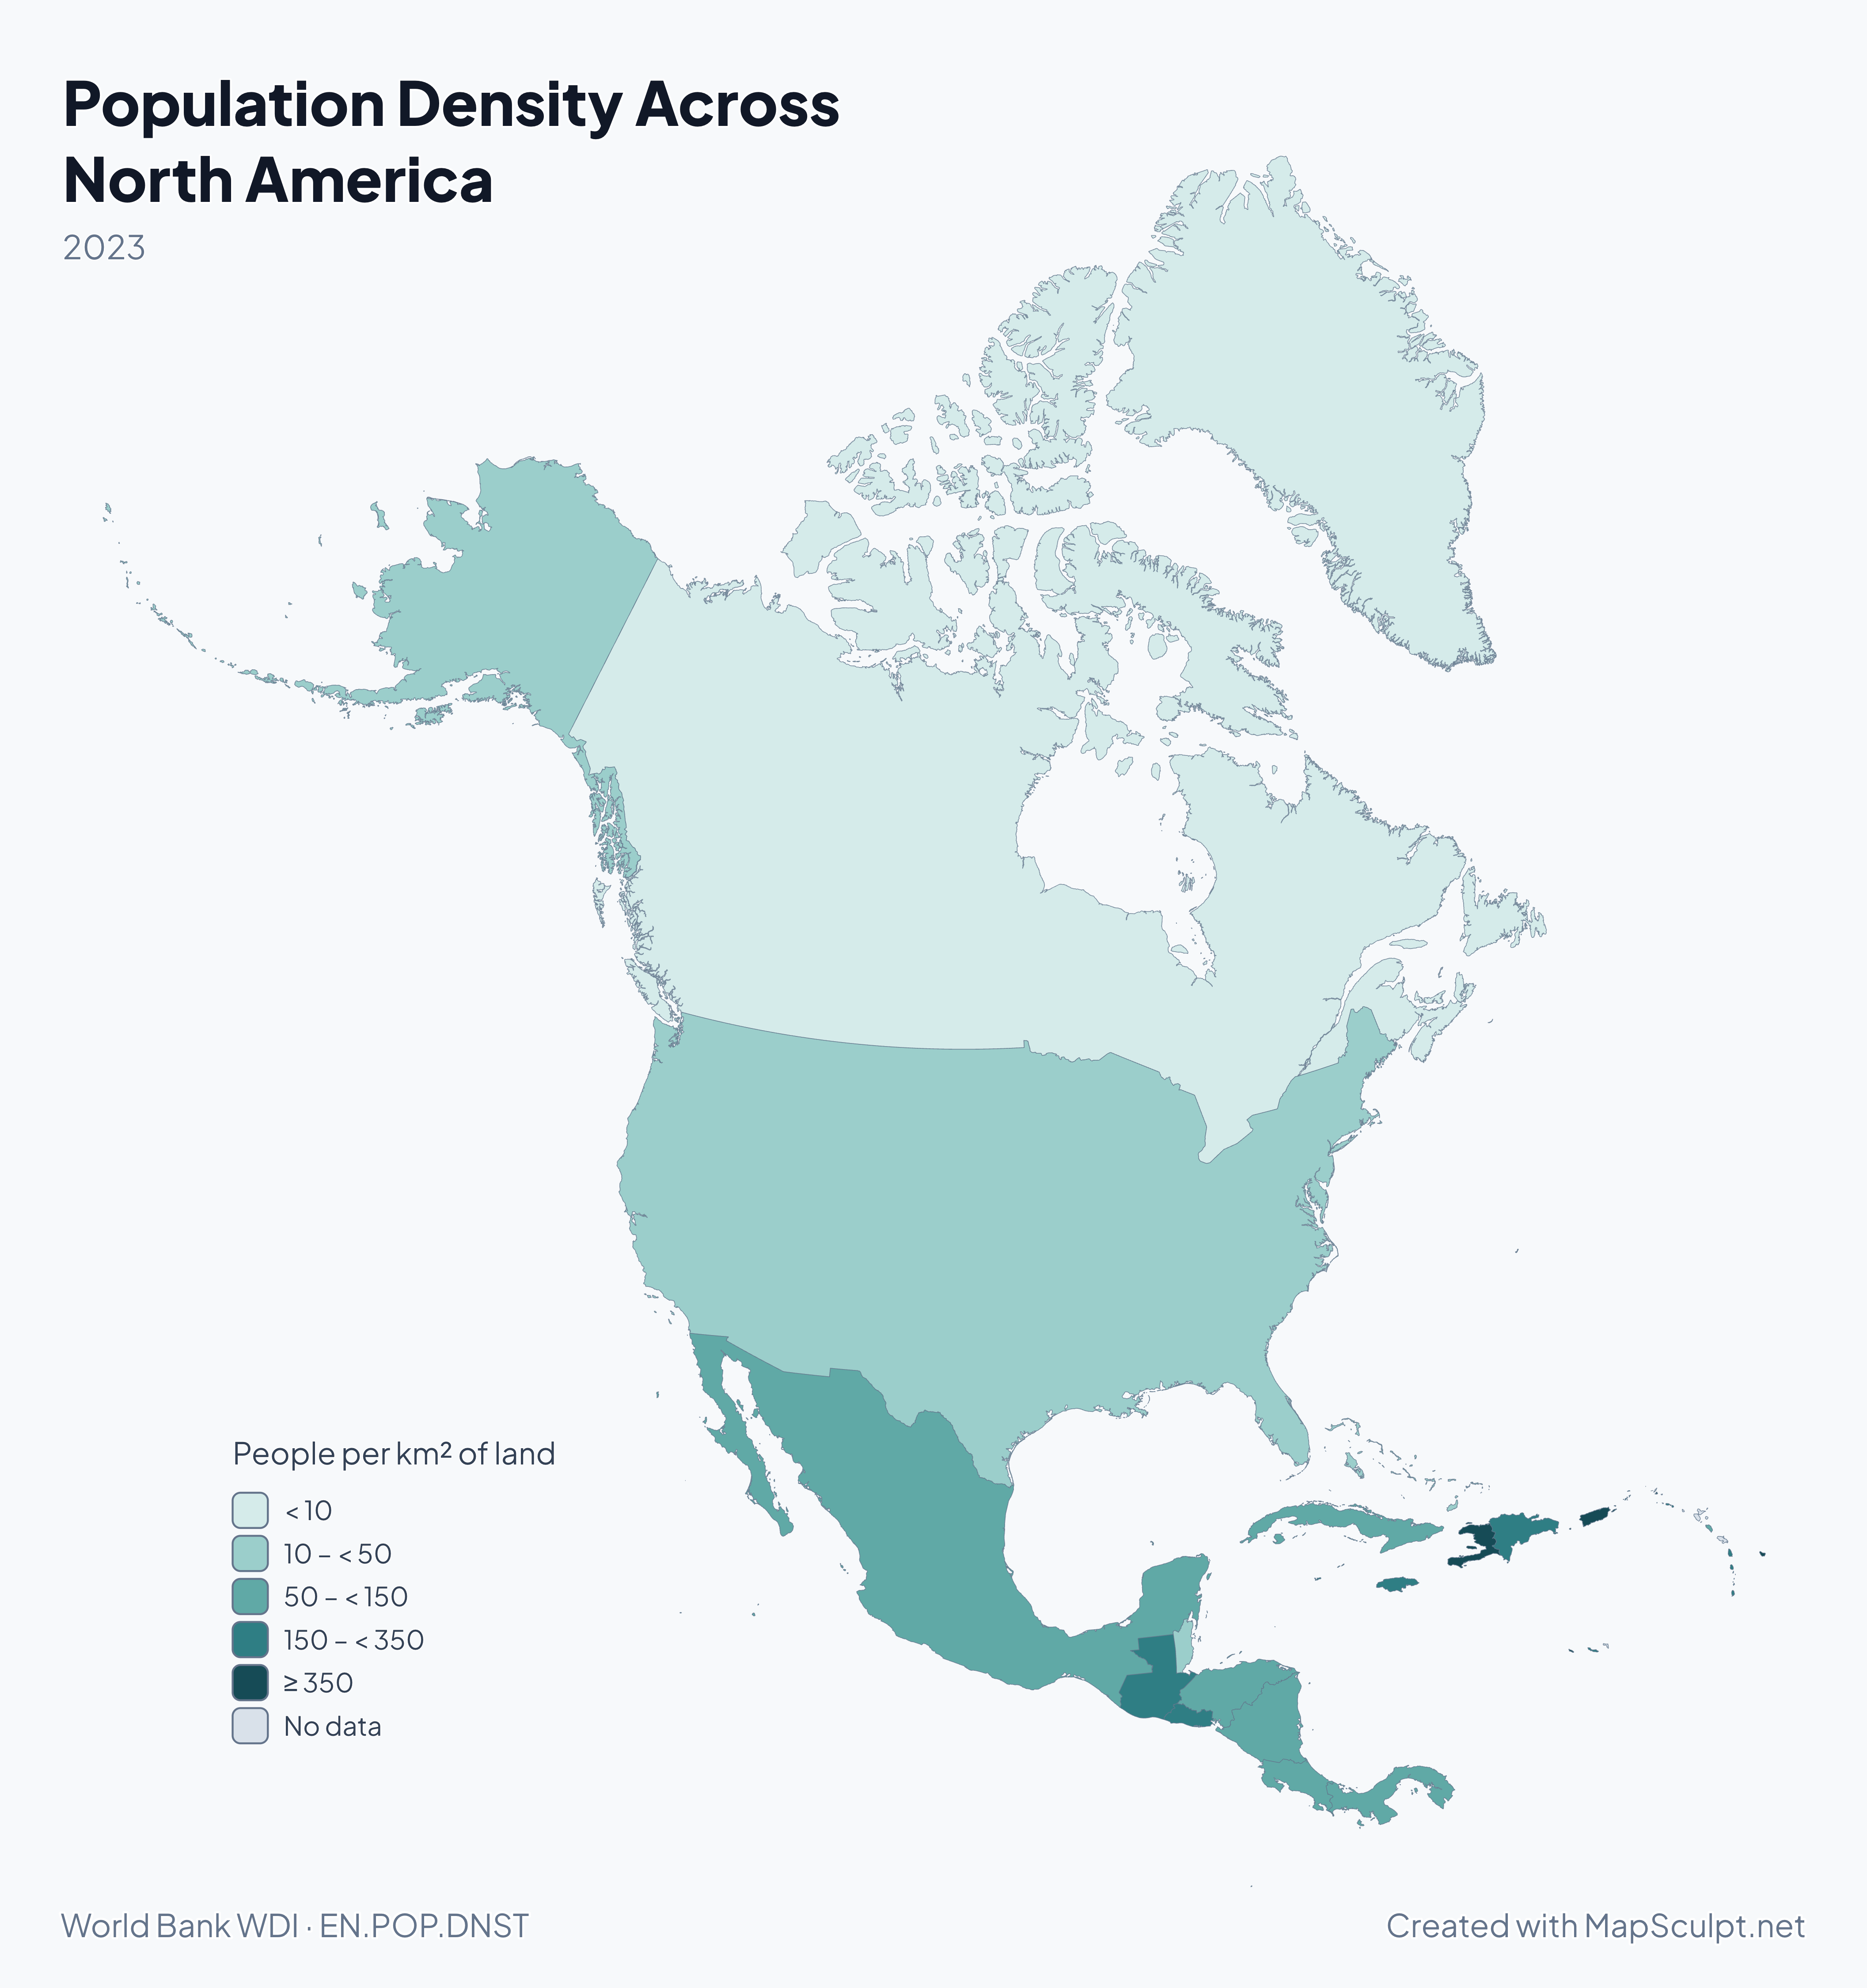
Population Density Across North America

North America population density choropleth with increasingly dark teal for higher density and gray for missing data.

People per km² of land

  • < 10
  • 10 – < 50
  • 50 – < 150
  • 150 – < 350
  • ≥ 350
  • No data

2023 · Greenland and Barbados sit at opposite ends of this scale. The World Bank reports 0.14 people per km² of land in Greenland and 656.6 in Barbados. These are country or territory averages. The map cannot show how people are distributed within an area. 31 of 37 selectable areas have data. 6 have no observation for the stated period.

Know your geography

23 countries. One continent.

  • Northern mainland

    Canada, the United States and Mexico.

  • Central America

    Belize, Guatemala, El Salvador, Honduras, Nicaragua, Costa Rica and Panama.

  • Caribbean

    13 sovereign island countries, including Cuba, Jamaica, and the two countries on Hispaniola, Haiti and the Dominican Republic.

Greenland, Puerto Rico and other non-sovereign territories also belong to the region. The editor covers 21 of the 23 sovereign countries.

These groups use an editorial convention. The UN M49 statistical standard places Mexico in Central America and calls its northern subregion Northern America. UN M49

Explore the country directory

Official data · Map examples

North America in Four Maps

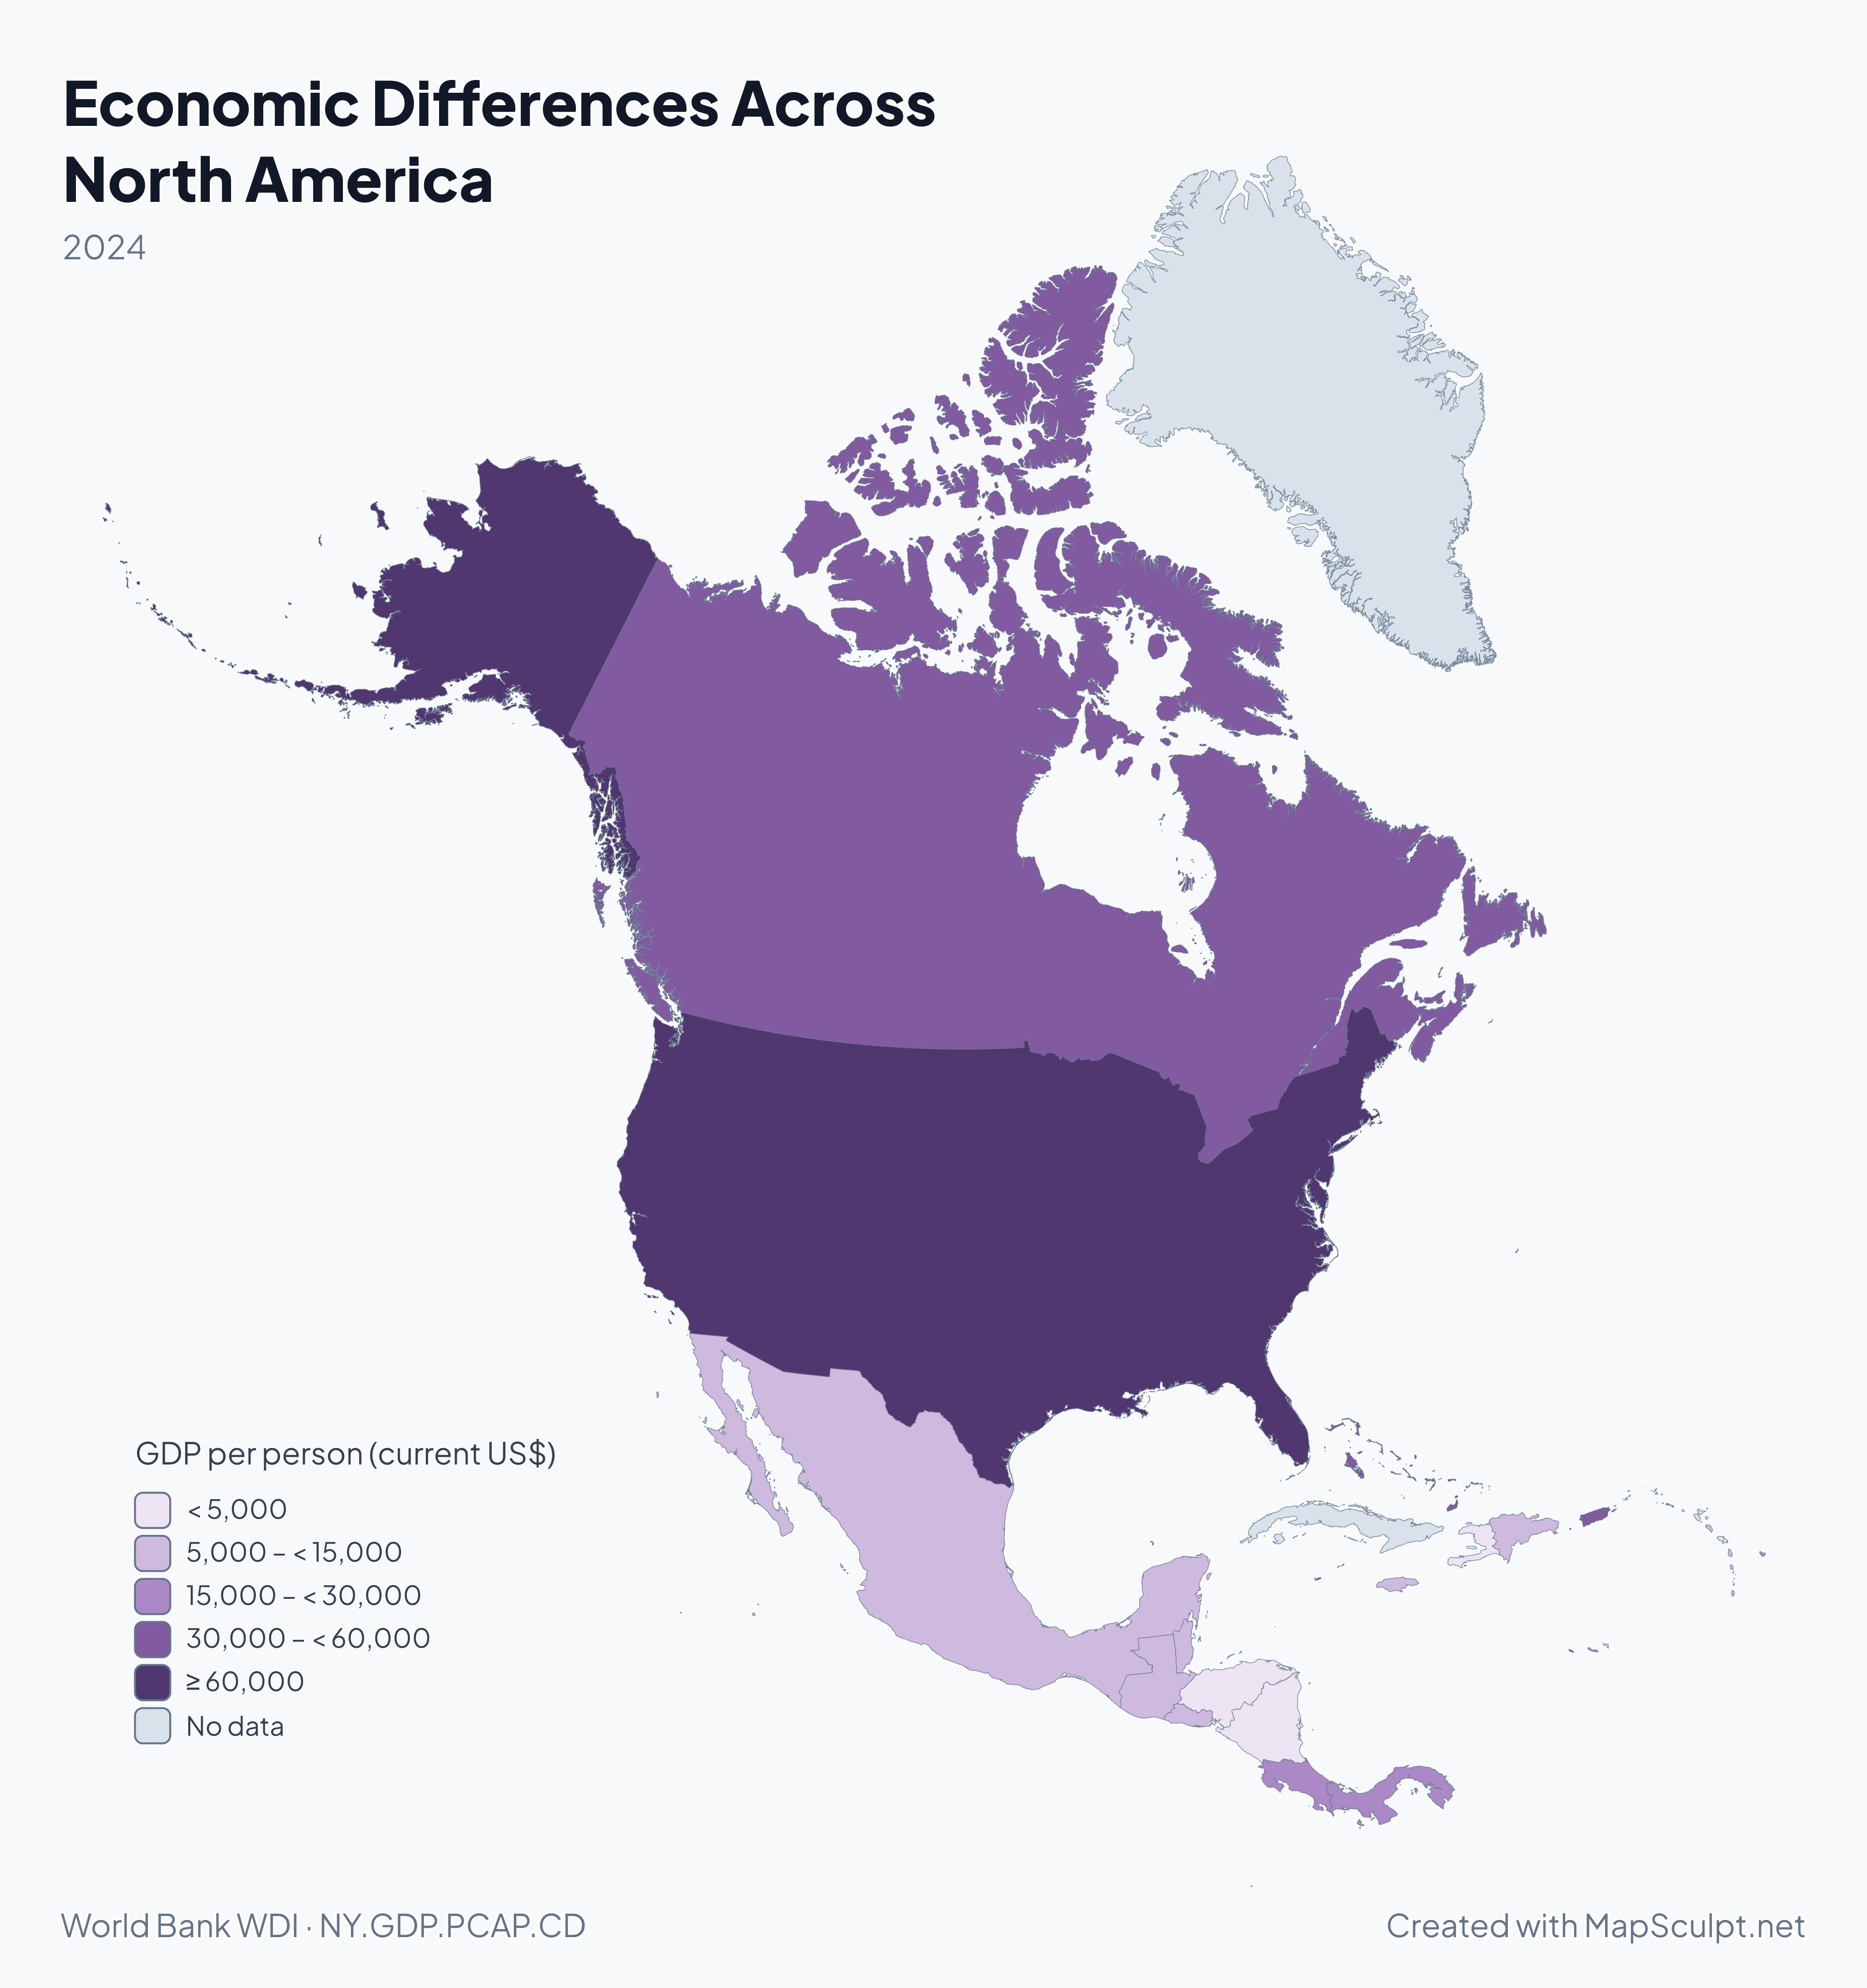
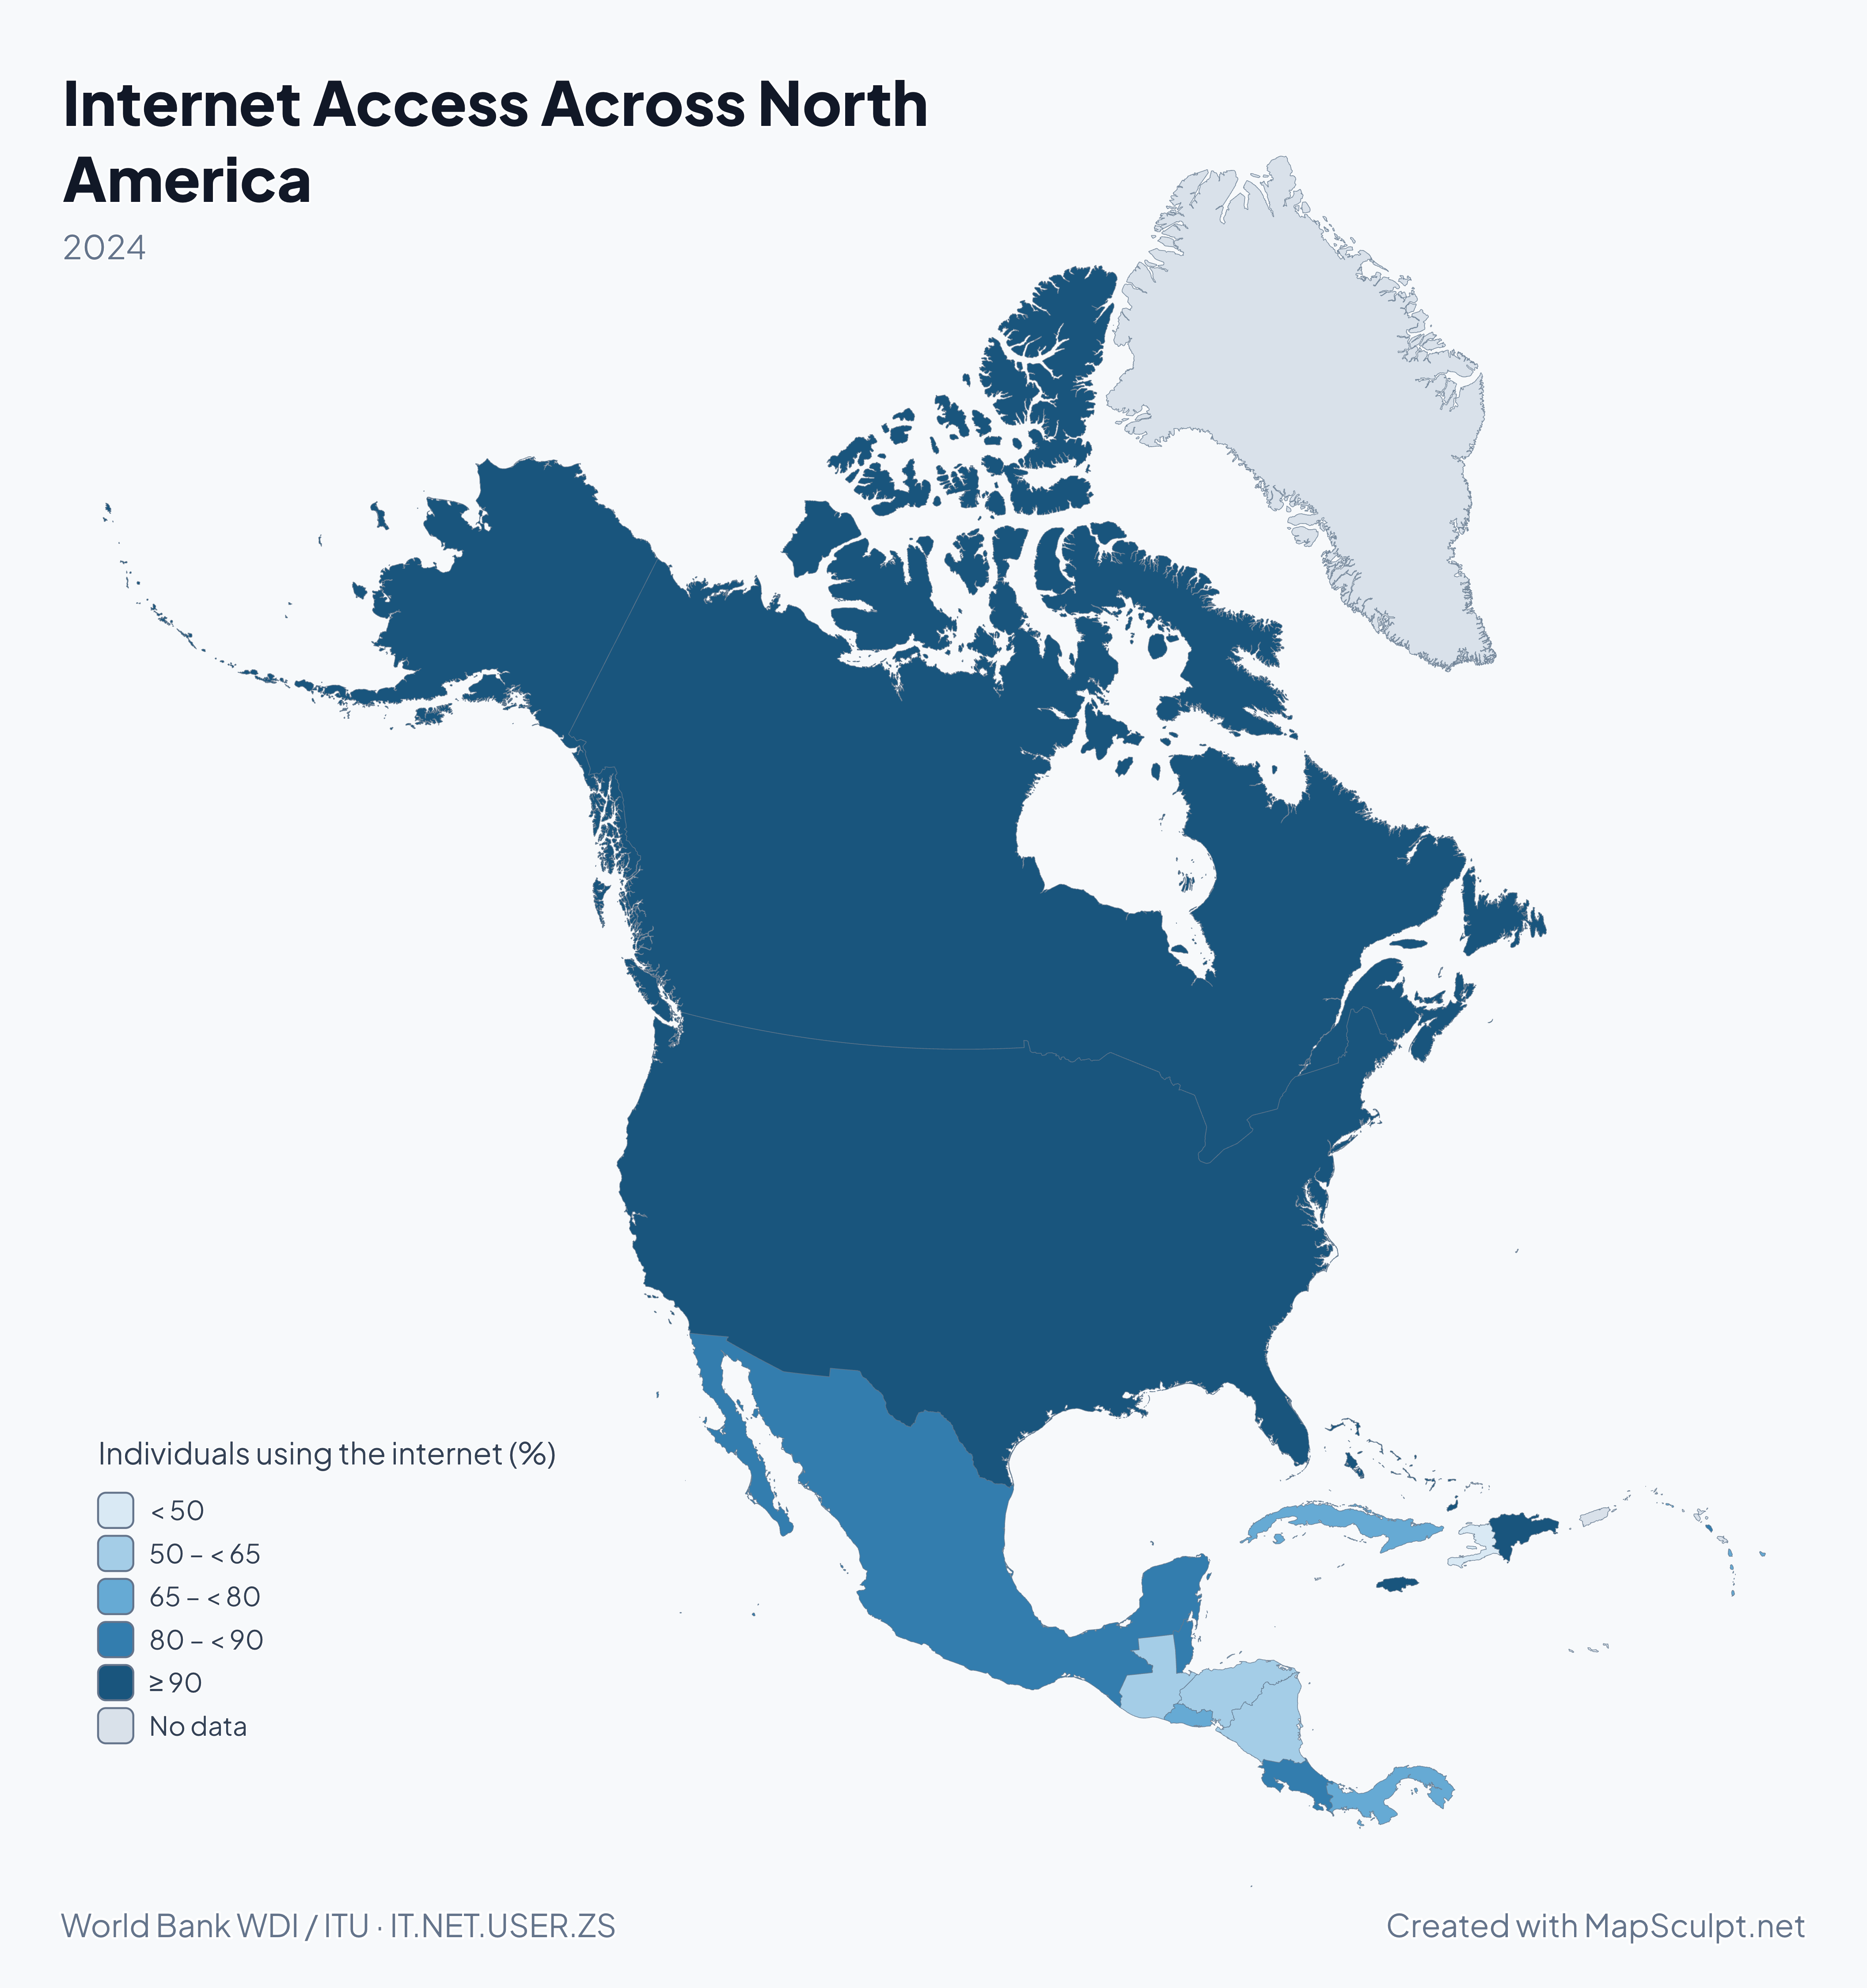
Start with population density above, then compare how populations have changed, how much economies produce per person, and how widely people use the internet.

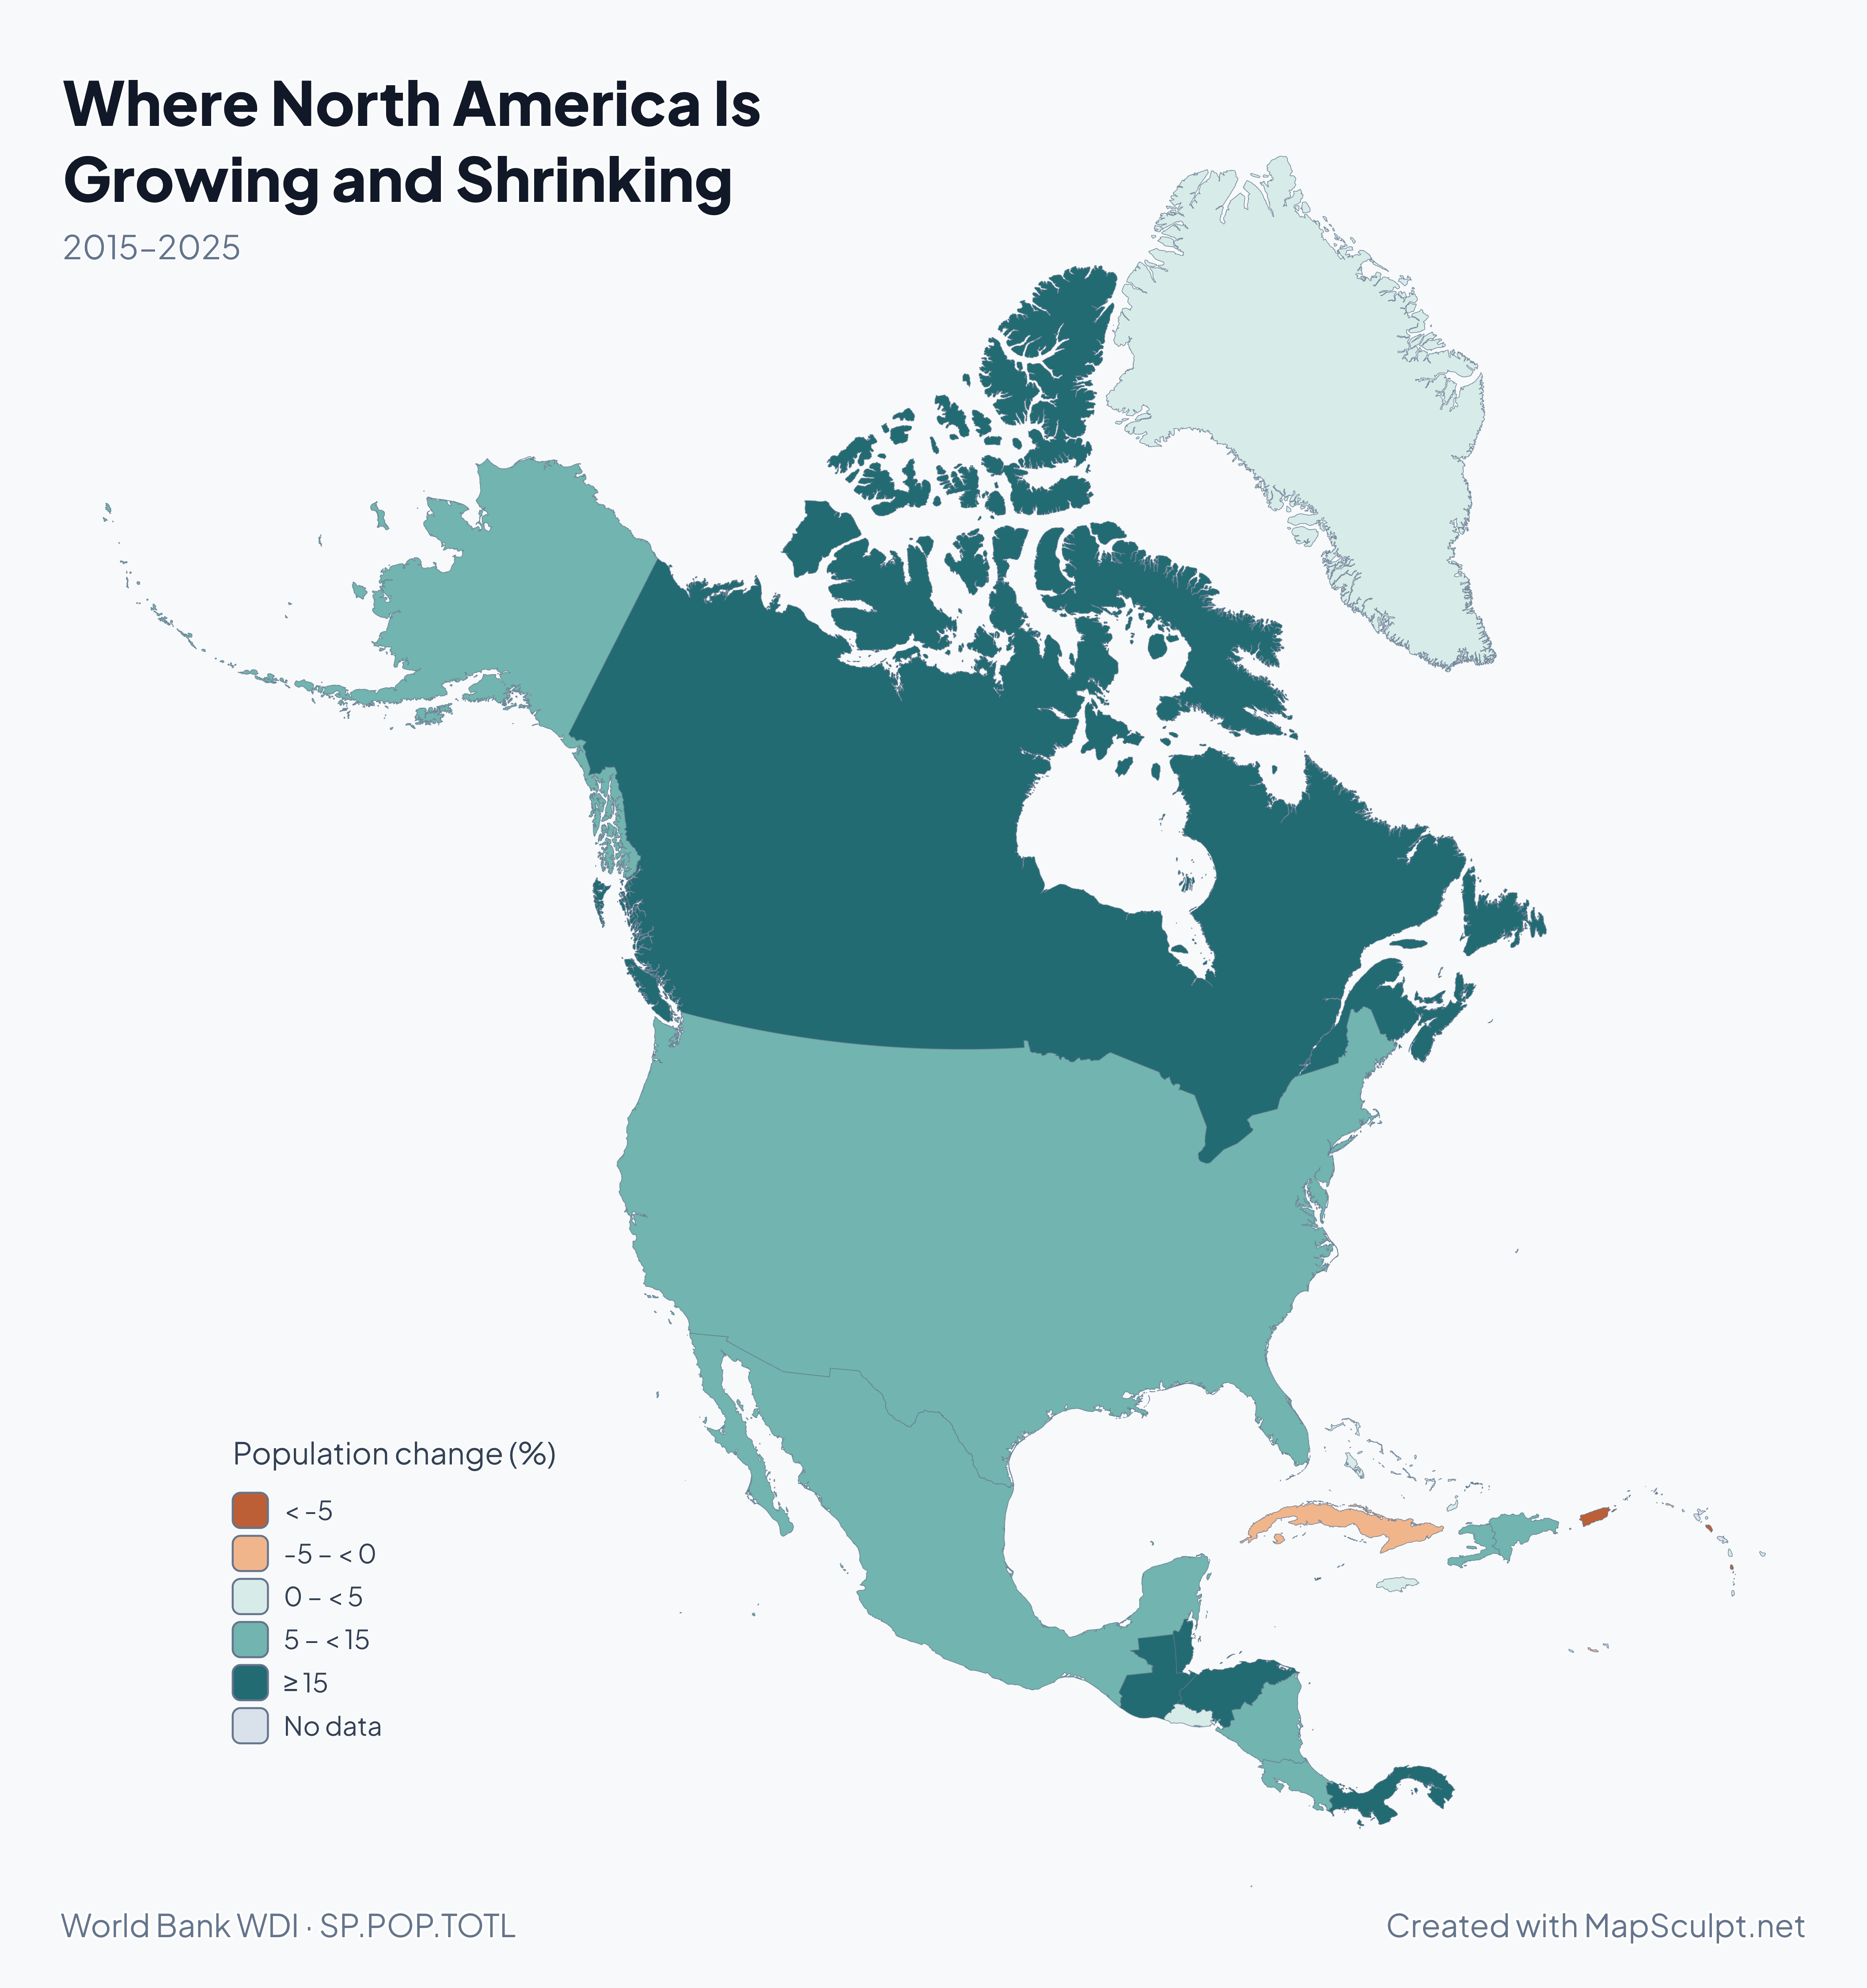
North America population change map with orange for decline and teal for growth.

2015–2025

Where North America Is Growing and Shrinking

Canada’s population rose by 16.7%, while Puerto Rico’s fell by 9.9% in the same decade. The diverging scale puts losses and gains on opposite sides of zero.

Population change (%)

  • < -5
  • -5 – < 0
  • 0 – < 5
  • 5 – < 15
  • ≥ 15
  • No data

31 of 37 selectable areas have data. 6 have no observation for the stated period. Each rate is the difference between the two population estimates divided by the starting estimate. The indicator combines all causes of change and does not measure migration on its own.

World Bank WDI · SP.POP.TOTL

From Country Data to a Finished Map

  1. Choose countries and territories

    Select and color supported areas in the North America editor.

  2. Import your CSV

    Match values or categories to the map using the supported geographic identifiers.

  3. Customize your map

    Set colors, a title, a legend, and a source line.

  4. Export your PNG

    Choose a canvas format, background, and export resolution.

Illustrative CSV

From Spreadsheet to North America Travel Map

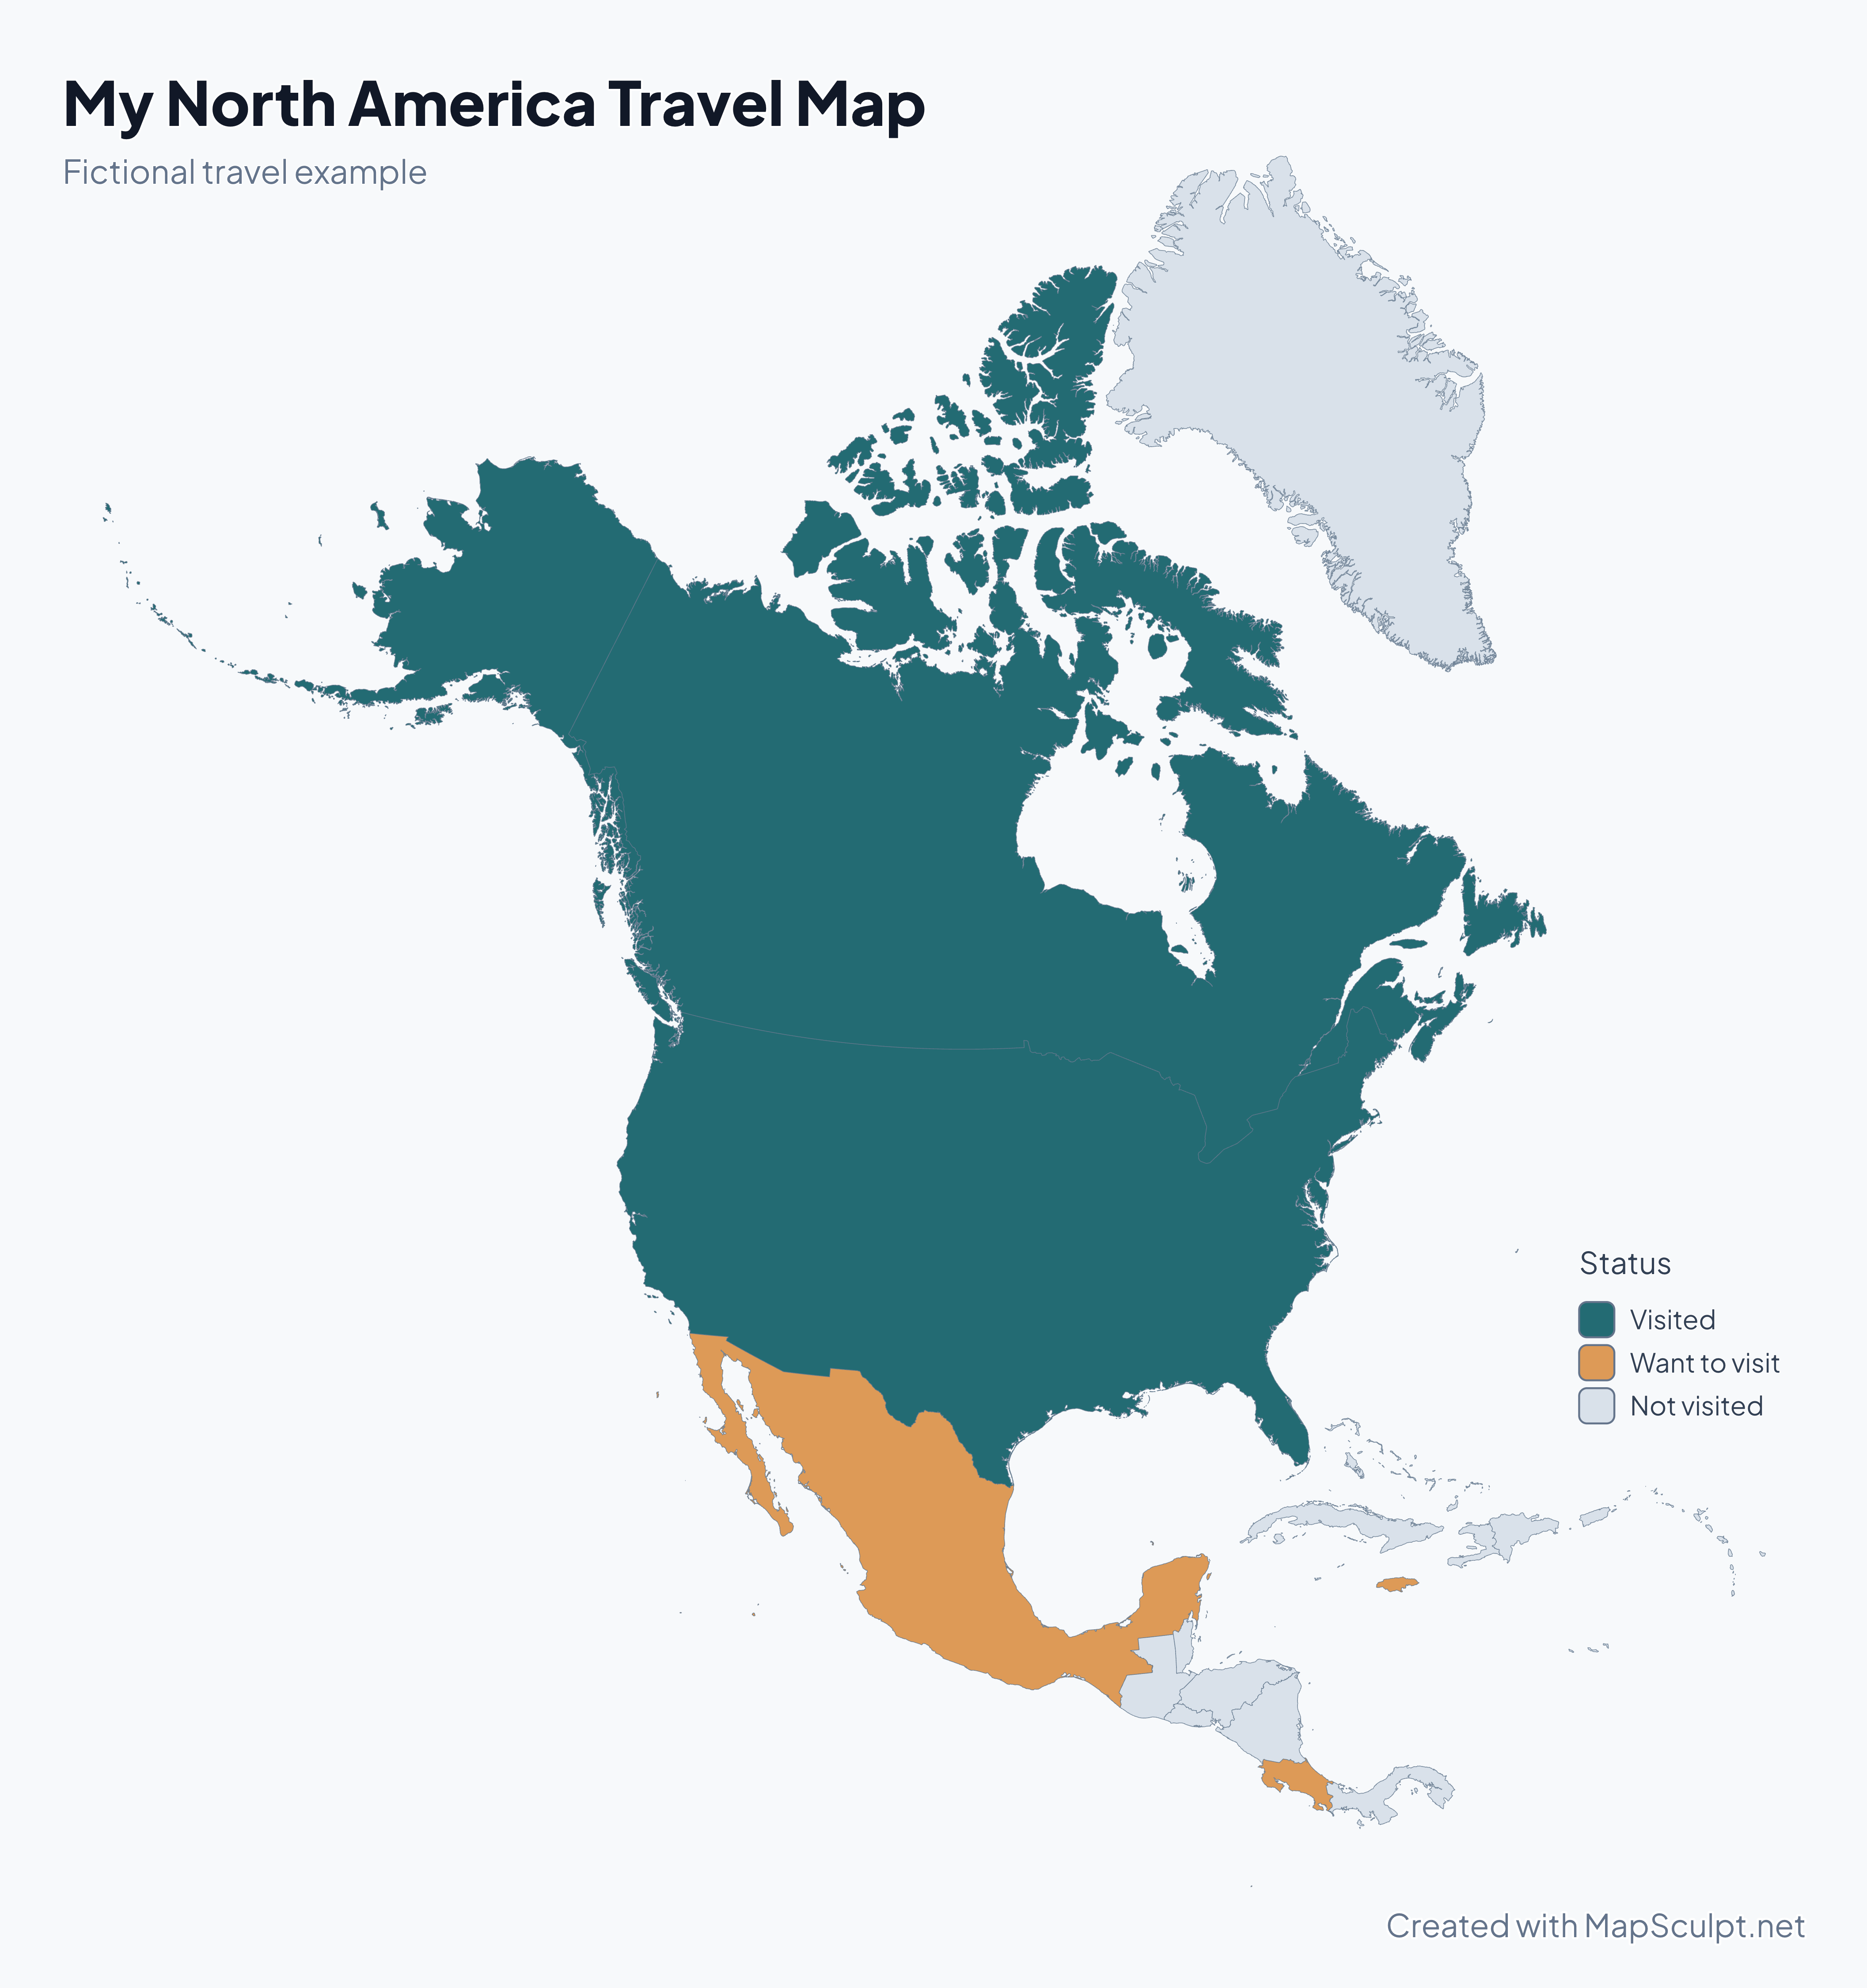
Try a fictional travel log. The CSV uses two-letter editor IDs to match each row to the right area.

Sample from the travel CSV
CountryISO2Status
CanadaCAVisited
United StatesUSVisited
Costa RicaCRWant to visit
JamaicaJMWant to visit
MexicoMXWant to visit

The download covers all selectable areas. Gray marks places listed as Not visited.

Download travel CSV

My North America Travel Map

Fictional North America travel map highlighting Canada and the United States as visited, and Mexico, Costa Rica, and Jamaica as destinations.

Status

  • Visited
  • Want to visit
  • Not visited
Create a North America MapDownload full-resolution PNG

Countries and geographic reference

Countries and Capitals of North America

Search the 23 sovereign countries by name, country code, or capital. Each card shows its ISO alpha-3 code.

  1. ATG
    Antigua & BarbudaCapital · Saint John'sCaribbeanUnavailable in the editor
  2. BHS
    BahamasCapital · NassauCaribbean
  3. BRB
    BarbadosCapital · BridgetownCaribbean
  4. BLZ
    BelizeCapital · BelmopanCentral America
  5. CAN
    CanadaCapital · OttawaNorthern mainland
  6. CRI
    Costa RicaCapital · San JoséCentral America
  7. CUB
    CubaCapital · HavanaCaribbean
  8. DMA
    DominicaCapital · RoseauCaribbean
  9. DOM
    Dominican RepublicCapital · Santo DomingoCaribbean
  10. SLV
    El SalvadorCapital · San SalvadorCentral America
  11. GRD
    GrenadaCapital · St. George’sCaribbean
  12. GTM
    GuatemalaCapital · Guatemala CityCentral America
  13. HTI
    HaitiCapital · Port-au-PrinceCaribbean
  14. HND
    HondurasCapital · TegucigalpaCentral America
  15. JAM
    JamaicaCapital · KingstonCaribbean
  16. MEX
    MexicoCapital · Mexico CityNorthern mainland
  17. NIC
    NicaraguaCapital · ManaguaCentral America
  18. PAN
    PanamaCapital · Panama CityCentral America
  19. KNA
    St. Kitts & NevisCapital · BasseterreCaribbean
  20. LCA
    St. LuciaCapital · CastriesCaribbean
  21. VCT
    St. Vincent & GrenadinesCapital · KingstownCaribbean
  22. TTO
    Trinidad & TobagoCapital · Port of SpainCaribbeanUnavailable in the editor
  23. USA
    United StatesCapital · Washington, DCNorthern mainland
Other selectable areas · 16
  • Anguilla
  • Aruba
  • Bermuda
  • British Virgin Islands
  • Caribbean Netherlands
  • Cayman Islands
  • Curaçao
  • Greenland
  • Guadeloupe
  • Martinique
  • Montserrat
  • Puerto Rico
  • Sint Maarten
  • St. Barthélemy
  • St. Martin
  • Turks & Caicos Islands

What’s the Difference Between North America and the Americas?

North America includes Central America and the Caribbean. The Americas cover both North and South America. For a closer look, open a country map or a national subdivision map.

THE MAPSCULPT COLLECTION

Choose your map.

Find your geography. Add your perspective.

98 maps / 8 collections

Countries, regions and counties. Ready for your ideas.

Sort maps

California

Counties

Texas

Counties

Florida

Counties

New York

Counties

Pennsylvania

Counties

Illinois

Counties

Ohio

Counties

Georgia

Counties

North Carolina

Counties

Michigan

Counties

New Jersey

Counties

Virginia

Counties

1–12 of 50 state maps

North America Map Questions

How many countries are in North America?

There are 23 sovereign countries: three on the northern mainland in this guide, seven in Central America, and 13 in the Caribbean.

Is Central America part of North America?

Yes. It links the northern mainland to South America. UN M49 also includes Mexico in Central America.

Is the Caribbean part of North America?

Yes. The Caribbean is part of North America in this guide and in the UN M49 continental grouping.

Is Greenland part of North America?

Geographically, yes. Greenland is a self-governing part of the Kingdom of Denmark and can be colored separately in the editor.

Can I create a blank map of North America?

Yes. Start with an uncolored map and add only the fills, labels, and legend you need before exporting.

Can I color North American countries individually?

Yes. Choose a color and select an area. The editor offers 37 selectable areas, including 21 sovereign countries.

Can I import CSV data into my North America map?

Yes. Use the two-letter IDs in the sample CSV. Review the matched rows before applying your colors.

Can I export a high-resolution PNG?

Yes. The export panel offers multiple resolutions and previews the result before download.

Are all countries and territories included?

Coverage follows the editor’s Natural Earth geography. Antigua and Barbuda and Trinidad and Tobago are among the areas without a separate selectable shape.

Is MapSculpt free to use?

Yes. You can create, color, and export your map without signing up.

Start mapping

Make North America’s Geography Your Own.
Start with a country map. Add your data, colors, and perspective. Create something worth sharing.
Create a North America Map