

UK & Ireland / Regional maps
UK & Ireland Regions Map Maker
Colour all 15 regions across the United Kingdom and the Republic of Ireland. Import your data, customise individual areas and download a high-resolution map for your next presentation or report.
15 editable regions · Custom colours · CSV import · High-resolution PNG
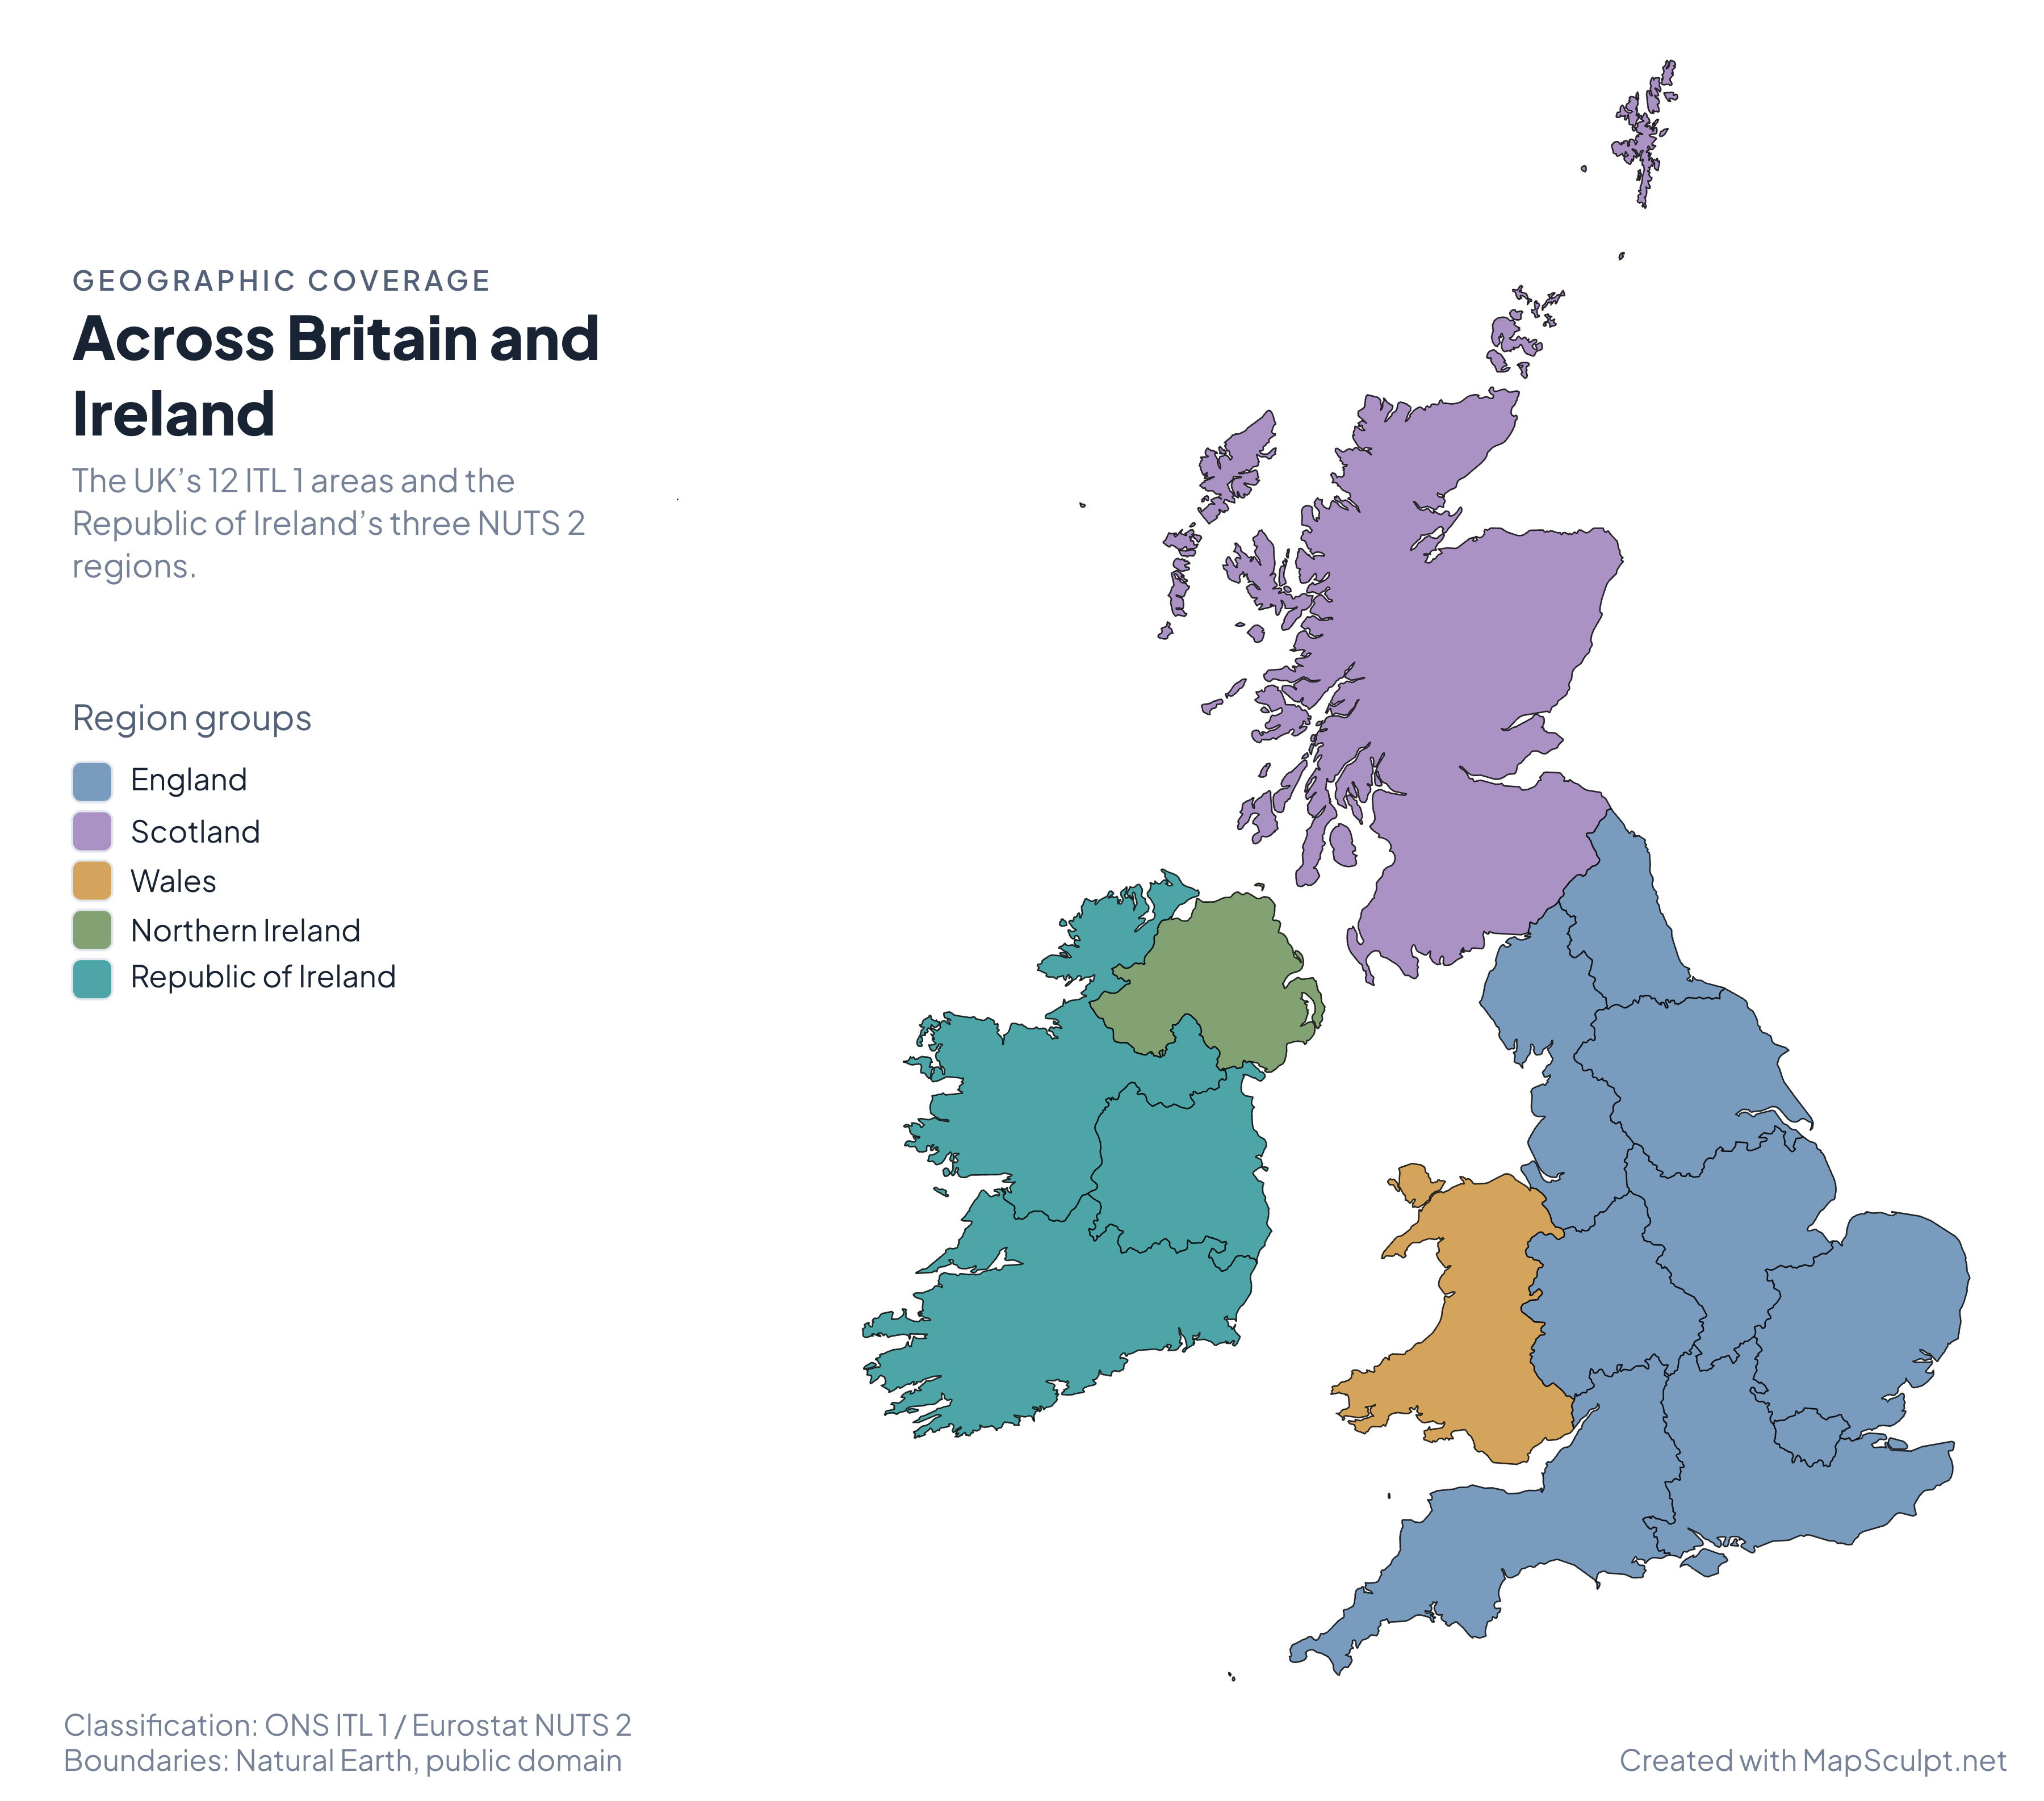
Geographic coverage
Across Britain and Ireland
The UK’s 12 ITL 1 areas and the Republic of Ireland’s three NUTS 2 regions.

Region groups
- England
- Scotland
- Wales
- Northern Ireland
- Republic of Ireland
Made with MapSculpt
One map. Many perspectives.
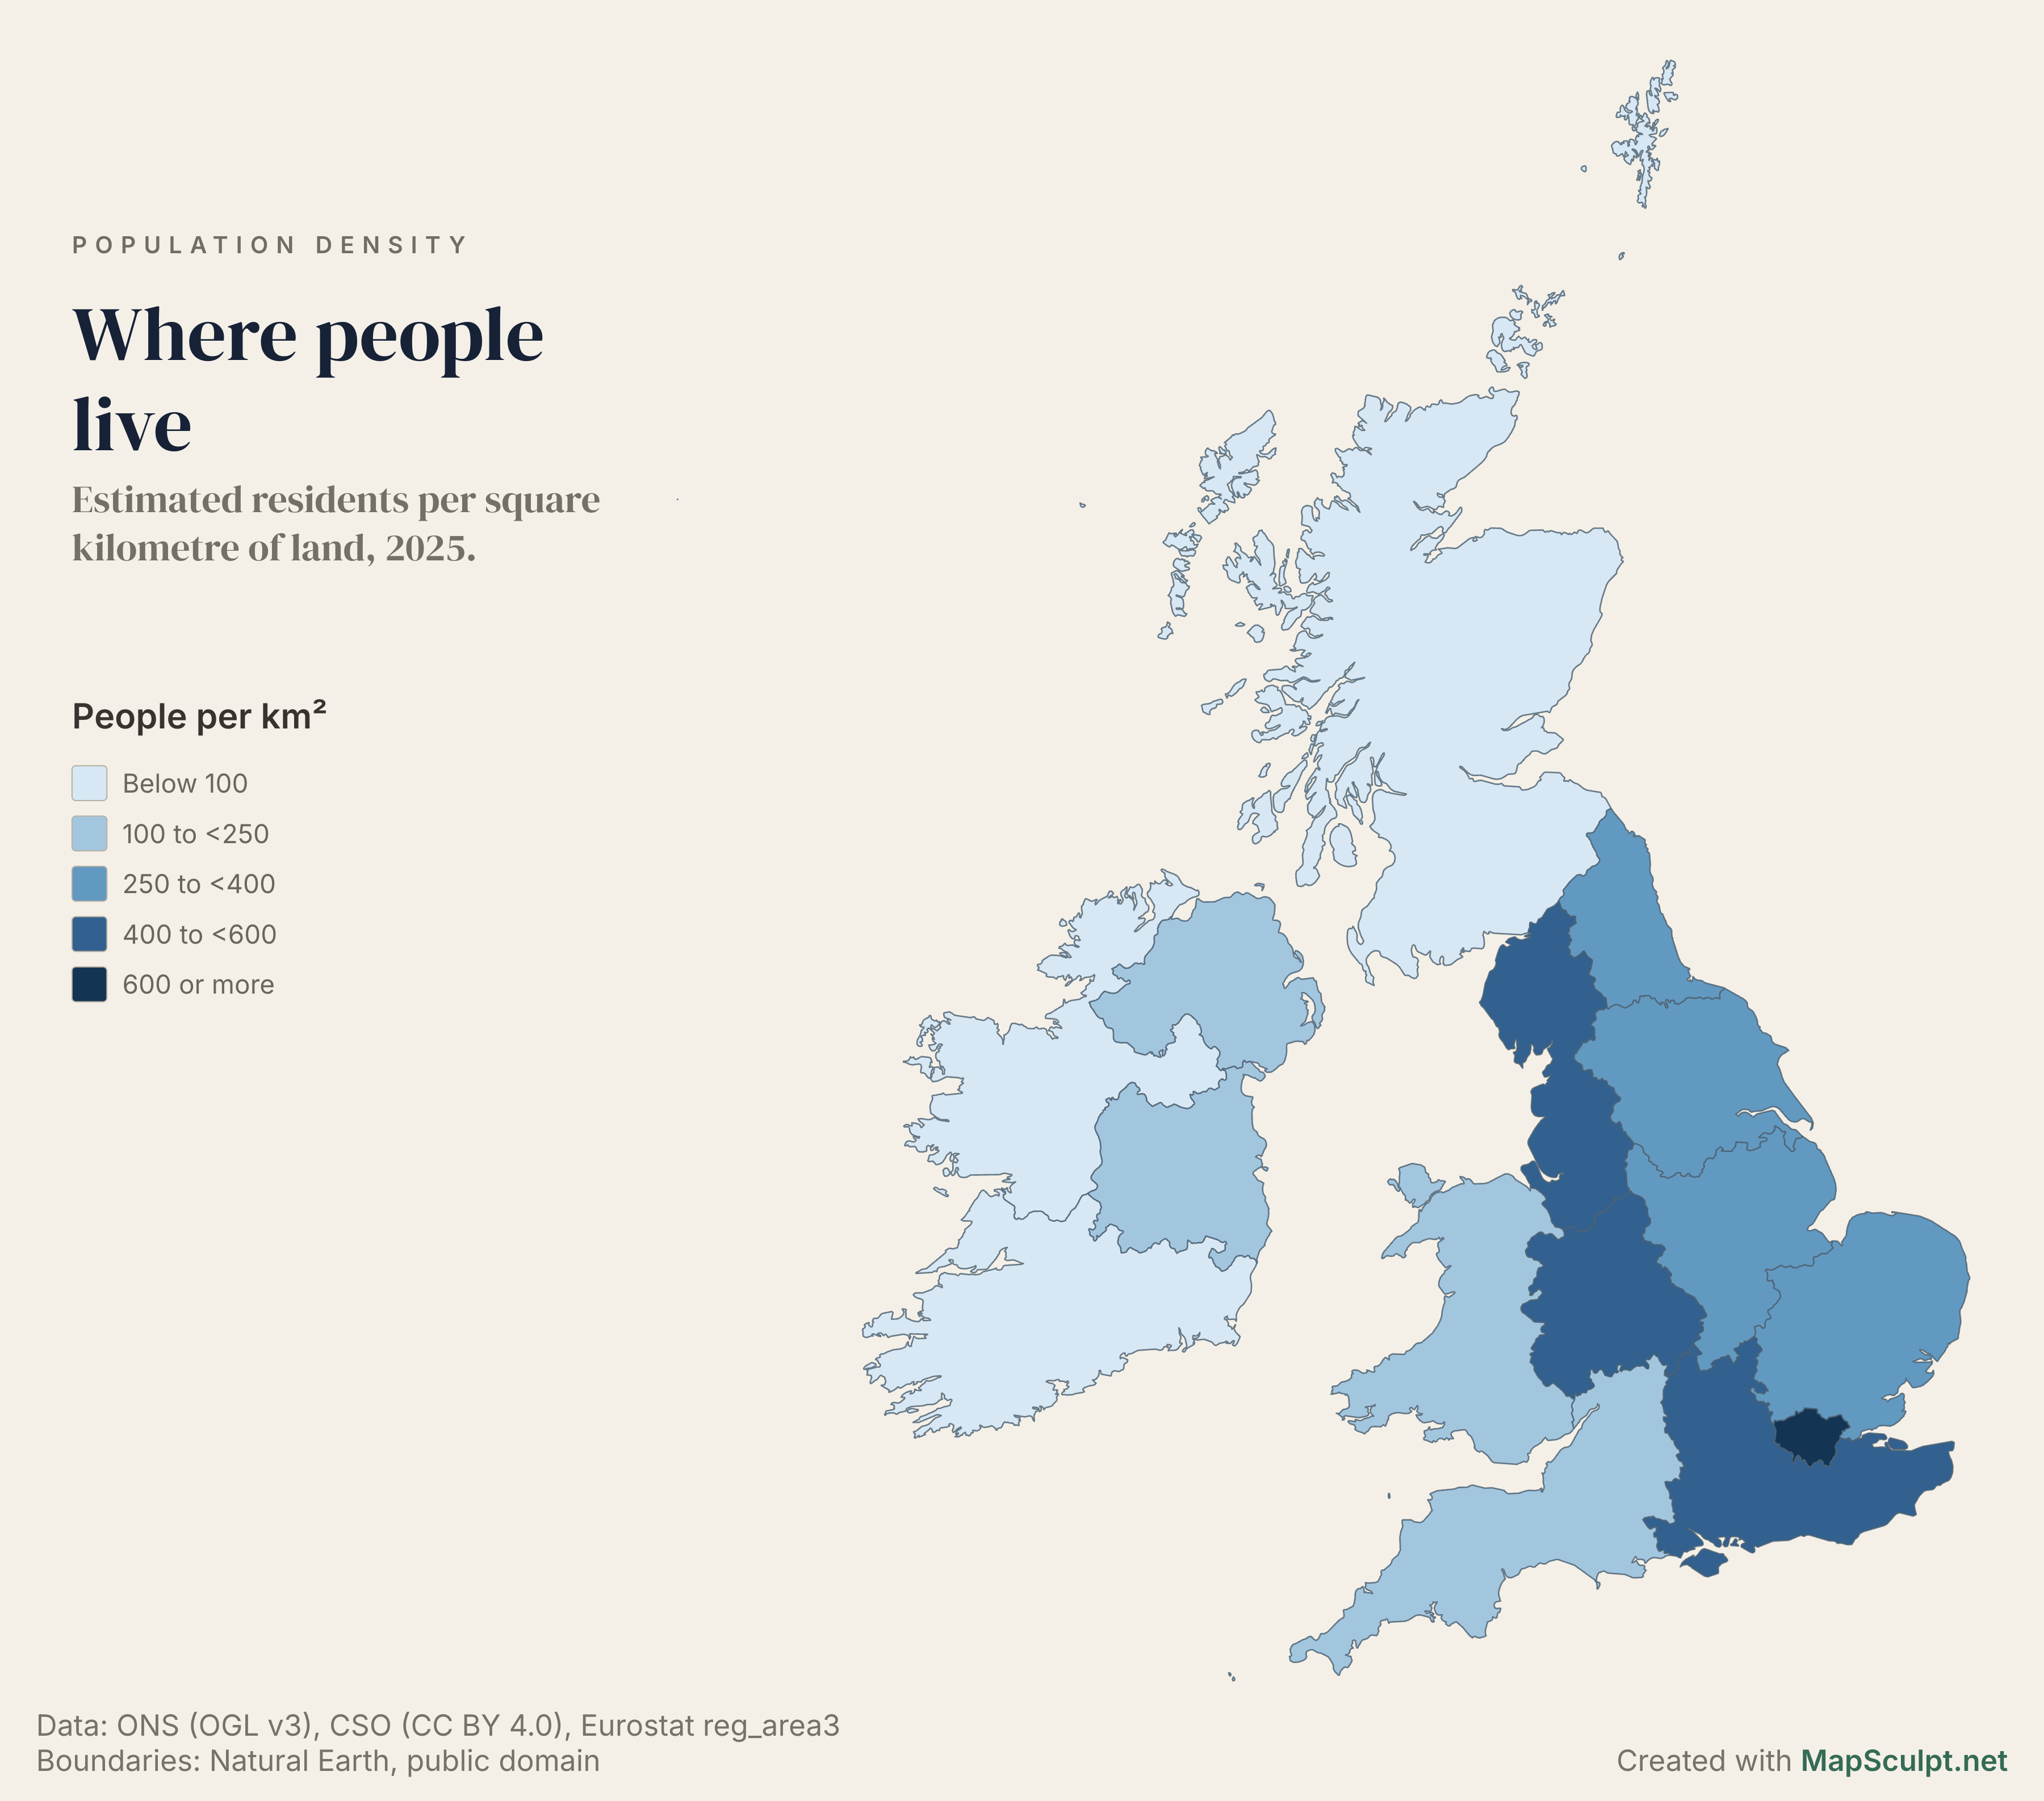
Population density
Where people live
Estimated residents per square kilometre of land, 2025.

People per km²
- Below 100
- 100 to <250
- 250 to <400
- 400 to <600
- 600 or more
London had about 5,804 residents per km² of land, compared with about 71 in Scotland. In Ireland, Eastern and Midland had about 188 residents per km², compared with 39 in Northern and Western.
Uses the UK’s 30 June and Ireland’s April 2025 population estimates. For Ireland, the regional totals combine the CSO’s NUTS 3 estimates and use Eurostat’s land area.
ONS mid-2025 estimates (MYE5) · CSO April estimates (PEA04) · Eurostat land area
Download full mapPopulation change
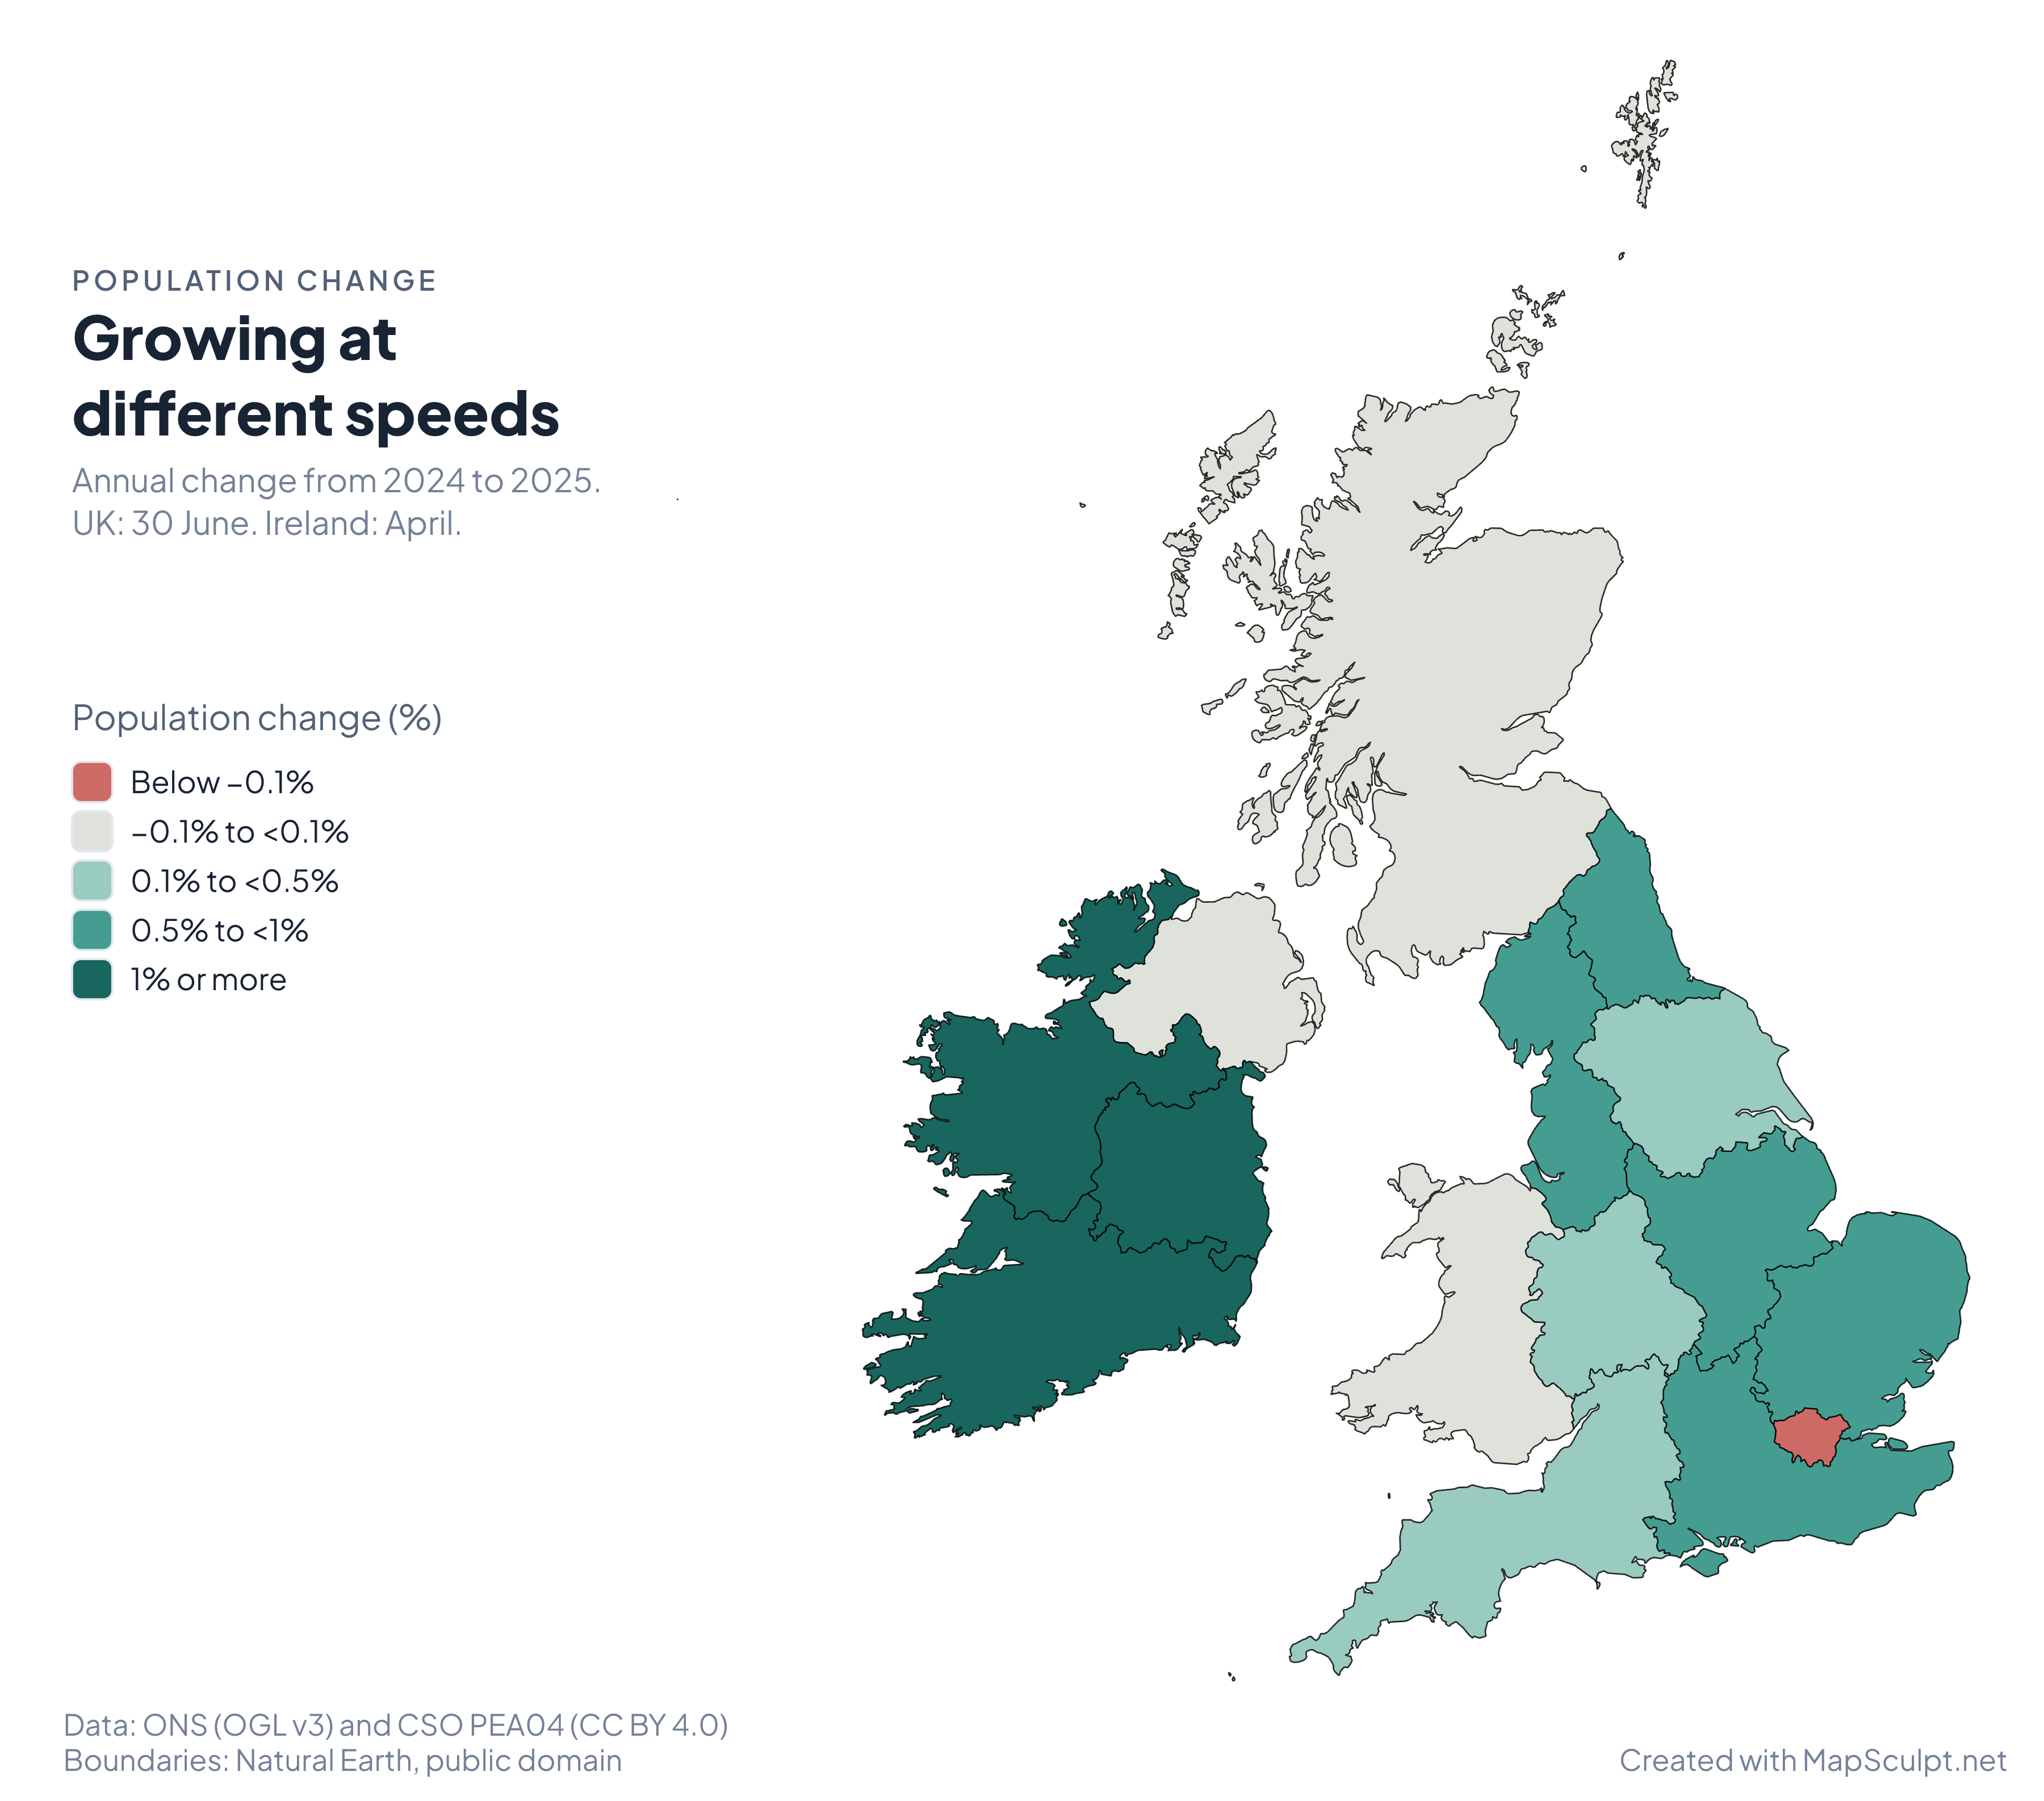
Growing at different speeds
Annual change from 2024 to 2025. UK: 30 June. Ireland: April.

Population change (%)
- Below −0.1%
- −0.1% to <0.1%
- 0.1% to <0.5%
- 0.5% to <1%
- 1% or more
Southern grew by 1.61%, the largest increase of Ireland’s three regions. The North West led the 12 UK areas at 0.74%, while London fell by 0.29%.
The UK estimates refer to 30 June and use revised mid-2024 figures from the same release. Irish estimates refer to April and are published in thousands. The rates compare each series with its own previous year.
ONS mid-2025 estimates (MYE5) · CSO April estimates (PEA04)
Download full mapIllustrative itinerary
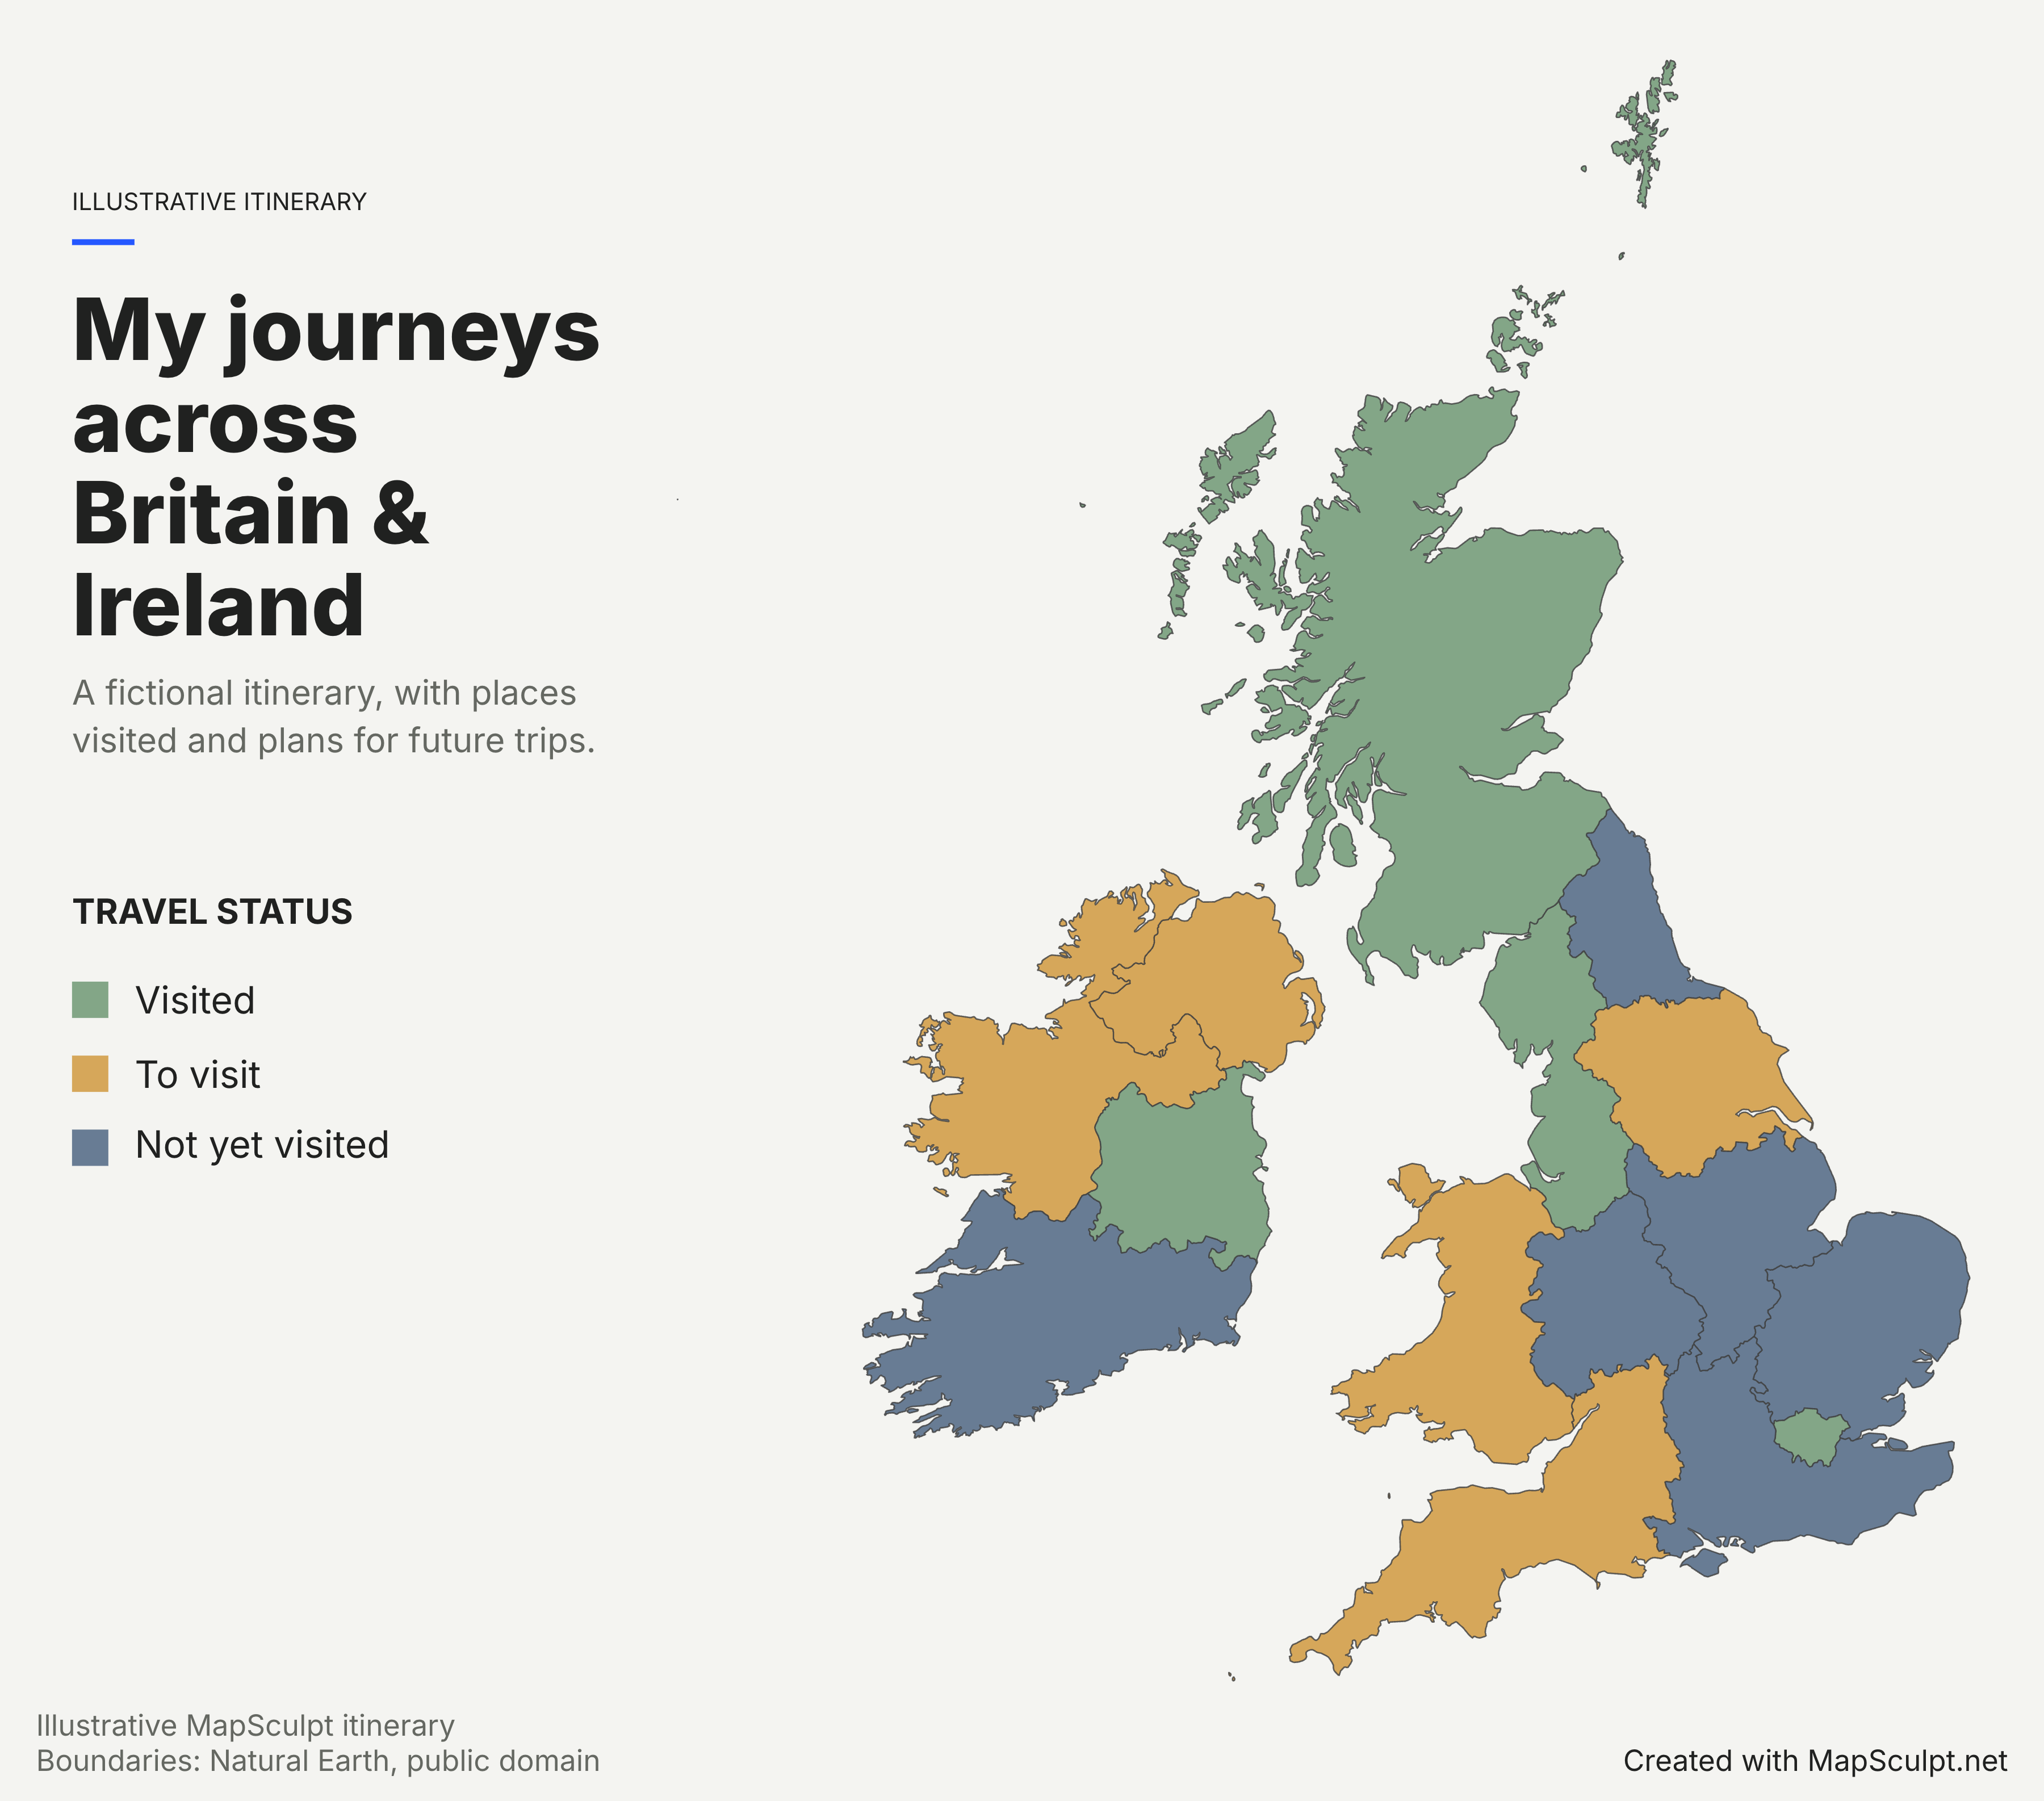
My journeys across Britain & Ireland
A fictional itinerary, with places visited and plans for future trips.

Travel status
- Visited
- To visit
- Not yet visited
Mark places you’ve been and places you’d like to go. This fictional itinerary uses three categories to show how a travel map works.
Download full mapKnow your geography
15 regions across the UK and Ireland
The UK side follows ITL 1, the first level of the UK’s International Territorial Levels. The Republic of Ireland side follows the EU’s NUTS 2 statistical classification. Northern Ireland has its own selectable area.
Use this map to compare whole regions. County and local authority boundaries sit below the scale available in this editor.
See all 15 regions- England
- 9 · UK · ITL 1
- Other UK areas
- 3 · UK · ITL 1
- Republic of Ireland
- 3 · Ireland · NUTS 2
Make it yours
From regions to a finished map
Choose your regions
Open the UK & Ireland editor. Select an individual area, or choose England or Ireland as a group.
Import your data
Upload a CSV with one row per region. Check the matches, then choose a column to colour by.
Customise the design
Choose colours, add a title and organise your legend. Adjust the canvas to suit your report or slide.
Download your map
Choose a PNG size and decide whether to include your title and legend in the export.
From CSV to map
Your spreadsheet. Your map.
The sample includes all 15 areas. In the editor, choose Import CSV, match on Region, and select Population change (%) as the value column. Choose Numerical to group the values into ranges. Values are in per cent, so 1.61 means 1.61%.
| Region | Change (%) |
|---|---|
| London | -0.29 |
| North West | 0.74 |
| Northern Ireland | 0.03 |
| Southern | 1.61 |
Population change
Growing at different speeds
Annual change from 2024 to 2025. UK: 30 June. Ireland: April.
Population change (%)
- Below −0.1%
- −0.1% to <0.1%
- 0.1% to <0.5%
- 0.5% to <1%
- 1% or more
Regional directory
Explore all 15 regions
The codes are ONS area codes for the UK and NUTS 2 codes for Ireland. Use the names for CSV matching.
UK · ITL 1
England
- North East
E12000001 - North West
E12000002 - Yorkshire and The Humber
E12000003 - East Midlands
E12000004 - West Midlands
E12000005 - East of England
E12000006 - London
E12000007 - South East
E12000008 - South West
E12000009
UK · ITL 1
Other UK areas
- Scotland
S92000003 - Wales
W92000004 - Northern Ireland
N92000002
Ireland · NUTS 2
Republic of Ireland
- Northern and Western
IE04 - Southern
IE05 - Eastern and Midland
IE06
For a UK-only map, explore the UK Regions Map Maker. For wider context, see the Europe Map Maker.
THE MAPSCULPT COLLECTION
Choose your map.
Find your geography. Add your perspective.
98 maps / 8 collections
Countries, regions and counties. Ready for your ideas.
Sort maps
Germany
States
United Kingdom
Regions
France
Regions
France
Departments
Italy
Regions
Spain
Autonomous communities
Ukraine
Regions
Poland
Voivodeships
Romania
Counties & Bucharest
Netherlands
Provinces
Belgium
Provinces & Brussels
Portugal
Districts & autonomous regions
Czechia
Regions
Czechia · Districts
77 districts including Prague
Sweden
Counties
Hungary
Counties & Budapest
Austria
States
Switzerland
Cantons
Bulgaria
Provinces
Denmark
Regions
Finland
Regions
Norway
Counties
Latvia · Municipalities
35 municipalities + 7 state cities
Luxembourg · Cantons
12 cantons
California
Counties
Texas
Counties
Florida
Counties
New York
Counties
Pennsylvania
Counties
Illinois
Counties
Ohio
Counties
Georgia
Counties
North Carolina
Counties
Michigan
Counties
New Jersey
Counties
Virginia
Counties
Washington
Counties
Arizona
Counties
Tennessee
Counties
Massachusetts
Counties
Indiana
Counties
Missouri
Counties
Maryland
Counties
Colorado
Counties
Wisconsin
Counties
Minnesota
Counties
South Carolina
Counties
Alabama
Counties
Louisiana
Parishes
Kentucky
Counties
Oregon
Counties
Oklahoma
Counties
Connecticut
Planning regions
Utah
Counties
Nevada
Counties & Carson City
Iowa
Counties
Arkansas
Counties
Kansas
Counties
Mississippi
Counties
New Mexico
Counties
Idaho
Counties
Nebraska
Counties
West Virginia
Counties
Hawaii
Counties
New Hampshire
Counties
Maine
Counties
Montana
Counties
Rhode Island
Counties
Delaware
Counties
South Dakota
Counties
North Dakota
Counties
Alaska
Boroughs & census areas
Vermont
Counties
Wyoming
Counties
1–12 of 50 state maps
FAQ
Common questions about UK & Ireland maps
How many regions are included?
There are 15 editable areas: nine English regions, Scotland, Wales, Northern Ireland and three statistical regions in the Republic of Ireland.
Can I colour individual regions?
Yes. Select any region and choose its colour. You can also colour the English or Irish regions as a group, then customise individual regions.
Does the map include Northern Ireland separately?
Yes. Northern Ireland is one selectable UK area. It is separate from Northern and Western, which is a statistical region in the Republic of Ireland.
What are the three regions of the Republic of Ireland?
Northern and Western (IE04), Southern (IE05), and Eastern and Midland (IE06). These are NUTS 2 statistical regions.
Can I create a map from CSV data?
Yes. Use the region names in the directory and one row per area. If your spreadsheet uses official statistical codes, convert them to the matching names before you import.
Can I download a blank UK & Ireland regional map?
Yes. Open the editor, leave the regions in the default fill, and export a PNG with the title and legend turned off.
Can I download a high-resolution PNG?
Yes. Each example has a high-resolution annotated PNG. In the editor, choose a PNG size suited to your own map.
Is the map maker free?
Yes. You can colour the regions, import a CSV and export a PNG for free.
Can I use the maps in reports and presentations?
Yes. Use the full PNG to keep its legend and source credit alongside the map. For your own data, retain any attribution required by the data publisher.
How does this differ from a UK counties map?
It works at regional scale. For example, England is divided into nine regions and Scotland is one area. Ceremonial counties, council areas and Ireland’s 26 traditional counties cannot be coloured individually here.
Make it yours